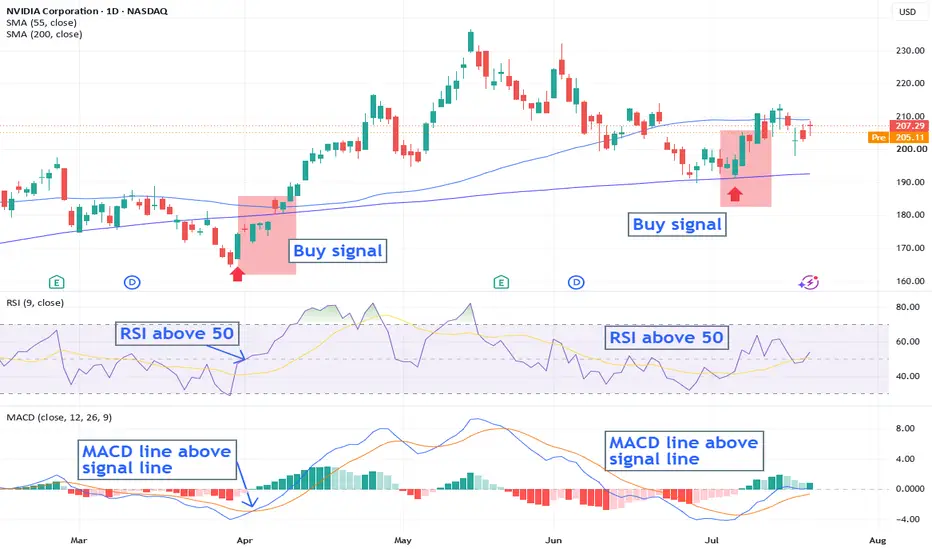
3 Indicators I Use as a Market Dashboard — Not as Trade SignalsI stopped asking “Which indicator is the best?” a long time ago.
That question usually leads traders into the same trap: adding more tools, more signals, and more confusion.
Now I prefer something simpler.
Before I trade, I want answers to only three questions:
Where is price trying to go?
Does the move still have energy?
Is there enough participation behind it?
For that, I use EMA, RSI, and Volume.
EMA — Direction
I do not use EMA because price “must bounce” from it.
I use it to unders
Relative Strength Index (RSI)
AUDUSD: The Setup That Didn’t Trigger - And What Happened NextFollowing the failed setup on Friday 21st, where the Cycle window opened but the market never produced a valid trigger, AUDUSD gave us a different picture on the 24th.
Two bearish topping setups developed and, this time, both produced the required confirmation and triggered.
The result was a move lower into the projected Cycle low, where price is currently sitting.
This is exactly why I separate the process into three stages:
Cycle Analysis gives me the window.
RSI confirms the setup.
Price
3 Indicators That Help Me Read the Market More ClearlyMany traders load their charts with too many indicators and eventually end up not knowing which one to trust.
In my view, an indicator is only useful when each tool answers a different question .
If I had to keep just three, I would choose:
EMA to read the trend.
RSI to read momentum.
Volume to measure market participation.
1. EMA — Which Side Has the Advantage?
EMA gives me a quick view of whether price is trading above or below its recent average.
When price holds above the EMA and conti
BTC 15mins - will it break or hold?The 80 period cycle is approaching a projected peak, and price has already made the sharp advance into that window. RSI has also pushed above the 60 level, which puts us in the right area to start looking for the bearish confirmation. What I find interesting is that RSI has subsequently pulled back toward 60 rather than continuing higher.
That is the point where I would become interested in whether the bearish setup can develop. The RSI has made the initial move we need, but the confirmation is
How Real Traders Use Price ActionA chart gets messy when every indicator is trying to make the decision for you.
At AURICVERSE, we look at it differently.
Price Action, MA and RSI don’t need to compete. Each one should answer one different question.
Price Action tells us what price is doing.
Not what we hope it will do.
A rejection, failed breakout, strong close or structure shift matters because it shows where buyers or sellers are actually responding. That’s where the trade idea begins.
The MA tells us which side has the
BITCOIN ANALYSIS (WEEKLY CHART)The largest crypto is showing consolidation before showing volatile moves, which is expected to be on the bullish side.
Bitcoin testing a confluence of support
1. The price is resting in the golden fib zone after testing the fib level 0.618 (Fibonacci drawn from Nov 2022 lows to recent Sep 2025 highs).
2. Bitcoin bounced after testing the VWAP anchored at Nov 2022 lows
3. The Demand order block
4. A head & shoulders pattern gets completed, and prices are resting at the neckline
Note: Whil
GBPUSD: Weekly Diagonals Are Compressing — Strong Move AheadGBPUSD is at an interesting decision point on the 4H chart.
The Weekly Magic Diagonals are compressing into a tight cluster. When these time-based diagonal levels come together like this, I usually expect a stronger impulsive move to follow. The direction is not confirmed yet.
Right now, price is testing the gray middle line of the Monthly Magic Diagonals channel and is trying to stay below it.
For the bearish scenario, I want to see a confident close below this gray line. If price can hold b
Evaluating Potential Reversal Conditions Near Major SupportMarket Context & Structural Alignment
The EUR/USD pair is currently approaching a critical technical pivot after pulling back from its recent swing highs. As price action gradually stabilizes around key structural demand levels, broader market dynamics suggest that short-term selling pressure is beginning to fade, opening up a potential opportunity for a bullish rotation toward upper resistance boundaries.
Rather than entering market orders prematurely or attempting to catch a falling price wa
Gold: I’m Looking Only for a Sell SetupGold continues to move higher, but at this point I am no longer interested in buying it. I am looking only for a sell setup.
The main reason is the bearish signal from **RSI Smart Divergence**.
With my current settings, the indicator is selective: it looks for divergence between confirmed RSI pivots, and in this mode both divergence points must be formed completely outside the normal RSI range.
On the current 2-hour chart, a strong bearish divergence has formed in the overbought area. Price c
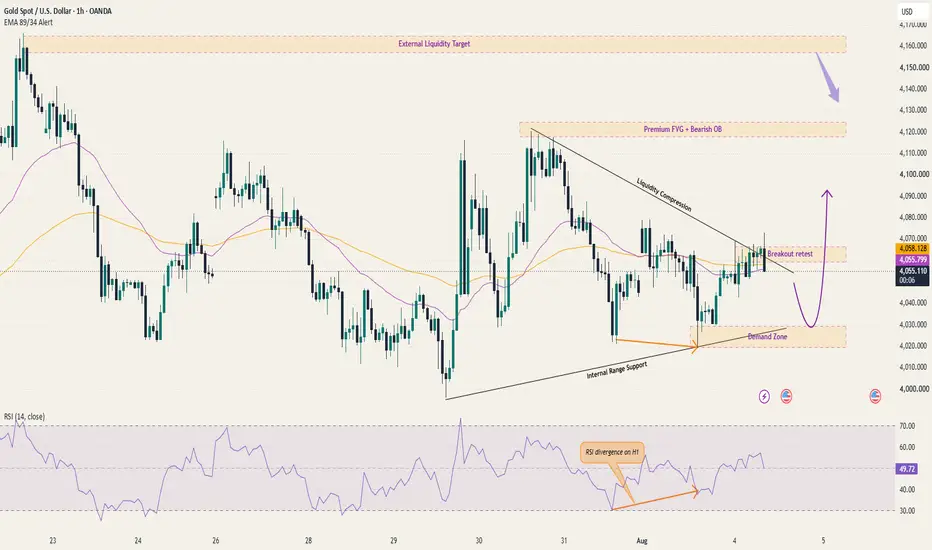
XAUUSD — Bullish Breakout Retest
Gold is holding a firmer tone as geopolitical uncertainty continues to support defensive demand, while traders focus on upcoming US labor-market data for the next shift in interest-rate expectations.
However, the stronger-than-expected US manufacturing PMI and elevated input costs may keep Treasury yields and the dollar supported, potentially limiting the strength of the recovery. Attention now turns to job openings, private employment data and Friday’s employment report.
Technical Analysis
Webull (BULL) 1DWebull (BULL) is currently trading at a point where the company’s name feels almost ironic. The “bull” has been walking downhill for months, compressing inside a descending wedge, while investors wait for the earnings report on March 4, 2026 to decide whether this is capitulation or accumulation.
Webull is a digital brokerage platform focused on retail traders. Revenue is primarily driven by options trading, margin interest, payment for order flow, market data services, and premium subscript
It perfectly touched the RSI trendline right before the close?Hello, this is Chartinfo. The market is just about to close, and I'm planning to try a long position on Gold.
My thoughts haven't changed from the previous post—I still believe it's better for it to move up while building that red accelerating trendline (RSI).
So I entered at $4,042 and set my stop loss just below $4,000.
Isn't it fascinating how the price parked exactly on the trendline right before the close?
HOOD Oversold at HTF WCL | RSI Bullish DivergenceHOOD has now reached a higher-timeframe WCL and also met + exceeded the bearish C target , which tells me price is trading in an oversold location .
What makes this area more interesting is that RSI is showing regular bullish divergence inside the WCL , which adds a bullish reaction signal right where I would want to see one.
So from a structure standpoint, this is not a random bounce area.
It is a zone where price has already stretched into a key HTF reaction point, while momentum is sta
XAUUSD — Bearish Retest in FocusFundamental View
Gold remains sensitive to changes in the US dollar, Treasury yields and interest-rate expectations. Renewed strength in yields could maintain short-term pressure, while softer macro conditions may support corrective rebounds.
Technical View
On the M30 chart, XAUUSD rebounded from the 4,020 area after RSI formed a bullish divergence near oversold territory. This momentum signal supported the current recovery toward the moving-average resistance structure.
Price is now trading
(UPD) NNE: Are the bears ready for a short squeeze? NASDAQ:NNE
Greetings, colleagues! I‘m updating the technical picture for NANO Nuclear Energy Inc. on the weekly timeframe as a follow-up to my previous publication.
An extremely interesting entry setup is developing: after a prolonged decline from the all-time high of $60.87, price is trapped inside a descending wedge and is approaching its apex, which historically precedes a powerful impulsive breakout.
The current drop has brought us into the key medium-term support zone of $15.00–$15.60
Which Momentum Indicator Is Best?I recently asked traders which momentum indicator they use most often.
The responses were interesting. While there was no overwhelming winner, the poll confirmed something I've observed throughout my career: there is no single "perfect" momentum indicator. Each has strengths and weaknesses, and much depends on how you incorporate it into your overall analysis.
What 35 Years in the Markets Taught Me
During my years as a bank technical analyst, my research was used by fund managers, central ba
Gold M15: Triangle BreakdownTriangle Breakdown or Another Liquidity Trap Before the Next Move?
Gold is compressing inside a descending triangle while trading below both the 50 EMA and 200 EMA, keeping short-term momentum bearish.
The 4020 support is the key level to watch. A confirmed breakdown could expose the next liquidity pocket around 3990–4000. However, with US Retail Sales and Jobless Claims approaching, false breaks and liquidity sweeps remain highly likely.
📍 Bias: Bearish below 4039.
📍 Support: 4020 → 3990 liq
$SOX Short Term Momentum Shift in Play?Taking a close look at the 4Hr timeframe for the actionable setup, while keeping the Daily chart in view to maintain perspective on the broader picture.
Key Technical Observations
Support Holding Firm: NASDAQ:SOX recently tested and bounced cleanly off key horizontal support, indicating buyers are stepping in to defend this level.
Gap Analysis:
The gap to the upside remains relatively minuscule.
The newer gap formed today is a tad larger, creating a clear short term liquidity target above.
NNBR: Multi-Year Base + Bullish Divergence ClusterNNBR: Multi-Year Base + Bullish Divergence Cluster
NNBR is showing an interesting weekly turnaround setup after a long multi-year decline and compression phase.
This is not a confirmed breakout yet. I would treat it as a conditional long setup that still needs confirmation above the descending structure.
What I see on the weekly chart
1. Multi-year compression
After the large historical moves in 2014–2018, the stock entered a long decline and then started building a base.
From 2022 to 2026
BTC Update: Selling Pressure Fades at Support🔍 Technical Analysis (H4 Timeframe)
Bullish Signs: On the daily chart, consecutive candlesticks with long lower shadows combined with a Bullish Divergence on the RSI signal that selling momentum is exhausting.
Rebound Potential: If buyers successfully defend the current support zone, we can expect a technical rebound to retest the 61K – 62K resistance area.
⚠️ Key Scenarios to Watch
The Bull Case: The 61K – 62K zone remains a crucial pivot. BTC needs a strong breakout and a daily close above th
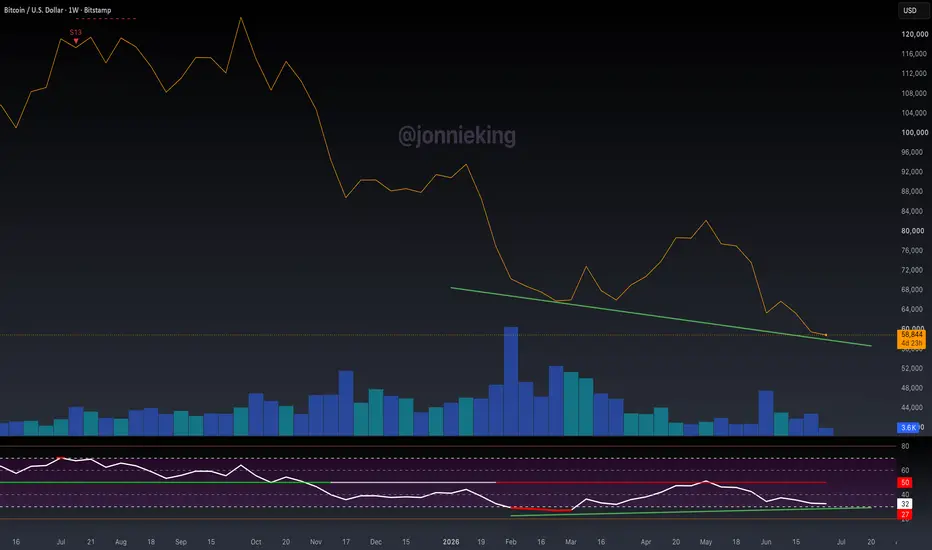
$BTC Very WEAK Bullish Divergence LESSON - Must ReadLately I’ve been seeing a ton of large accounts calling for a
CRYPTOCAP:BTC bottom because of the extremely weak bullish divergence on the Weekly chart.
This means absolutely nothing without confluence from PA, volume and other indicators-- all which are horrendous, such as volume which you can clearly see.
If PA keeps going lower, the bull div goes away, along with this silly bull-slop.
Example:
Low #1: BTC = $65,200 RSI = 27
Low #2 (today): BTC = $58,500 RSI = 32
That's a bullish RSI di
Gold’s Bizarre AdventureWhat in the world is PEPPERSTONE:XAUUSD Gold doing lately? If you’ve been watching the charts since mid-May, you might feel like you’re on a roller coaster where the safety bar is slightly loose. After our last correction ended, Gold has been in a relentless downward grind.
Let’s put on our technical goggles and break down why things are getting weird, why the Bulls are sweating, and where we might be heading next.
📉 The Technical Picture: Riding the ABC Down
Looking at the chart since the m
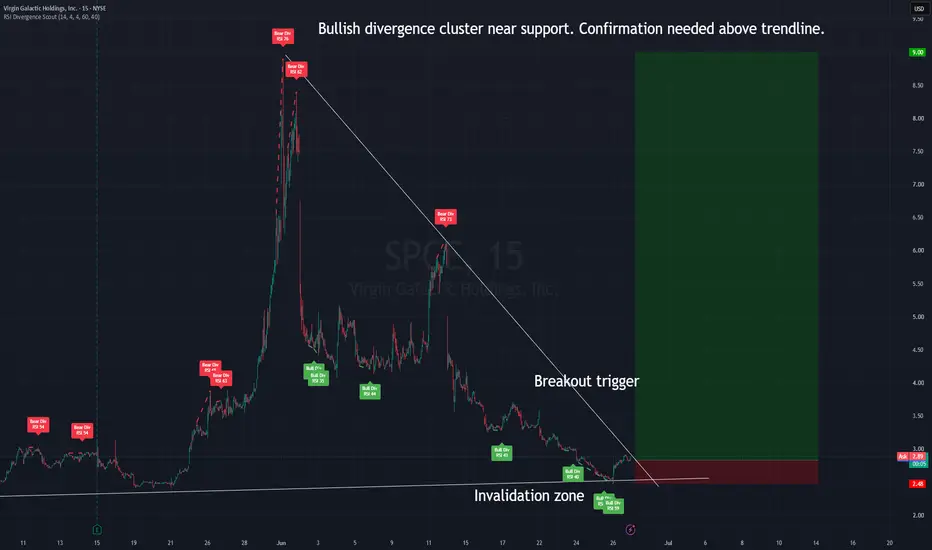
SPCE: Bullish Divergence Near Support — Conditional Long SetupSPCE is showing a possible reversal setup after a long decline from the previous momentum spike.
This is not a confirmed trend reversal yet. The chart is still under a descending structure, so I would treat this as a conditional long setup rather than a blind buy.
What I see on the chart
1. Bullish divergence cluster
Several bullish RSI divergence signals appeared near the lower part of the move.
This means price continued to push lower, but RSI started to show less downside momentum. That
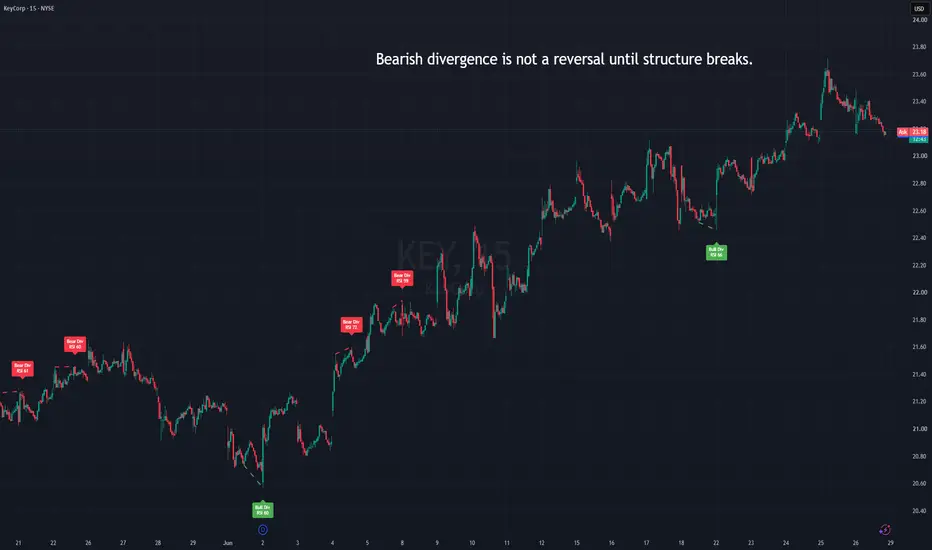
Why RSI Divergence Fails in Strong TrendsRSI divergence is useful, but it is often misunderstood.
Many traders see bearish divergence and immediately expect a reversal. The problem is that divergence does not mean price must reverse. It only means that momentum is no longer confirming the latest price move.
In a strong trend, this can happen several times before price actually changes direction.
What bearish RSI divergence shows
Bearish RSI divergence appears when:
– price makes a higher high
– RSI makes a lower high
This means u