GOLD - A countertrend correction to 4,400 ahead of the newsICMARKETS:XAUUSD remains under pressure from a strengthening dollar and a weak fundamental backdrop. The market is making new intermediate lows within the 4,290–4,500 trading range. Key news is ahead…
The dollar is bouncing from support and returning to its bullish momentum, putting further pressure on the market. Gold is trading near its weekly lows, around $4,310, on Friday following a sharp decline triggered by hotter-than-expected PPI data and rising oil prices.
According to TD Securities, a hawkish Fed may only delay the next move higher in gold rather than trigger a deeper decline, as support remains in place from dollar debasement, central bank purchases, and ETF inflows. The market is now waiting for the key U.S. CPI report.
Drivers:
Upside: soft CPI, dollar weakness, falling yields, central bank purchases, ETF inflows.
Downside: hot CPI, hawkish Fed rhetoric, dollar strength, rising yields
Resistance levels: 4,389, 4,400, 4,435
Support levels: 4,345, 4,300, 4,287
Gold is making new lows but has yet to reach the key target. A countertrend correction is forming ahead of the upcoming news. A short squeeze around the 4,390–4,400 zone could trigger another decline toward the 4,285 liquidity zone
Best regards,
R. Linda!  Short
Short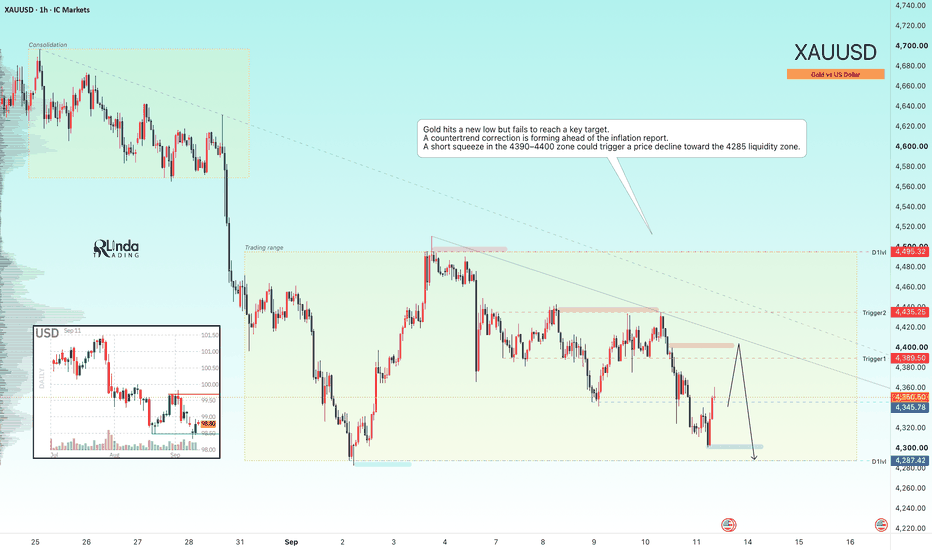
BITCOIN - A correction within a consolidation phaseBINANCE:BTCUSDT.P reached a new cycle high at 82,300, but still failed to reach the key target. The market remains in consolidation, within which a countertrend correction is developing
The fundamental backdrop remains unstable, but relatively favorable for the market. Against this backdrop, Bitcoin continues to consolidate within the current range. On September 15, the Senate is scheduled to hold another vote on the CLARITY Act.
The market has been range-bound between 76,400 and 81,300 for the third consecutive week. Technically, a local wedge is forming within the range, and Bitcoin could test the support cluster before attempting another move higher. The bullish structure remains intact, and during the correction, price could test the 77,000–76,400 liquidity pool
Resistance levels: 79,470, 80,500, 81,270
Support levels: 77,000, 76,390
The correction appears to be aimed at a potential liquidity hunt. The key focus remains on the support zones mentioned above. A long squeeze could become a technical catalyst for the continuation of the uptrend
Best regards,
R. Linda!  Long
Long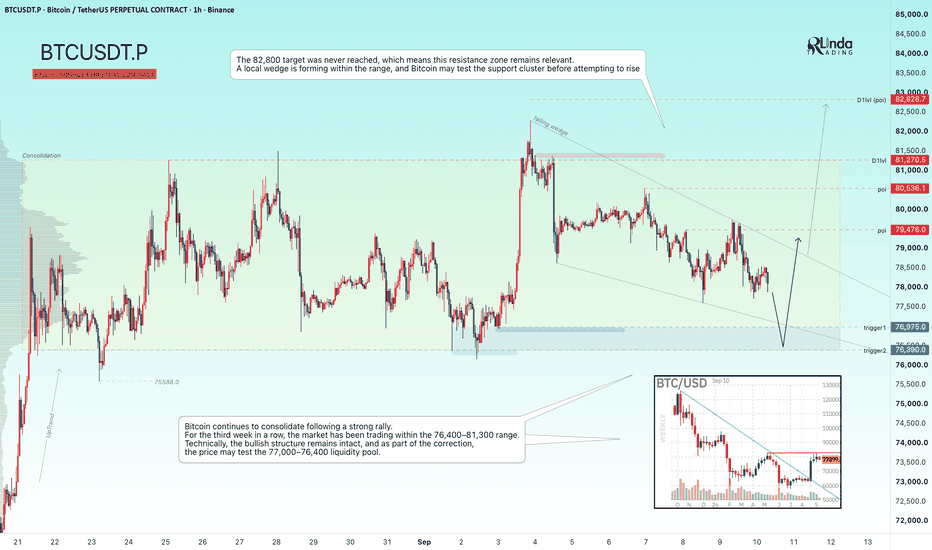
 Long
Long
 Long
Long
XAUUSD — Medium-Term Bearish Wave Toward 3,836
Gold is showing a medium-term bearish Elliott Wave structure after failing to recover above the descending channel resistance. From Kelly’s view, the chart suggests that XAUUSD is still moving inside a broader downside trend, and the current rebound may only be a correction before the next bearish wave continues.
The key idea is simple: gold may retest support first, then create a short recovery, but as long as price stays below the descending trendline and resistance structure, the priority scenario remains bearish for next week.
⟡ Market structure
Gold is currently trading around 4,349, still below the main descending channel. The previous bullish trendline has already been weakened, and price is now moving under bearish pressure.
The first important level to watch is the 4,282–4,300 strong support area. If gold breaks below this zone, the next downside path may open toward 4,230, then the 4,090–4,110 Buy zone wave 4.
For the medium-term structure, if sellers continue to control the market, gold may extend lower toward the final Done wave 5 area near 3,836–3,850.
➤ Key levels
◌ Current price area: 4,349
◌ Short-term resistance: 4,360–4,390
◌ Strong support: 4,282–4,300
◌ Next downside level: 4,230
◌ Buy zone wave 4: 4,090–4,110
◌ Main bearish target: 3,836–3,850
◌ Bearish invalidation: above 4,430–4,450
⌁ Elliott Wave view
The chart is showing a possible bearish continuation structure.
Wave (1) started after price rejected from the upper zone.
Wave (2) created a corrective rebound but failed below the descending resistance.
Wave (3) may now continue lower toward 4,230 and 4,096.
Wave (4) could later create a short recovery from the lower buy zone.
Wave (5) may complete the larger bearish cycle near 3,836–3,850.
This is why Kelly does not treat the current bounce as a confirmed bullish reversal. The recovery is still under resistance, and the market needs a strong breakout above the trendline before the bearish wave count becomes weaker.
▸ Trading scenario
Preferred bearish scenario
Entry: Sell on rejection around 4,360–4,390, or after price breaks below 4,282 and retests weakly
Stop Loss: Above 4,450
Take Profit 1: 4,282–4,300
Take Profit 2: 4,230
Take Profit 3: 4,090–4,110
Take Profit 4: 3,836–3,850
Alternative scenario
If gold breaks above 4,430–4,450 and holds above the descending trendline, the bearish setup becomes weaker. In that case, price may attempt a stronger recovery before the next sell setup appears.
◌ Invalidation
The bearish view becomes weaker if gold reclaims 4,430–4,450 with strong bullish momentum. A clean hold above this zone would suggest that the current downside wave is losing strength.
⌁ Kelly’s view
Kelly’s main view for next week remains bearish while gold stays below the descending channel resistance. The structure still favors selling rebounds rather than chasing buys.
If sellers break 4,282–4,300, gold may continue toward 4,230, then 4,090–4,110. The larger Elliott Wave target remains near 3,836–3,850 if bearish momentum extends.
Do you think gold will break strong support next week, or create one more rebound before wave (5) continues lower? Short 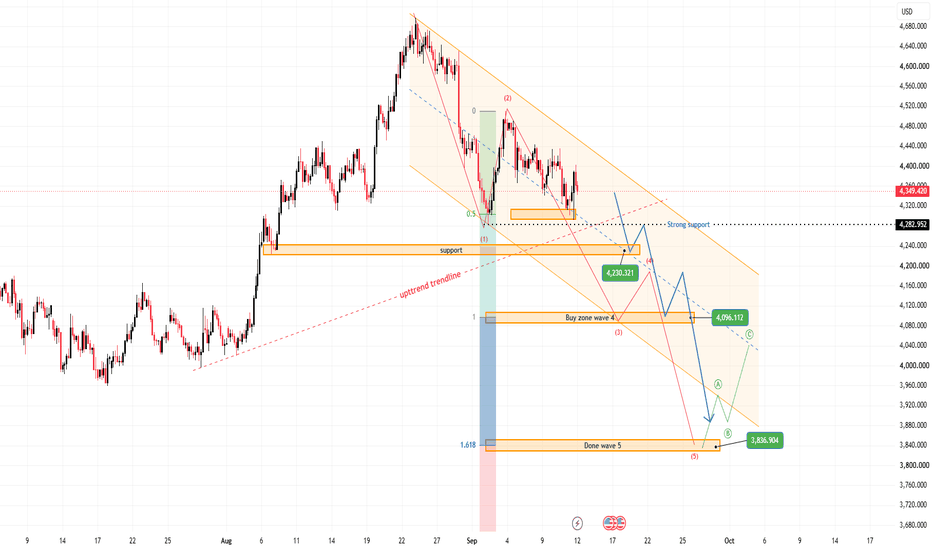
XAUUSD — Bullish Retest Toward 4,425
Gold is showing a short-term bullish recovery after completing the previous downside wave near the lower support area. From Kelly’s view, the current chart suggests that XAUUSD may be forming a corrective bullish structure, with price now reacting from the 4,334–4,340 buy retest support zone.
The key idea is simple: if gold holds above this support, the next recovery leg may continue toward the 4,420–4,435 strong resistance area.
⟡ Market structure
Gold recently completed a bearish 5-wave sequence and is now trying to rebuild from the lower zone. Price is trading around 4,351, slightly above the buy retest support.
The current structure looks like a possible ABC recovery. Buyers are trying to defend the 4,334–4,340 area, while the next major upside target remains the strong resistance zone near 4,420–4,435.
However, gold is still trading below the descending trendline, so the bullish setup needs confirmation. A clean move above 4,380–4,400 would strengthen the recovery and open the way toward the upper resistance.
➤ Key levels
◌ Current price area: 4,351
◌ Buy retest support: 4,334–4,340
◌ Key support: 4,300–4,315
◌ First bullish confirmation: above 4,380
◌ Main resistance: 4,420–4,435
◌ Strong breakout confirmation: above 4,435
◌ Bullish invalidation: below 4,300
⌁ Elliott Wave view
The chart suggests that the previous bearish wave may have already completed near the 4,300 area.
After that, gold started to form a short-term bullish recovery:
Wave A may be the first rebound from the low.
Wave B may be the retest into 4,334–4,340.
If this support holds, wave C may push price toward 4,420–4,435.
This is why Kelly is watching the current retest zone carefully. The bullish idea is valid only if buyers continue to defend support and price starts to break above the short-term resistance levels.
▸ Trading scenario
Preferred bullish scenario
Entry: Buy around 4,334–4,340 if price gives bullish confirmation
Stop Loss: Below 4,300
Take Profit 1: 4,380
Take Profit 2: 4,400
Take Profit 3: 4,420–4,435
Alternative entry
If gold breaks above 4,380–4,400 and retests this area as support, buyers may look for continuation toward 4,420–4,435.
◌ Invalidation
The bullish view becomes weaker if gold breaks below 4,300 and fails to recover back above the buy retest support. In that case, the recovery structure may fail and sellers could regain control.
⌁ Kelly’s view
Kelly’s main view is cautiously bullish while gold holds above 4,334–4,340. The market is showing signs of recovery, but price still needs to confirm strength above 4,380–4,400.
If buyers defend the current support, gold may continue toward 4,420–4,435, where the next key decision zone is waiting.
Do you think gold will complete wave C toward resistance, or retest the lower support one more time first? Long 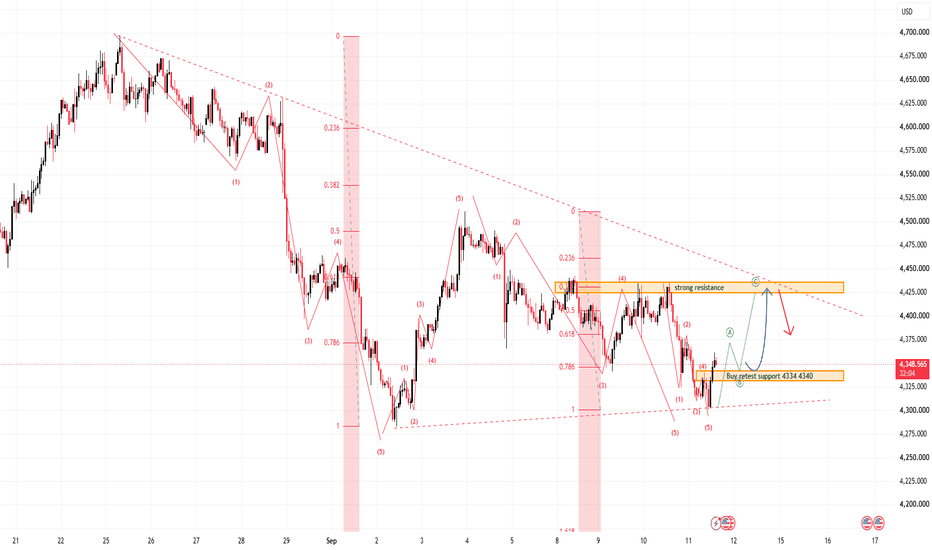
 Long
Long
Long 
GOLD - A Hunt for Liquidity Ahead of Further DeclinesICMARKETS:XAUUSD has been forming a countertrend correction since the session opened. The fundamental backdrop remains unstable, and this correction could end with another move lower
Gold remains exposed to two-sided risks ahead of the release of U.S. CPI data. The sell-the-bounce strategy remains in place, especially against the backdrop of higher-than-expected inflation in China. TD Securities expects core inflation to remain under control in August but warns of upside risks
Drivers:
Upside: weak U.S. CPI data, dollar weakness, de-escalation of the conflict.
Downside: hot CPI data, dollar strength, escalation of the conflict, hawkish Fed rhetoric
Resistance levels: 4,410, 4,435, 4,461
Support levels: 4,365, 4,287
A weaker dollar, driven by yen strength, is supporting gold. At the same time, however, gold remains under pressure from the Fed’s hawkish stance and geopolitical risks.
Technically, I expect a short squeeze around the 4,430–4,435 liquidity zone, followed by a decline toward range support at 4,365–4,287
Best regards,
R. Linda! Short 
 Long
Long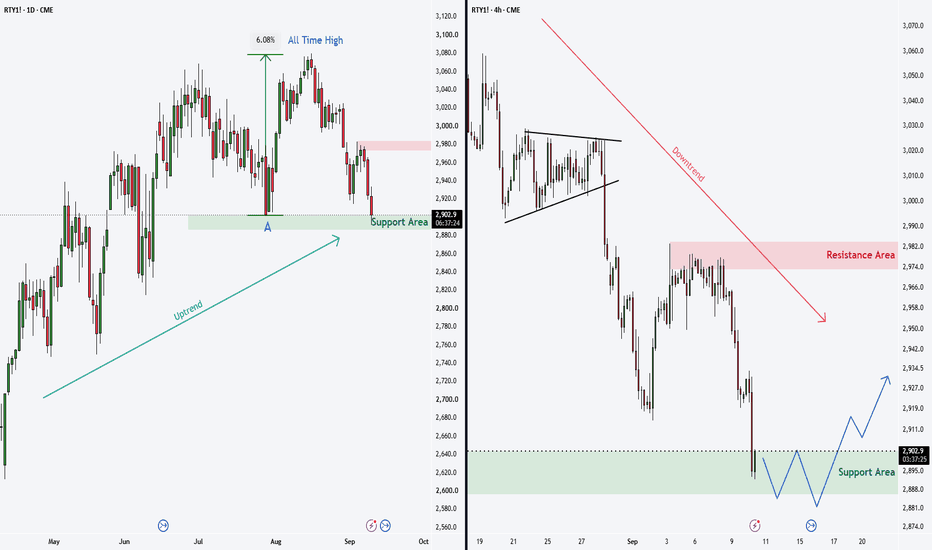
CADJPY 4H: Bullish Reversal Setup Off Key Support Zone Overview & Setup Parameters
Pair / Timeframe: CAD/JPY (4-Hour Chart)
Current Trading Price: ~111.334
Bias: Long / Bullish Reversal
Key Support Zone (Entry Zone): 110.830 – 111.330
Target Resistance (Take Profit): 113.340 – 113.500
Invalidation / Stop Loss: Below 110.500 (below major structural low)
📉 Technical Analysis
Major Support Test: CAD/JPY has retested a major horizontal support zone around 110.830–111.000, which historically held as a key structural base in late July / early August.
Trendline Breakout: Price action shows a clear breakout above a short-term descending trendline on the 4H timeframe, signaling an exhaustion of the recent downward momentum from early September.
Risk-to-Reward Dynamics: Entering near the current support zone allows for a tight stop loss placed below 110.500, offering a strong 1:3+ Risk-to-Reward ratio up to the overhead supply level near 113.340.
Key Overhead Levels:
Immediate Resistance: 113.000 – 113.340 (Prior broken support, now serving as target supply).
Major Structural Resistance: 114.800 – 115.000.
🌐 Fundamental Drivers
Crude Oil Correlation: The Canadian Dollar (CAD) remains closely tied to commodity price action, specifically West Texas Intermediate (WTI). Any rebound in global oil prices provides underlying support to CAD cross pairs.
Interest Rate Differential: Despite recent policy adjustments by the Bank of Japan (BoJ), the interest rate differential continues to favor the Canadian Dollar over the Japanese Yen, maintaining a positive carry trade sentiment on dip-buys.
Safe-Haven Sentiment: Broader market sentiment shifts directly influence Japanese Yen demand. A stabilization in market risk appetite reduces safe-haven inflows into JPY, aiding a bounce in CAD/JPY.
⚠️ Disclaimer
This trading idea is provided for informational and educational purposes only and does not constitute financial or investment advice. Foreign exchange trading involves significant risk of loss. Always exercise proper risk management, position sizing, and stop-loss placement before taking any trade positions. Tactical Risk-Off Broadens as MES Loses 7,670Tactical Risk-Off Broadens as MES Loses 7,670
Market Regime: Tactical Risk-Off / Downside Continuation
Macro Regime: Hostile Tilt
Systemic Stress: Not confirmed
Confidence: High
Wednesday confirmed that the market’s narrow repair attempt had failed.
MES lost the 7,670.50–7,682.25 support band and remained below it during the evening review. The significance was not limited to the index decline: equal weight, small caps, sectors and global equities broadly confirmed the deterioration.
A growing number of instruments have broken important trends or fallen through HVN/LVN boundaries. Several are now rejecting recovery attempts beneath those former support areas.
Breadth and Participation
Breadth provided decisive confirmation:
ADD fell to approximately –1,392.
VOLD finished near –626 million.
S5 breadth readings weakened to approximately 20.9, 37.0 and 56.9.
RSP lost 217.28, 215.32 and approximately 214.71 with weak CVD.
RTY accepted beneath its previous 2,948–2,927 support region.
YM lost its nearby HVN/LVN decision area.
XLY, XLF, KRE and XLP all showed structural deterioration.
This was not an isolated decline caused by one or two megacaps. Equal weight, small caps, cyclicals, financials, defensives and overseas markets participated.
XLP is becoming oversold, which increases the possibility of a tactical bounce. However, an oversold condition represents extension—not confirmation that the underlying structure has repaired.
Technology and Leadership
Technology remains internally divided.
AMD and MU are the clearest areas of semiconductor strength, with constructive price action and CVD. That strength has not spread consistently across the group:
SMH is holding near its primary HVN, but CVD remains weak.
NVDA is below the 226.99 region without convincing CVD support.
AVGO remains beneath its upper profile shelf.
MSFT, AMZN and GOOGL weakened around former support.
AAPL is sitting near an HVN but has not restored its upper shelf.
TSLA remains vulnerable around broken trend and profile structure.
META and ORCL are relative-strength exceptions, but leadership remains too concentrated to contradict the broader deterioration.
Semiconductors have not been completely abandoned, but they are not providing broad confirmation of a durable market repair.
Rates, Commodities and Global Markets
Treasuries added to the hostile macro backdrop.
The two-year yield was approximately unchanged to slightly lower, while five-, ten- and thirty-year yields rose. The ten-year approached 4.85% and the thirty-year moved toward 5.30%, resembling long-end or term-premium pressure rather than a sudden front-end policy shock.
TLT weakened alongside the rise in yields.
Crude near $97 adds another source of inflation and duration pressure. Gold remained comparatively stable rather than signaling an acute flight to safety.
Global equities also confirmed the broader risk-off move:
Nikkei declined approximately 1.3%.
Hang Seng declined approximately 0.9%.
DAX and Euro Stoxx broke into lower value.
FTSE declined toward a lower profile boundary.
BTC near $78,000 and ETH near $2,400 also reflected weaker speculative-risk appetite.
Volatility, Credit and Systemic Risk
VIX rose to approximately 16.47, VIX1D strengthened sharply and VX held near 18.6. Volatility RSI and CVD also improved, confirming tactical risk aversion.
However, the volatility curve remains in contango. HYG/LQD softened only marginally, and the available funding indicators did not show an acute plumbing break.
This remains an important distinction: equity risk-off is confirmed, but systemic stress is not.
Key MES Levels
Support:
7,640.00 — immediate decision level
7,565.50 — next major downside shelf
7,511.25–7,482.50 — deeper structural support
Resistance:
7,670.50–7,682.25 — first repair band and former support
7,724.25 — meaningful repair pivot
7,764.75–7,784.00 — broader bullish repair
Key MNQ Levels
Support:
29,377–29,400 — immediate balance area
29,220.75
29,158.25
29,095.25
28,635.25 — major lower shelf
Resistance:
29,482.25 — first reclaim
29,541.75 — confirmation level
29,646.75–29,657.75 — stronger bullish repair
Thursday’s Primary Question
Can MES reclaim 7,670.50–7,682.25 and MNQ recover 29,482.25–29,541.75 while RSP, RTY, semiconductors and breadth improve and volatility softens?
If so, Wednesday’s breakdown could begin repairing from an extended condition.
If MES rejects the broken 7,670 area and accepts below 7,640—particularly with RSP remaining below 214.71–215.32—the downside path toward 7,565.50 becomes increasingly relevant.
For now, the market is technically damaged and tactically risk-off, but credit and funding conditions do not support a systemic-stress call. Education 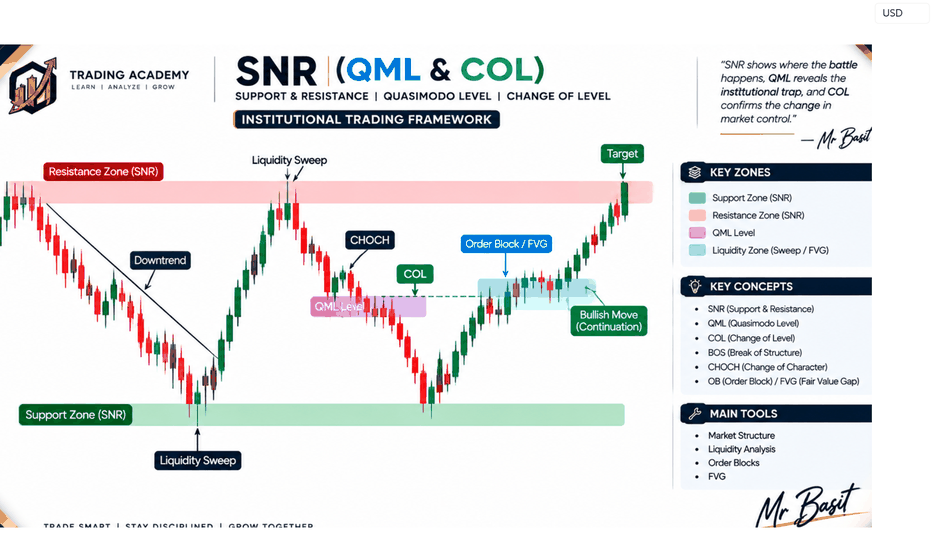
GOLD - The market is under pressure from a bearish trend ICMARKETS:XAUUSD remains in a local bearish trend, while consolidation below the 4,435 liquidity zone is becoming a technical catalyst for further downside
The dollar is stagnating, but at the same time, it is weakening due to interventions by the Bank of Japan. Gold looks weak against this backdrop, especially given the Fed’s medium-term hawkish stance. Geopolitical risks and inflation expectations that could limit further upside remain in place. The key event of the week will be the U.S. inflation data on Friday, which will determine the next direction.
Drivers:
Upside for gold: further dollar weakness, a stronger yen, weak U.S. CPI data.
Downside for gold: dollar strength, hawkish Fed rhetoric, rising geopolitical tensions (supporting oil and the dollar), strong CPI data
Resistance levels: 4,435, 4,461, 4,490
Support levels: 4,365, 4,320, 4,290
Gold remains under pressure from a weak fundamental backdrop and the local bearish trend. A short squeeze around the liquidity zone is triggering further downside. I do not rule out a retest of local resistance before another decline toward 4,365–4,290
Best regards, R. Linda! Short 
 Long
Long
ETH/USD Bearish Rejection — Targets 2,434 & 2,385
ETH/USD is showing a **bearish rejection from the strong resistance zone around 2,530–2,540**. Price has dropped sharply after failing to break higher, suggesting sellers are taking control. The marked **FVG around 2,480–2,520** could act as a pullback/retest zone before further downside.
🎯 **1st Target:** 2,434
🎯 **2nd Target:** 2,385
🔴 **Strong Resistance:** 2,530–2,540
🟢 **Support Zone:** 2,375–2,385
📉 **Bias:** Bearish below 2,490
 Short
Short
Gold is consolidating, waiting for important news.Based on the chart you sent, the current structure of XAU/USD is quite clear: price is being squeezed between the descending trendline above and the 4,382 support zone below.
🔴 Resistance
1. 4,440 – 4,450: Near-term and important resistance
This is the Resistance Zone on the chart.
It is also located close to the descending trendline.
If price reaches this area but gets rejected → the probability of a move back to 4,382 is quite high.
If an M30/H1 candle closes clearly above 4,440–4,450, the short-term bearish structure will weaken.
2. 4,463 – 4,465: Next resistance
This is the marked high/ horizontal resistance level on the chart.
If price breaks 4,440, the nearest target is 4,463.
Breaking above 4,463 and holding above it → could open the way for a stronger bullish move.
🟢 Support
1. 4,378 – 4,385: Most important support at the moment
This is the green support zone on the chart.
Price has reacted several times around this area.
If it holds → a bounce toward 4,440 could occur.
If it breaks strongly → the bearish scenario should be prioritized.
2. 4,325 – 4,335: Next support
This is the lower support zone.
If 4,378 is broken, this is the next area price is likely to target.
Pay particular attention to the price reaction around 4,330.
📊 Two Main Scenarios
Bullish Scenario:
4,378 holds → price bounces → breaks 4,440 → successful retest → moves toward 4,463.
If 4,463 is also broken, the bullish trend will be confirmed more strongly.
Bearish Scenario:
Price continues to be pressured down by the trendline → breaks 4,378 → retests 4,378 from below → continues lower toward 4,330.
TRADING PLAN:
BUY GOLD: 4330–4328
Stop Loss: 4318
Take Profit: 200–500–1000 pips
SELL GOLD: 4462–4464
Stop Loss: 4474
Take Profit: 200–500–1000 pips ETHUSDT - The Hunt for Liquidity Ahead of a Bullish Rally BINANCE:ETHUSDT.P continues to consolidate within the 2,350–2,550 range. Resistance has been confirmed and is acting as an important trigger. A breakout above 2,550 could trigger a rally higher, but...
Bitcoin has been consolidating near resistance for the third consecutive week, suggesting that the bulls may still be interested in pushing prices higher. Ethereum is also consolidating. A scenario involving a long squeeze of support before the next move higher remains possible. Such a move could support the broader altcoin market.
Technically, when it comes to Ethereum, the key focus is on the local 2,444–2,430 liquidity zone. A retest and long squeeze of this support zone could shift the balance of power toward buyers and trigger an impulse toward 2,620–3,000
Resistance levels: 2,550, 2,620
Support levels: 2,443, 2,431, 2,356
A false breakdown of support followed by consolidation above the level could become a technical catalyst for further upside, both within the local 2,430–2,550 range and within the broader bullish trend that has been developing since the beginning of July
Best regards,
R. Linda! Long 
GOLD - The price remained within the range following the NFPICMARKETS:XAUUSD is reacting to Friday’s NFP data with a fairly strong sell-off. However, the market is aggressively buying the dip. What should we expect from the market on Monday?
The dollar remains weak, but toward the end of Friday’s trading session, the market gave back part of the bullish impulse, providing some support for the dollar.
The main focus remains on geopolitical developments and upcoming economic data, including PPI and CPI.
Technically, I expect a correction toward 4,396–4,381 to potentially develop from the session open, followed by a possible move higher toward the 4,490–4,510 area of interest.
However, the fundamental backdrop remains mixed, with no clear directional bias. A close below 4,365 could trigger a sell-off toward 4,280
Resistance levels: 4,435, 4,461, 4,490
Support levels: 4,396, 4,381, 4,365
Within the local correction, gold is testing the 4,440 liquidity zone, where a bounce toward the 4,396–4,381 support zone could develop. If the bulls manage to maintain the bullish impulse, this could lead to a move toward 4,440–4,490 within the local range
Best regards,
R. Linda! Long 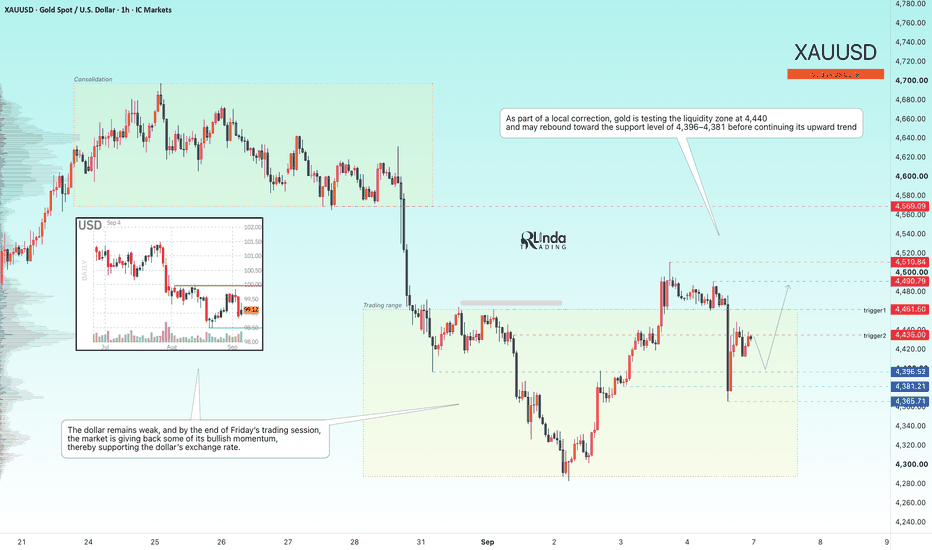
Headline Indices Repair, but Breadth Still Refuses to ConfirmMarket Regime: Mixed / Narrow Leadership / Tactical Caution
Macro Regime: Long-End Yield Pressure / Hostile Tilt
Systemic Stress: Not confirmed
Confidence: High
The shortened trading week begins with MES and MNQ holding repaired structures, but the broader market still has not confirmed the strength displayed by the capitalization-weighted indices.
Because Monday was a market holiday, the latest cash-market breadth and internal readings remain Friday’s information. Tuesday’s opening participation will therefore carry more weight than usual.
Index Structure
MES is trading near 7,719 after rebuilding above the former 7,670–7,683 breakdown zone. That repair invalidates a simple downside-continuation thesis, but price remains immediately below the next acceptance gate at 7,724.25.
Above 7,724.25, the next resistance levels are 7,764.75 and 7,784.00. Acceptance through those areas would strengthen the bullish structure.
Below the market, 7,683.50 and 7,670.50 remain the principal support band. Losing that band would reopen the possibility of rotation toward 7,565.50.
MNQ is showing better relative strength near 29,705, but it is also testing the upper portion of its current distribution.
The immediate breakout level is 29,915. Support is located at 29,660.50, 29,558.50 and 29,486.00. Holding those levels preserves the technology repair; losing 29,486 would materially weaken it.
Breadth and Equal Weight
Breadth remains the clearest weakness:
Approximately 35.4% of S&P 500 constituents are above their 20-day average.
Approximately 46.9% are above their 50-day average.
Approximately 64.0% remain above their 200-day average.
RSP CVD continues to trend lower.
RSP remains below its 220.06 repair threshold.
This is not yet a long-term breadth collapse, but short- and intermediate-term participation has deteriorated significantly.
RSP holding above 215.57–214.85 preserves the broader structure. A loss of that shelf would strengthen the argument that weakness is spreading beneath the headline indices.
Technology and Leadership
Technology remains constructive, but leadership is uneven.
SOX and SMH produced meaningful repairs, while MU showed strong relative momentum. NVDA remains constructive as it approaches major resistance around 234.63–236.42.
However, several semiconductor moves lack complete CVD confirmation. AMD bounced sharply while its CVD remained weak, and AVGO is still operating from a damaged lower-profile area.
AAPL continues to show strong CVD and remains an important source of leadership, although price must defend the 319.97–316.67 shelf. META and MSFT are comparatively constructive, while GOOGL and AMZN remain closer to balance than leadership.
The technology complex is strong enough to support the indices, but not yet broad enough to confirm a durable market-wide expansion.
Rates, Volatility and Credit
Treasury yields remain a significant macro headwind:
2-year: approximately 4.37%
5-year: approximately 4.54%
10-year: approximately 4.78%
30-year: approximately 5.23%
Pressure remains concentrated toward the long end, consistent with term-premium and duration pressure rather than a sudden front-end policy shock.
TLT remains weak near 82.21 and has not reclaimed 82.54.
Volatility is still contained in absolute terms, but its internals are beginning to change. VIX RSI is turning higher, front-month VX CVD is stabilizing and VIX1D strengthened into the holiday weekend.
Those are early warnings—not confirmation of a volatility regime change.
Credit and funding markets remain the primary counterevidence against a systemic-risk conclusion:
HYG/LQD remains near the upper end of its recent range.
SOFR, EFFR and IORB remain orderly.
No meaningful repo or funding-market dislocation is visible.
Fed plumbing has not materially changed.
Tuesday’s Primary Question
Can MES gain acceptance above 7,724.25—and eventually 7,764.75—while RSP, RTY and short-term breadth begin confirming the move?
If yes, the market can transition from narrow repair toward broader bullish participation.
If MES rejects upper balance, loses 7,683.50–7,670.50 and receives confirmation from weaker equal weight, small caps and rising volatility, the current index resilience becomes increasingly fragile.
For now, the market is not broken—but the burden of proof belongs to breadth.