 Short
ShortW-pattern
Short
Price Action Trading: Beyond the Pattern🔥 Price Action Trading: Beyond the Pattern 🔥
Many traders focus on individual candlestick patterns as if they contain predictive power on their own.
In isolation, they do not.
A pattern is only meaningful when viewed within the surrounding market structure. Context determines whether a signal is valid.
📌 THE ILLUSION OF PATTERN PRECISION
Candlestick recognition is often seen as the core of price action trading. Pin bars, engulfing candlesticks, and reversal patterns are studied extensively, yet performance are doomed to be inconsistent, especially when applied mechanically.
The issue is not the pattern itself, but the assumption that the price pattern is everything. A pattern without context is meaningless on a chart.
Real consistency comes from understanding:
Where the pattern forms
What market condition is present
Whether the market structure supports continuation or reversal
A setup is only a trigger and not a complete strategy.
🧭 MARKET BIAS IS THE REAL EDGE
The dominant driver of performance is market bias. All traders must admit the existence of market bias. Without a bias, all movements are random and in that case, there is no reason to trade for profit.
It refers to the underlying directional pressure of the market, defined by structure, momentum, and higher time frame flow.
When bias is correct, even simple setups can perform well. When bias is incorrect, even high-quality patterns fail.
Example observation:
A basic two-bar reversal ( here referring to any bearish candlestick followed immediately by a bullish one, entry order assumed to be a buy stop above the bullish candlestick ) during a pullback performs effectively when aligned with a bullish environment, despite lacking additional filters.
The conclusion is consistent:
Performance is driven more by market bias than by pattern quality.
Key principle:
Correct bias increases probability of success across all setups
Incorrect bias degrades even the strongest price patterns
⚙️ SETUPS AS RISK DEFINITIONS, NOT ENTRY TRIGGERS
Setups are often misunderstood as predictive tools.
In professional application, they serve to define risk by structure .
A setup provides:
A clear invalidation point
A structured entry framework
A predefined risk amount
Without a setup, there is no objective reference for stop placement.
Let's continue with the same chart example shown above. For a bullish two-bar reversal, the lowest point of the pattern defines the level of invalidation. If price breaches that level, our original trading thesis is no longer valid.
Change your perspective and see price patterns as risk control mechanisms, not mere entry signals.
This transforms our trading approach from reckless prediction into controlled risk exposure.
📊 BUILDING MARKET BIAS THROUGH STRUCTURE
Bias is not assumed. It is constructed from multiple layers of information.
A sound framework typically includes:
Market structure — swing highs and lows defining direction
Trend analysis — slope and persistence of movement
Support and resistance — zones of prior reaction
Volume behavior — confirmation of participation and rejection
Higher time frame alignment — dominant directional context
Each component reinforces or challenges the others. The key is when multiple tools align, because that is when bias becomes reliable.
🔍 THE LOGIC OF MEASURED MOVES
Another often neglected aspect is that exit strategy is as important as entry logic.
In trending environments where historical S/R levels are lacking, projected targets become necessary.
Measured moves provide a structured method for forecasting continuation. On a basic level, they are typically derived from a prior impulse leg and projected using a 100% extension framework. This excellent tutorial explains this concept in-depth:
Trade dynamics involve a clear trade-off:
Historical levels offer higher probability but limited extension
Measured moves offer extended targets but require holding through volatility
Neither is superior. Each applies under different conditions.
The key requirement is consistency in execution once selected.
🧠 STRATEGIES ARE PERSONAL SYSTEMS
No strategy is universally optimal. Performance depends on alignment between method and trader behavior.
A system that works mechanically may still fail if it conflicts with a trader's psychological tolerance.
Core considerations include:
Decision speed required by the method
Tolerance for drawdowns
Comfort with win-rate variability
Ability to follow rules under pressure
A strategy is only viable if it can be executed consistently during adverse conditions, not just favorable ones. This is because trading edge exists narrowly at the intersection of system and behavior.
📉 COMMON FAILURE POINT: CONTEXT MISALIGNMENT
Many losses attributed to “bad setups” are actually the result of context mismatch.
For example, a valid pattern traded against higher time frame structure often underperforms regardless of its formation quality.
Key diagnostic questions:
Was the trade aligned with dominant bias?
Was the setup located within supportive structure?
Was volatility regime compatible with the approach?
Most failures occur when setup logic is incompatible with the contextual logic.
📈 A REPEATABLE PRICE ACTION FRAMEWORK
A systematic approach reduces ambiguity:
Define market bias first (using your preferred method)
Identify key structural zones (support and resistance)
Wait for setup formation within aligned context
Confirm invalidation level before entry (i.e. the price pattern)
Define target using structure or measured move logic
Execute without deviation from plan
This process ensures that execution follows a planned approach rather than impulse.
📌 FINAL TAKEAWAY
The key lesson is simple. Candlestick patterns do not generate edge in isolation. Edge emerges from context, structure, and disciplined execution.
Core principles:
Bias determines whether setups have validity
Setups define risk, not prediction
Structure is more important than formation quality
Measured moves provide objective exit logic
Consistency requires alignment between strategy and trader behavior
The shift from pattern recognition to contextual analysis is foundational.
Before focusing on the price pattern, evaluate the environment it appears in.
 Education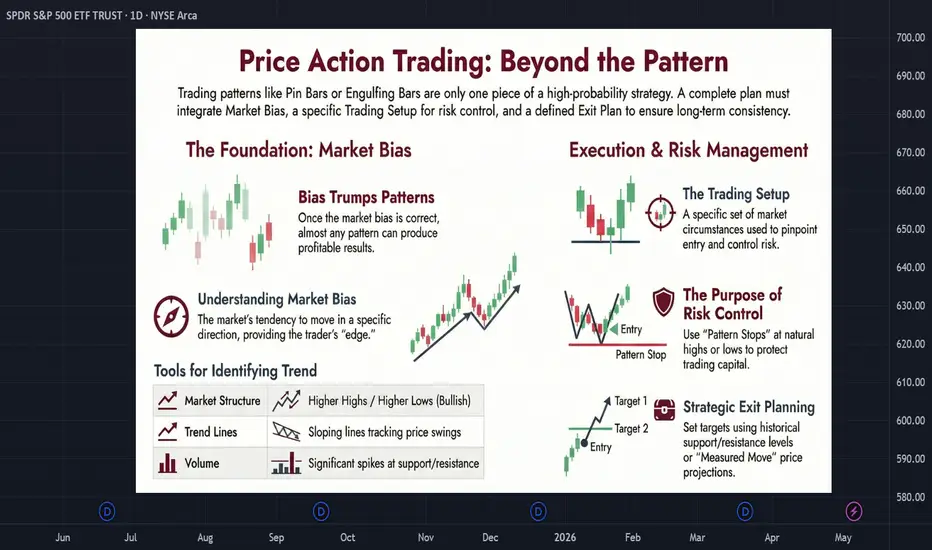
Understanding the Counter-Intuitive Nature of MarketsMarkets appear counter-intuitive because widely held intuition becomes part of the market structure itself.
Technical patterns often show near-zero expectancy across full historical samples, yet still produce meaningful edge inside specific regime windows. The implication is simple: pattern success is not a fixed geometric property. It is conditional on the consensus regime surrounding the pattern.
A pattern can cycle through recognition, crowding, exploitation, inversion, inverse conditioning, and rediscovery. Full-sample statistics average these opposing regimes into noise, while recency-weighted models often overfit the same consensus the market is preparing to punish.
The extractable edge lies not in pattern detection, but in consensus inference.
🔸 Core idea
The pattern is not the edge : The edge comes from understanding how the crowd is positioned around the pattern.
Geometry is conditional : The same structure can work, fail, invert, and later work again.
Consensus changes expectancy : As more participants learn a setup, its expected resolution becomes easier for the market to exploit.
----------------------------------------------------------------------------------------------------------------
🔷 1. THE EMPIRICAL PARADOX
Across broad historical samples, most technical patterns decay toward neutral expectancy. Head and shoulders formations, breakouts, harmonic structures, liquidity sweeps, and other visually defined setups rarely maintain a persistent unconditional edge when measured over enough market history.
This is why many quantitative researchers dismiss technical analysis as a visual artifact of randomness. On the aggregate, that conclusion looks reasonable.
Yet the same structures can produce materially positive expectancy inside specific regime windows:
A breakout can work repeatedly for months.
A liquidity sweep can become a reliable reversal signal.
A triangle can resolve upward repeatedly for months, until upside expansion after compression starts to feel like the natural outcome.
Later, that same triangular compression can become a trap for that expectation.
The geometry stays the same. The market's relationship to it changes.
----------------------------------------------------------------------------------------------------------------
🔷 2. SYMMETRY AND ASYMMETRY
🔸 Symmetry
Symmetry is the outcome the crowd has been conditioned to expect. It is recent memory converted into positioning.
As a concrete example; If triangular compression has recently resolved upward with consistency, symmetry becomes upside expansion. Traders expect the upper boundary to break, breakout entries cluster above resistance, and the expected expansion becomes the baseline scenario.
🔸 Asymmetry
Asymmetry is the outcome that violates this conditioning. It breaks recent memory and forces the crowded side to unwind.
In this case, the asymmetric outcome is not simply a failed breakout. It is a reversal against traders who treated recent directional resolution as a high-probability outcome.
These symmetry / asymmetry labels are not attached to the pattern, but to the current consensus.
If upward triangle breakouts have been failing recently, symmetry shifts and the crowd expects the breakout to be bait. Traders fade the upper boundary, anticipate the reclaim back inside the structure, and position for failed expansion.
The symmetric outcome becomes the failure itself.
The asymmetric outcome becomes the breakout actually following through.
A breakout is not inherently continuation or liquidity bait. A reversal pattern is not inherently predictive or fake. The probability of a specific outcome declines as participants become increasingly conditioned to expect it.
----------------------------------------------------------------------------------------------------------------
🔷 3. THE MECHANICAL CYCLE
When a pattern succeeds repeatedly, recognition builds. Traders code it into systems, share it publicly, and begin positioning around the same expected resolution. The pattern becomes a map of consensus.
Once that consensus becomes crowded, the expected outcome also becomes the most liquid outcome to fade. Stops cluster where everyone knows they should cluster. Entries concentrate where everyone has been trained to enter.
The pattern does not fail because the geometry stopped mattering. It fails because the expected resolution has become intuitive.
After repeated failure, the market becomes conditioned to the failure itself. Traders fade the setup, anticipate the trap, and position for inversion. The failed pattern becomes the new intuitive pattern.
Once that inverse expectation becomes crowded, the original resolution becomes asymmetric again. The pattern can work precisely because recent sampling has trained the crowd not to trust it.
⚙️ The cycle
Recognition : The structure begins to work and traders notice.
Crowding : The expected resolution becomes widely accepted.
Exploitation : The crowded expectation becomes liquid enough to fade.
Inversion : The pattern begins failing in the way traders least want.
Inverse conditioning : The crowd learns to expect the failure.
Rediscovery : The original resolution becomes asymmetric again.
Success returns. Recognition rebuilds. The cycle repeats.
----------------------------------------------------------------------------------------------------------------
🔷 4. THE TWO FAILURE MODES
This cyclicality creates two recurring errors in both human and machine cognition: aggregation and recency overfitting .
🔸 Failure Mode 1: Aggregation
The aggregate model measures expectancy across the full sample. Because symmetry and asymmetry phases offset one another, the result is neutral expectancy.
The statistic is mathematically valid, but structurally incomplete. The signal has been averaged across regimes that should not have been combined.
🔸 Failure Mode 2: Recency Overfitting
The recency-weighted model makes the opposite mistake. When recent samples show consistent resolution in one direction, it assigns greater confidence to that same resolution.
But it has learned the same local regularity the crowd has already learned. It increases confidence precisely when that regularity is becoming most vulnerable to inversion.
The human trader does the same thing psychologically. After enough recent wins, the setup feels obvious. After enough recent failures, it feels objectively wrong. Both feelings are useful information, but not in the way most traders interpret them.
Comfort often marks symmetry.
Discomfort often marks asymmetry.
----------------------------------------------------------------------------------------------------------------
🔷 5. PRACTICAL IMPLICATION
Rather than focusing on “Does this pattern work?” a trader needs to ask “What outcome has the market been conditioned to expect?”
🔸 Symmetry is visible when the trade feels:
Obvious.
Recently rewarded.
Widely agreed upon.
Comfortable to execute.
🔸 Asymmetry appears where the valid outcome feels:
Least obvious.
Least comfortable.
Least recently rewarded.
Least aligned with what seems normal.
This is especially important in sentiment-driven markets such as crypto and forex, where fundamental anchors are weaker and positioning can dominate short-term structure. Equity indices exhibit the same mechanic on lower timeframes, though their long-term upward drift adds a separate structural bias.
The edge belongs to the participant who reads the consensus around the pattern, not the pattern itself.
It is a meta-analysis of pattern recognition.
 Education
Quick Lesson: How to Trade Falling Wedge (Study & Benefit)Falling Wedge is one of the most common and recognisable chart pattern. However, many (and may be even most of) people trade it in a wrong way, which often results in taking losses. Knowing when to enter the market can make the difference between catching a clean breakout and getting trapped in a fake move . The chart above compares two similar wedge setups that look alike at first glance, but are built on completely different conditions.
On the left, we see a textbook example of a healthy bullish breakout through the falling wedge:
After a downtrend, the price begins to form a horizontal accumulation range, marking a bottom with it.
When the first round of accumulation is done, there is a bounce following, marking the first touch of the future resistance.
The second round of accumulation usually forms lower than the first one, allowing bulls to properly accumulate the asset at a favourable price.
When accumulation is done, bulls are processing a breakout of the wedge. What is important there is that the most of volumes are being absorbed on this move which allows the impulse to grow further.
In contrast, the right side shows a very similar pattern — a falling wedge forming after a downtrend, but with crucial differences.
The price touches the potential support, but bounces way too fast, not allowing traders to properly accumulate the asset.
After the pump, the accumulation phase starts forming near the future resistance. The core volumes are forming at the top of the pattern as well.
Big accumulations near the top of the patterns trigger the price to dump in order to hunt stop losses & liquidations which ruins the accumulation.
After the wedge breakout, people who accumulated at the top must sell their assets in BE or even at loss, because the accumulation phases were above the resistance breakout point.
As the result, fresh buyers face the high sell pressure on the breakout, which makes the impulse weak and fade in the end.
To sum up , a REAL FALLING WEDGE has its core volumes near the bottom - sign of a healthy accumulation phase, while a FAKE WEDGE has its core volumes near the top - sign of a manipulation made to trigger stop losses & liquidations.
Education
Thoughts on EURUSDGood evening everybody,
After keep tracking EURUSD and figuring out the next moves on the market, I have noticed a head and shoulders pattern that coincides with the retracement of the previous bullish trend. It is expected and ideal that we wait for bounce to get an entry point around 1.16754. An ideal TP 1.158 and if the market continuous bearish it can go until the completion of the pattern at price 1.149.
Follow up previous ideas!

 Short
Short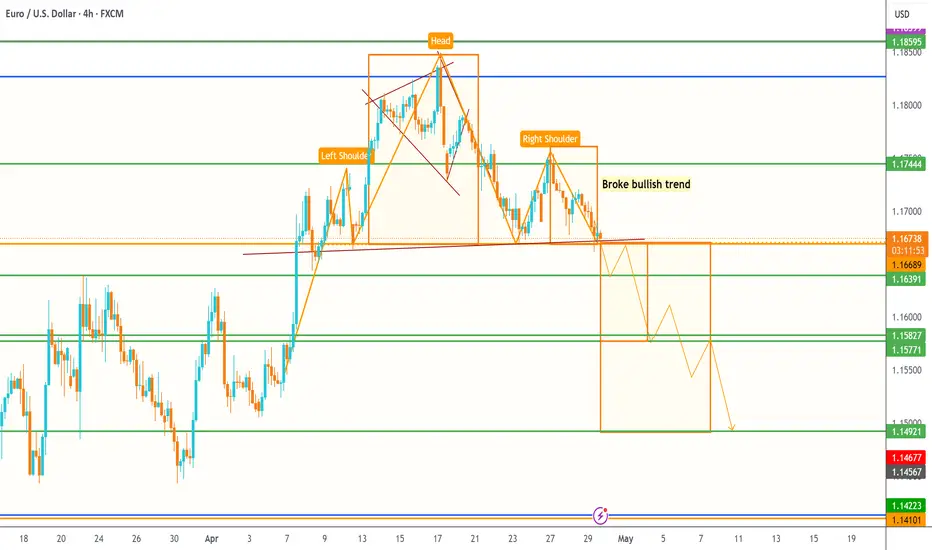
Bitcoin - Is the next move towards 40k?Bitcoin is once again trading within a structured pattern, showing clear reactions to trendlines and key levels. The chart highlights repeating behavior, where price respects rising channels but ultimately fails to sustain higher highs, leading to deeper pullbacks.
Rising Channel
The first rising channel formed after Bitcoin found support around the 80k region. From there, price trended upward in a controlled manner, respecting the channel boundaries before eventually breaking down. That breakdown led to a strong move lower, showing that the structure was more corrective than impulsive.
A second rising channel has now developed after the major drop toward 60k. Price is again moving upward within a similar structure, forming higher lows while gradually grinding higher. However, just like the previous channel, momentum appears limited and price is approaching resistance near the upper boundary. This raises the possibility that this structure could also resolve to the downside.
Price Pattern
Looking at the broader price action, Bitcoin initially found a low around 80k and rallied toward 98k. After failing to sustain that move, it sold off aggressively to around 60k. From that low, BTC has once again pushed higher, reaching the 79k region.
This sequence creates a pattern of lower highs combined with sharp downside moves, suggesting distribution rather than accumulation. With liquidity building and resistance holding, the question becomes whether this is another setup for continuation lower. If the pattern repeats, a move toward significantly lower levels, potentially even the 40k region, cannot be ruled out.
Final Thoughts
Bitcoin is showing a repeating structure of rising channels that ultimately break down. The current move from 60k to 79k looks corrective within a larger bearish context. As long as price struggles to break and hold above resistance, the risk remains tilted to the downside. If this pattern continues to play out, a deeper move lower could be next.
Short
BEAT On. Drop SoonHello Traders!
Previously we caught a beautiful move in Beat and it was successful and now there is another trade but this time its a bearish move. Target is not massive as previous one but it will give us big gains too.
Stoploss 0.6497(-11.2%)
Target 0.4872(+16.5%)
My aim is to achieve highest win rate in tradingview trading community :) and we will definitely do that.
Trade Analysis Based On:
• A1000x Master Reversal Strategy
• A1000x Secret S/R Strategy
• Candlestick Patterns
• A1000x Stop Loss & Target Strategy
We trade using carefully developed strategies and disciplined market analysis, always seeking the best possible accuracy while remembering that ultimate success comes only by the will of Allah.
In some trades, you may notice a relatively larger stop loss or a risk-to-reward ratio that may appear unusual at first glance. However, every trade is taken with proper planning and calculated analysis, not random entries.
Before entering any position, we perform detailed calculations and market evaluation. Based on this analysis, we carefully determine our stop loss and target levels.
I personally apply one of my specialized stop-loss and target strategies, designed to place the stop loss at a logical market level where price is less likely to reach before moving toward the intended target — InshaAllah.
Trading always involves risk, but with discipline, patience, and proper strategy, we aim for consistent and responsible decision-making.
Feel free to share your thoughts, leave a comment, or contact me.
 Short
Short
Bitcoin - MULTI Month outlook, PATTERN SPOT Hello all 😊
It's been a while since I've done a video update, sometimes they just hit different when trying to get a message across.
I'm observing a bearish chart patter, three drivers - what do you think?
Long term support zone is still at around $53K.
BINANCE:BTCUSD
Short
What Makes a Level ImportantCharts are full of lines. Support levels, resistance levels, trendlines, channels. Many traders end up marking so many areas that every movement on the chart appears to happen near a “level.” When everything is important, nothing actually is.
In reality, only a small number of levels consistently influence price behavior.
A level becomes important when it represents concentrated decision-making in the market. These locations attract orders, attention, and participation. When price reaches them, traders are forced to act, and that activity produces meaningful reactions.
One of the strongest types of levels is previous structure.
Prior highs and lows often contain large amounts of liquidity. Traders place stop losses around these areas, breakout traders place entries beyond them, and institutions use the resulting order flow to execute larger positions. Because of this concentration of orders, price frequently reacts when it reaches these locations.
Another important factor is repeated interaction.
A level that price has respected multiple times tends to attract more attention from market participants. Each reaction reinforces the belief that the level matters, which increases the likelihood that traders will place orders around it again in the future.
Liquidity concentration also plays a major role.
Equal highs, equal lows, range boundaries, and obvious swing points often collect stop losses and breakout orders. When price approaches these areas, the market gains access to a large pool of orders, which can trigger sharp movements or sudden reversals.
Timeframe also affects importance.
Levels visible on higher timeframes tend to influence price more strongly than levels that appear only on lower timeframes. A daily high or weekly range boundary often attracts far more participation than a small level visible only on a five-minute chart.
Location relative to the broader structure matters as well.
A level that sits at the edge of a range or near a major liquidity pool carries more significance than one that appears in the middle of ongoing price movement. Markets tend to react where decisions must be made, not where price is simply passing through.
Understanding these characteristics helps traders filter meaningful levels from visual noise.
Instead of drawing many lines across the chart, traders can focus on areas where participation is likely to increase. When price reaches these zones, the behavior of the market becomes more informative.
The goal is not to predict exactly how price will react.
The goal is to recognize locations where reaction becomes likely.
Important levels are not important because they are drawn on the chart.
They are important because traders place orders around them.
When traders begin to identify levels based on liquidity, structure, and participation, the chart becomes much clearer and decision-making becomes significantly easier.

JPN225 Short• Head and Shoulders on H4
A clear head and shoulders structure is forming on the H4 timeframe, which is often a strong sign of exhaustion and a possible reversal after an extended move higher.
• Head and Shoulders Confluence on H1
This same bearish structure is also showing on H1, which adds further confirmation to the idea that the price may be losing strength and preparing for a downside move.
• Overbought Conditions on H1, M30, and M15
Momentum is stretched across the lower timeframes, with H1, M30, and M15 all showing overbought conditions. When several timeframes are extended at the same time, the chance of a pullback or reversal increases.
• Deep Crab Pattern on M30
There is also a Deep Crab harmonic pattern on M30. As a Type 2 pattern, this points to a potential reversal zone and adds another layer of confluence around the current price area.
• Trend Momentum Is Flattening
Although this trade is against the broader trend, the H1 trend has caught up and flattened out, showing that bullish momentum is no longer as strong as before. The H4 trend is also beginning to lose strength, which suggests the market may be shifting from trend continuation into distribution or reversal.
• Failure to Break Higher
Price is struggling to break and hold above this level. Repeated failure to continue higher often shows that buyers are losing control, especially when this happens near a major psychological level.
• Major Resistance Near 60000
This setup is happening just below the 60000 area, which is a major psychological level and effectively the all-time high zone. Markets often react strongly around these levels, and if the price cannot break through decisively, rejection becomes more likely.
• Exhaustion at a Premium Price Area
After such a strong move upward, the price is now trading in a premium area where chasing longs becomes less attractive. In these conditions, reversal setups tend to carry more weight when combined with structure and momentum weakness.
• Volatility-Driven Opportunity
This may initially develop as a short-term trade because of the increased volatility in the market following recent ceasefire-related news. However, if the price starts breaking lower with momentum, this could develop into a much larger reversal instead of only a short-term pullback.
 Short
Short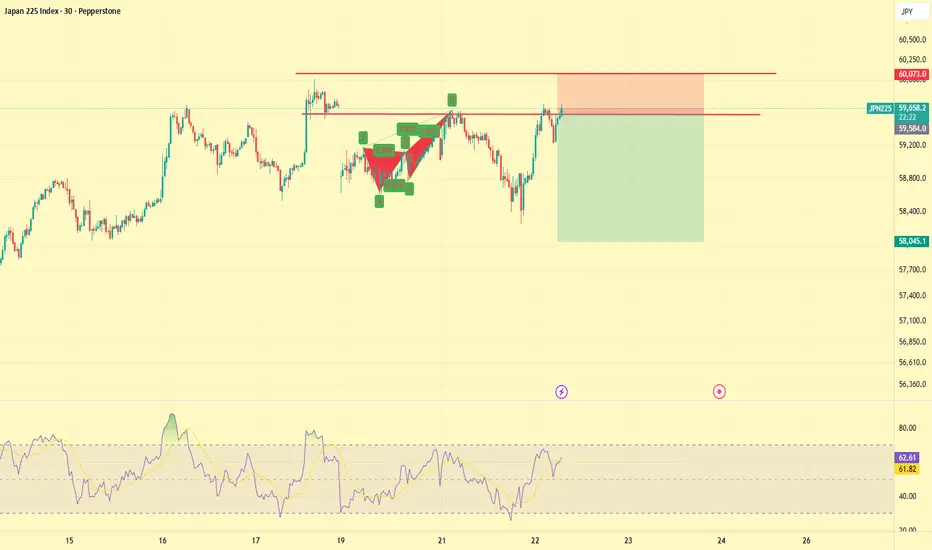
SPX500 ShortI’m watching a high-confluence short setup on SPX500 around the 6890 level, with multiple technical factors lining up for a potential rejection and continuation lower.
Entry Zone: 6890
Take Profit: 6620
• Bearish Butterfly Harmonic on H4 and M15
A bearish Butterfly pattern is completing on both the H4 and M15 timeframes, creating a strong potential reversal zone right around 6890. When the same harmonic structure appears across multiple timeframes, the setup carries more weight.
• Overbought Conditions from M15 to H4
Momentum looks stretched across all key lower and mid timeframes. From M15 up to H4, price is trading in overbought territory, which suggests buyers may be running out of strength after an aggressive push higher.
• Triple Top Formation on M15 to H1
On the lower timeframes, price is printing a triple top structure, which often signals exhaustion at resistance. Repeated failure to break higher is a warning sign that bullish momentum is weakening.
• Bearish RSI Divergence
RSI divergence is also visible from M15 to H1. Price is testing or matching highs, but RSI is making weaker highs, which confirms fading momentum and supports the case for a reversal.
• Previous Day High Acting as Resistance
Price is reacting around the previous day’s high, which is an important technical level and common liquidity zone. This area often acts as resistance, especially when price sweeps above or taps into it and fails to hold.
• Daily Trend Still Bearish
This short setup is not counter-trend. It is in line with the broader daily direction, as the market still appears to be moving within a larger bearish structure following recent macro-driven weakness. Selling rallies into resistance makes more sense while the higher timeframe trend remains down.
• Confluence at a Premium Price Area
Price is reaching a premium zone after an extended move up, which adds more reason to look for shorts rather than chasing longs. When price is overextended into resistance during a bearish higher timeframe trend, reversal setups become much more attractive.
• Possible Liquidity Grab Scenario
This area may also represent a liquidity sweep above local highs before a move lower. The triple top and previous day high together make this a natural place for stops to sit, and that increases the chance of a rejection once liquidity is taken.
 Short
Short
Taking Some Rest because of uncertainityHello trader!
Welcome to another trade... LOL no its not a trade post.
First of all i want to say my strategy is built to generate super accurate trade if there is no human error while analyzing. But because of recent war crisis we are facing loss even though there is no analyzing error in chart analysis. If analyzed accurately my method can generate nearly 100% accurate trade and can catch big moves in stable market conditions. My method is based on swing trades so it can catch nice big moves. All praises to Almighty.
So its time to take rest and try to learn more about the market and current situation. Once war situation is stable we will enter again and you will see finest level of accuracy. I will only post the trades which has super high chances of achieving the target.
REMEBER ME IN YOUR PRAYERS AND PRAY FOR INNOCENT PEOPLE WHO ARE DYING OR FACING TOUGH TIME IN WAR SITUATIONS.
You can contact me anytime :)

Scalping Short Setup | Rising Wedge at 4H ResistanceXAUUSD — Rising Wedge at 4H Resistance | Counter-Trend Scalping Setup
Context (HTF + LTF Alignment)
On the higher timeframe (4H), the market remains structurally bullish with a clear sequence of higher highs and higher lows.
Current price is trading in a premium zone after a strong impulsive leg, approaching a key resistance + liquidity cluster.
This means any short setup is strictly counter-trend and must be treated with reduced risk and strict confirmation.
On the 30M timeframe, price is forming a rising wedge, indicating loss of momentum within the bullish leg.
Structure & Order Flow Read
The move into resistance is a grind rather than a clean impulse, suggesting weakening demand.
Repeated tests near highs without strong continuation indicate possible distribution / liquidity engineering.
High probability of a buy-side liquidity sweep before any meaningful reaction.
Scalping Scenario — Short (Primary, Counter-Trend)
Important Constraint:
This is a counter-trend setup → risk must be reduced, and confirmation is mandatory.
Condition:
Break of the wedge structure to the downside.
Trigger:
30M close below wedge support + lower timeframe MSS.
Confirmation:
Clear displacement + imbalance (FVG) after breakdown.
Entry Model:
Pullback into OTE (0.618–0.786) of the breakdown leg.
Targets:
- First target: 4666 (internal liquidity)
- Second target: 4595 (external liquidity pool)
Invalidation:
Strong acceptance above wedge highs / impulsive breakout of 4H resistance.
Alternative Scenario — Continuation (HTF Trend)
If price breaks the wedge to the upside with strong displacement (not corrective grind),
and holds above the 4H resistance,
then the market confirms continuation in line with HTF bullish structure.
In that case, shorts should be completely avoided.
Key Levels
4H Resistance + Liquidity: Current highs
Trigger Level: Wedge support
Demand Zone: 4709 – 4719
Execution Notes
Do not pre-empt the short — confirmation is critical in counter-trend conditions.
Reduced position sizing is required due to HTF bullish bias.
Best-case scenario: liquidity sweep above highs → failure → breakdown.
If breakout is strong and sustained, bias shifts fully back to bullish continuation.
Conclusion
HTF remains bullish → downside is corrective, not structural.
LTF wedge provides a potential short opportunity only if confirmed.
Focus on reaction, not prediction — this is a tactical scalp, not a swing position.
Short
Chart Patterns ReferenceA comprehensive guide to technical chart formations recognized by professional traders worldwide. Master the art of identifying, measuring, and trading these essential market patterns with precision.
Reversal Patterns:-
Head and Shoulders
Bearish Reversal
A baseline (neckline) with three peaks. The middle peak (head) is the highest, while the outside two (shoulders) are lower and roughly equal height.
Interpretation & Guidance
Signal: Sell when price breaks below the neckline.
Target: Measure the distance from the Head to the Neckline, and project that distance downwards from the breakout point.
Inv. Head and Shoulders
Bullish Reversal
The opposite of the standard version. It forms after a downtrend with a low trough (head) between two higher troughs (shoulders).
Interpretation & Guidance
Signal: Buy when price breaks above the neckline resistance.
Target: Measure depth from Head to Neckline and project upwards from breakout.
Double Top
Bearish Reversal
An "M" shaped pattern occurring at the top of an uptrend. Price hits a resistance level twice but fails to break higher.
Interpretation & Guidance
Signal: Sell when price breaks below the support valley between the two peaks.
Psychology: Buyers attempted twice to push higher and failed; momentum is shifting to sellers.
Double Bottom
Bullish Reversal
A "W" shaped pattern occurring after a downtrend. Price tests a support level twice and holds, indicating a floor.
Interpretation & Guidance
Signal: Buy when price breaks above the resistance peak between the two lows.
Psychology: Sellers failed to push price to a new low; buyers are taking control.
Triple Top
Bearish Reversal
Three distinct peaks at approximately the same price level. It signifies a very strong resistance that buyers cannot overcome.
Interpretation & Guidance
Signal: Strong sell signal on the breakdown of the support line.
Note: Takes longer to form than a Double Top but is considered more reliable due to the third failure.
 Education
GBPUSD - Keeping it Simple!GBPUSD is trading within a flat rising wedge, maintaining a mild bullish structure.
As price approaches the lower bound of the wedge, we will be looking for long setups, expecting buyers to step in from this support.
However, for the bulls to truly take control, a break above the last minor high is needed.
Until then, this remains a corrective bullish structure, not a full breakout.
⚠️ Disclaimer: This is not financial advice. Always do your own research and manage risk properly.
📚 Stick to your trading plan regarding entries, risk, and management.
Good luck! 🍀
All Strategies Are Good; If Managed Properly!
~Richard Nasr
 Long
Long
KRAB - A joke that became a good investmentIm pushing the joke and found something that looks like a rly good investment.
Perfect text book example of accumulation after a downward move (down move not shown on the chart) and a reaccumulation at 0.5 at 11
additional evidences are the pick volume on early 2024 and re accumulation at 11 shown by blue arrows
we are targeting 17 for the next wave up, on 2026 and maybe further up to 21 then
cheers not financial advice
 Long
Long
XAUUSD — 4H Triangle Compression Inside a Broader CorrectionXAUUSD — 4H Triangle Compression Inside a Broader Correction
XAUUSD is compressing inside what currently looks like a post-impulse triangle on the 4H chart, not a confirmed trend reversal.
The key structural point is the context of the pattern. This triangle is forming after a sharp bearish displacement from the 5,400 area into the 5,000 zone. That makes the current structure more consistent with a pause after impulse than with a completed bullish reversal. At this stage, the pattern should be treated as a compression range inside a broader corrective leg .
Current price context: price is trading around 5,094 inside converging trendlines.
Upper boundary: descending resistance from the March swing high.
Lower boundary: rising support from the post-drop rebound base.
Implication: volatility is being compressed, which usually leads to directional expansion once the structure resolves.
Technical Structure
The bearish interpretation is currently cleaner.
If price breaks the lower triangle support and shows acceptance below it , the market can rotate toward the blue target near 4,834 .
That downside objective is structurally relevant because it pushes price below the 0.50 retracement at 4,910.97 and into the deeper discount area near the 0.618 retracement at 4,791.00 .
If downside momentum expands after the breakdown, the next broader demand pocket comes into view around 4,705–4,620 , where the 0.707 / 0.764 / 0.786 retracement cluster sits.
Initial downside target: 4,834.12
Secondary downside level: 4,791.00
Broader demand zone: 4,705.00–4,620.00
Bullish Interpretation
An upside break should not automatically be treated as a bullish trend continuation.
If the triangle breaks upward, that may simply mean the market is changing pattern , not changing trend . In other words, the structure may evolve from a triangle into a different corrective formation before resolving later.
For that reason, any upside breakout must be judged by the quality of displacement , not by the breakout alone.
Weak upside break: likely pattern mutation only.
Strong upside break with displacement and hold: requires reassessment of the bearish continuation thesis.
No acceptance above local highs: upside remains corrective and vulnerable to another sell leg.
Macro / Fundamental Overlay
Fundamentally, gold is trading in a mixed regime rather than a clean trend environment.
Safe-haven demand still supports gold because geopolitical uncertainty remains in the background. However, that support is being offset by USD firmness , higher Treasury yields , and a less aggressive rate-cut backdrop .
That combination explains why gold is compressing instead of trending cleanly.
Supportive for gold: safe-haven demand, geopolitical uncertainty, defensive flows.
Headwind for gold: stronger USD, higher nominal/real yields, tighter easing expectations.
Net effect: choppy conditions, lower directional clarity, higher probability of false starts before expansion.
Order-Flow / Liquidity Context
From a liquidity perspective, the chart still reads like a market that experienced a sharp downside displacement and is now storing energy in a corrective compression .
That keeps the bearish continuation case valid until the pattern proves otherwise .
Current character: compression after displacement.
Preferred read: continuation structure inside a higher-timeframe correction.
What bears want: clean break of support, failed reclaim, then expansion lower.
What bulls need: decisive break upward with real impulse, not just wick-through behavior.
Scenario Framework
1) Bearish Continuation Scenario
This is the primary scenario for now.
Conditions required:
4H break below the lower triangle boundary.
Acceptance below support.
Failure to reclaim the broken structure.
Confirmation:
Expansion candles to the downside.
Weak rebound after the break.
Price holding below the broken support line.
Targets:
4,834.12
4,791.00
4,705.00–4,620.00
Invalidation:
Clean upside break of the triangle with strong displacement.
Sustained acceptance above the local resistance structure.
2) Bullish Alternative Scenario
This is the secondary scenario, but it requires stronger proof.
Conditions required:
Break above the upper triangle boundary.
Strong bullish displacement, not a weak grind.
Acceptance above local structure after breakout.
Confirmation:
4H close above resistance.
Reclaim-and-hold behavior above the triangle high area.
No immediate rejection back into the pattern.
Interpretation:
This would not automatically confirm trend continuation .
It would first suggest the triangle thesis is failing .
The market may be transitioning into a larger higher-timeframe correctional pattern rather than starting immediate bullish expansion.
Invalidation:
Fast rejection back into the triangle.
Failure to hold above the breakout zone.
Tactical Conclusion
My base case is that this structure is still a triangle continuation pattern inside a broader correction , so a downside break currently has the better tactical asymmetry .
The market has not yet shown enough structural evidence to argue that the correction is finished. Until proven otherwise, rallies into the upper boundary should be treated carefully, and price remains vulnerable to a move into the 4,834 objective.
Invalidation Note
If price breaks the pattern to the upside with real displacement and sustains above the local structure , then the bearish triangle thesis weakens materially.
In that case, the more probable interpretation is that higher timeframes have entered a broader correctional phase , and the current move would need to be re-evaluated as part of that larger structure rather than assumed to be immediate bearish continuation.
Short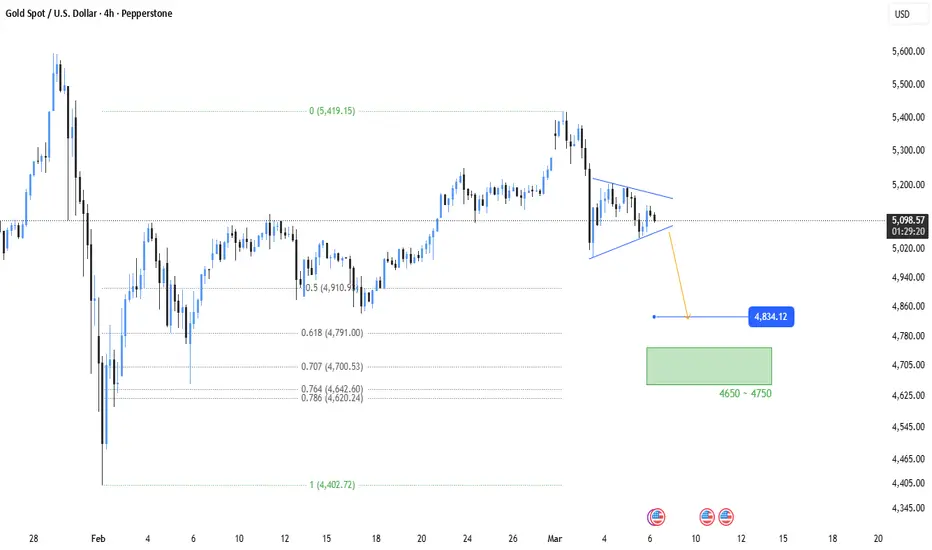
Now its time for Short. Sell ARusdtHello Traders!
Recently we completed 2 big bullish targets in BTC and ADA and the overall market was strong bullish but now its turning bears. Very little bulls remaining before bears take over.
There is a reversal pattern after breakout and market is ready for big short. But again i am saying we don't trade patterns nor i recommend to use patterns. This analysis is based on my self made strategies. I use multiple strategies to crack a perfect trade.
Target 1.67(+13%)
Stoploss 2.043(-6.6%)
My aim is to achieve highest win rate in tradingview trading community :) and we will definitely do that.
Trade Analysis Based On:
• A1000x Master Reversal Strategy
• A1000x Secret S/R Strategy
• Candlestick Patterns
• A1000x Stop Loss & Target Strategy
We trade using carefully developed strategies and disciplined market analysis, always seeking the best possible accuracy while remembering that ultimate success comes only by the will of Allah.
In some trades, you may notice a relatively larger stop loss or a risk-to-reward ratio that may appear unusual at first glance. However, every trade is taken with proper planning and calculated analysis, not random entries.
Before entering any position, we perform detailed calculations and market evaluation. Based on this analysis, we carefully determine our stop loss and target levels.
I personally apply one of my specialized stop-loss and target strategies, designed to place the stop loss at a logical market level where price is less likely to reach before moving toward the intended target — InshaAllah.
Trading always involves risk, but with discipline, patience, and proper strategy, we aim for consistent and responsible decision-making.
Feel free to share your thoughts, leave a comment, or contact me.
 Short
Short
BTC Bull & Bear Market Analysis (HEALTHY!)BTC is extremely healthy & going through a healthy adoption curve as it marches on in a bear market. The fundamentals & technicals show heavy institutional interest. Expect the bottom to come around September - November. Ultimate DCA zone being $70,000-$40,000 (if lucky). 2027 to 2030 will be the next wave up, with highs set for $250,000. Each cycle the price will become more stable & less volatile the long-term pattern suggests. 2030 is where we meet the next bear market & the cycle repeats unless it goes parabolic with institutional & retail adoption. Decentralized systems will take over the new age as more people accept the truth of control & surveillance in the old systems. SATS.

CL1! (Crude Oil) Bullish Rejection at VWAP + FVGHey traders, let's dive deep into this setup on Light Crude Oil Futures (CL1!) on the 1-hour timeframe. We've been seeing some intense price action lately, fueled by ongoing geopolitical headlines like the Iran situation, which has kept oil volatile and trending higher overall. If you're eyeing commodities for quick swings, this could be a high-reward opportunity – but as always, manage your risk!
Historical Price Action Recap
Crude Oil has been in a strong uptrend over the past few sessions, forming a series of higher highs and higher lows as it climbs from the low 80s. Starting from around $88.00 earlier in the week, price pushed aggressively upward, respecting an ascending demand trendline and building momentum through multiple Fair Value Gaps (FVGs). These FVGs represent areas of inefficiency where price moved too quickly, leaving unfilled orders that often act as magnets for future liquidity grabs.
We saw a brief consolidation phase around $92.00-$93.00, where buyers defended the lower FVG zones, preventing a deeper pullback. This led to a breakout above $94.00, but not without testing key confluences like the Volume Weighted Average Price (VWAP), which has been acting as dynamic support/resistance. The recent candles show a sharp dip into the $93.00 area, where price encountered the combined VWAP line and an overlapping FVG – a classic liquidity zone that bulls were expected to raid for stops below recent lows.
Current Setup and Key Technical Elements
Right now, at $95.11, we're witnessing a clear rejection at the VWAP + FVG confluence (labeled on the chart around $93.50-$94.00). This "VWAP + FVG Rejection" is a bullish signal: Price dipped to sweep liquidity in what appeared to be a bullish trap zone – an area where smart money likely accumulated longs by inducing retail sellers to exit prematurely. The rejection is evident in the long lower wicks on the recent red candles, followed by a strong green reversal candle that closed above the zone.
Liquidity Zone Details: The bullish liquidity zone here is defined by the lower FVG at approximately $92.20-$93.00, extended down to $91.00 in case of deeper sweeps. This area aligns with prior session highs/lows and acts as a pool of stop-loss orders from shorts. By rejecting this zone without breaking lower, bulls are reloading, confirming the uptrend's integrity.
Indicators in Play:
VWAP (Blue Line): Curving upward, providing support during the dip. The rejection off this line suggests institutional buying interest.
FVGs (Green/Teal Rectangles): Multiple stacked FVGs from $88.00 up to $94.40, creating a ladder of support. The key rejection happened at the mid-FVG level, invalidating any bearish breakdown attempts.
Candlestick Patterns: Recent action shows a hammer-like reversal at the low, followed by engulfing bullish candles, indicating shifting momentum from sellers to buyers.
Volume Profile: Not explicitly shown, but implied higher volume on the upside bars, supporting the rejection narrative.
Broader Context: On higher timeframes (e.g., 4H), oil is respecting an ascending channel with the lower boundary around $90.00. Geopolitical risks (e.g., Middle East tensions) add fundamental tailwinds, potentially amplifying this technical bounce.
The overall structure resembles a bullish continuation pattern – think of it as a pullback within an uptrend, similar to a flag or measured move, where the rejection acts as the "reload" point for the next leg up.
Trade Bias and Scenario
My primary scenario is bullish as long as price holds above the rejected FVG zone ($93.00). This rejection invalidates short-term bearish pressure and sets the stage for a rebound. We're likely in a liquidity hunt phase where price swept lows to grab stops before resuming higher – a common SMC (Smart Money Concept) play.
If Bullish Confirmation Holds: Expect a steady grind higher, targeting unfilled FVGs above and psychological levels. Geopolitics could accelerate this if news escalates.
Bearish Invalidation: A close below $92.00 would negate the setup, potentially leading to a deeper correction toward $90.00 or the next FVG at $88.00. But current momentum favors bulls.
Entry, Targets, and Risk Management
Entry Point: Look for longs around $95.00-$95.50 on a retest of the recent high or after a minor pullback to the rejected zone (if it holds as support). Wait for confirmation like a higher low or bullish candle close.
Stop Loss: Place below the rejection low at $93.00 (tight) or $92.00 (safer, allowing ~2-3% risk depending on position size). This protects against false breakdowns.
Take Profit Targets:
TP1: $97.00 (next resistance and partial FVG fill, ~2% gain – scale out 50% here).
TP2: $98.50 (psychological round number and upper channel resistance).
TP3: $100.00 (ultimate swing target, aligning with prior highs and a measured move from the rejection – full exit for ~5%+ upside).
Risk-Reward Ratio: Aim for at least 1:3 – with a 2% risk, you're looking at 6%+ potential reward to TP3.
Position Sizing: Keep it conservative; use 1-2% of your account per trade. Monitor volume for confirmation – spikes on upside bars would be ideal.
This setup has strong confluence across technicals and fundamentals, making it one to watch for virality if oil spikes. What do you think – bullish to $100 or rejection incoming?
 Long
Long
BTC: A glimpse into the future The BTC ATH drawdown chart is the only chart you'll ever need. The pattern cannot be clearer, and it is hard to ignore. It is only a matter of months until the bottom is in. Be patient, and you will soon be rewarded with a once in a cycle entry opportunity.
Short
Bullish Engulfing Pattern — The Psychology of ReversalBullish Engulfing Pattern
Hello everyone! Today, we're diving into one of the most powerful reversal patterns in technical analysis — the Bullish Engulfing pattern. It's not just a combination of two candles; it reflects the psychological state of the market and the moment when the balance of power shifts from sellers to buyers.
➡️ What Does It Look Like?
This is a two-candlestick pattern:
First Candle — Bearish (Red/Black): Reflects the temporary dominance of sellers, continuing the downward move.
Second Candle — Bullish (Green/White): Its body completely engulfs the body of the previous red candle.
Important: It's the body that gets engulfed. The shadows (wicks) can extend beyond the body. The larger the second candle's body relative to the first, the stronger the signal.
➡️ Where Does It Appear?
The pattern forms at the end of a downtrend or at a significant support level. It's an early warning that a trend reversal might be coming.
➡️ Market Psychology: What's Happening Inside?
The market is moving down. The first (red) candle closes lower than it opened — sellers seem in control, bears are confident.
Then, on the next candle, something unexpected happens. Price opens even lower than the previous close (perhaps with a gap). It looks like the bears are about to crush the market again. But instead, price sharply reverses upwards and closes above the first candle's open.
This tells us:
The bears exhausted their momentum and couldn't hold prices at the lows.
Bulls aggressively stepped in and completely seized control, buying up all the sellers' positions.
➡️ Key Rules for Identification:
Trend: A clear downtrend must precede the pattern. The signal is weaker in a sideways market.
Colors: First candle is bearish; second is bullish.
Engulfing: The body of the second candle must completely cover the body of the first.
Size: The second candle is noticeably larger than the first. The bigger the contrast, the stronger the signal.
Shadows: They are allowed, but shorter shadows indicate more decisive engulfing.
⚠️ CRITICAL: Context and Confirmation are Key
The Bullish Engulfing pattern is NOT a standalone buy signal. It requires additional confirmation on the chart. This filter protects you from false entries.
The pattern gains maximum strength when it appears:
✅ At a Support Level: This is mandatory. The pattern should form at a significant support level (historical level, demand zone, mirror level).
✅ Near an Order Block (OB): The signal is especially strong if the bullish engulfing candle originates from a zone of institutional interest.
✅ With a Fair Value Gap (FVG): An unfilled FVG near the pattern increases the probability of a reversal.
✅ With a Structure Break: It's even better if the pattern simultaneously breaks a trendline or a significant level.
✅ With Volume: Higher-than-average volume on the second candle confirms buyer aggression.
✅ On Higher Timeframes: The higher the timeframe, the stronger the reversal signal. On daily (D1) or weekly (W1) charts, it's a major alert. On a 5-minute chart, it's just short-term noise.
❌ If a Bullish Engulfing pattern appears in the middle of random, chaotic movement with no connection to key levels — its value is minimal. Do not trade it.
➡️ Trading Plan: How to Use It
Do NOT enter immediately when the second candle closes. Always wait for confirmation.
Entry Point:
On a retest of the level broken by the bullish candle (its close or high level now acting as support).
Or after price firmly closes above a nearby resistance level.
Stop-Loss: Place it below the low of the second candle (or below its lower wick).
Take Profit (Target): The nearest resistance level above, or a target based on your risk/reward ratio (aim for at least 1:2).
➡️ Key Takeaways:
Essence: A bullish reversal signal showing a shift in market balance.
Main Condition: Second candle's body fully engulfs the first's body + mandatory location at a support level.
Golden Rule: Higher timeframe = stronger signal.
Discipline: This pattern requires confirmation. It doesn't work in a vacuum.
Education
Same trend as Jan: Silver heads to 125 fastCAPITALCOM:SILVER
4h chart timeframe
Peirce-Box and Pearson R 0.93 on both
Self explanatory, linked to G/S ratio idea published (2/2)
Free money, not for long
 Long
Long