Zaktualizowano
Omega Heatmap
Overview
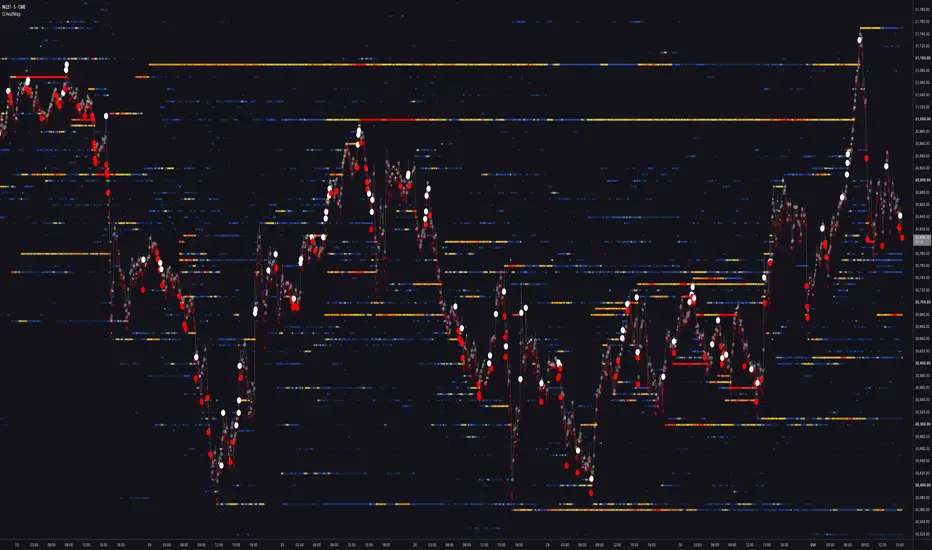
The Omega Heatmap is a comprehensive price architecture engine that aggregates over 90 distinct reference levels from multiple analytical frameworks — HTF structure, volume dynamics, statistical projections, VWAP derivatives, pivot systems, and psychological price theory — into a single, unified heatmap overlay. The result is an always-on visual representation of the full gravitational field acting on price, rendered directly on the chart as colored areas and precision level lines.
Rather than plotting a fixed set of levels, Ω Heatmap is a convergence engine: it measures how many independent analytical methods point to the same price zone, and translates that count into color intensity. The more frameworks agree on a price, the hotter it appears. This turns a multi-source level map into a genuinely readable signal about where the market is likely to react.
he core concept behind Ω Heatmap is the reconstruction of liquidity architecture directly from price and volume data — approximating, without an order book feed, the resting interest zones that would be visible on a platform displaying depth-of-market or limit order distribution. To validate the relevance of each computed zone, an integrated volume scoring system measures the average volume expansion that occurs when price interacts with a displayed level, providing an objective, data-driven confirmation that the identified zones attract real market participation.
Core Methodology
1. Multi-Source Level Aggregation
Ω Heatmap computes price references across six distinct analytical categories simultaneously:
- HTF Structure: previous day/week/month highs, lows, and closes; current day high and low; intraday midpoints; quarterly range levels (25%/75% internal retracements of daily and weekly ranges)
- Psychological Levels: a proprietary adaptive precision system automatically calculates the big figure, mid figure, and sub-figure levels appropriate for the current instrument's price scale, eliminating the need for manual configuration. These levels self-calibrate as price moves across different magnitudes
- Volume Anchors: price levels at which maximum raw volume, maximum buying volume, and maximum selling volume were recorded across multiple lookback windows, identifying where the market committed capital most aggressively
- Statistical Projections: range extensions derived from daily, weekly, and recent swing ranges (×0.5, ×1, ×2 multipliers), providing objective expansion and retracement targets based on the instrument's own volatility signature
- VWAP Framework: both session and weekly VWAP with standard deviation bands, plus the previous session's anchored VWAP levels, offering dynamic institutional reference points
Pivot Systems, traditional daily and weekly pivot points with full support/resistance levels
All levels are snapped to the instrument's minimum tick and rounded to a configurable or auto-calculated precision grid, ensuring that levels from different sources that converge on the same price zone are recognized as the same level, rather than plotted as redundant separate lines.
2. Convergence Scoring & Heatmap Rendering
Once all levels are computed and deduplicated, the engine scores each unique price zone by counting how many independent references converged on it. Zones that exceed the configurable Levels Threshold are considered significant and rendered visually.
The color assigned to each zone is a function of both its convergence count and its directional context relative to current price — above or below determines the color polarity, while the convergence score determines the intensity tier across a 6-level gradient. This produces a genuine heatmap: faint zones represent moderate convergence, fully saturated zones represent exceptional multi-source agreement.
3. Level Lifecycle Management
Ω Heatmap includes a built-in level deactivation system. When price crosses a heatmap level with sufficient force, that level is temporarily suppressed and enters a cooldown period before becoming active again. This prevents stale, already-broken levels from cluttering the map and ensures the heatmap reflects the currently relevant price architecture — not the historical one.
4. Delta Bubbles
Overlaid on the heatmap is a real-time delta visualization layer. The engine reconstructs buying and selling volume from a lower timeframe data feed, computes the net directional delta for each bar, and normalizes it against both its recent distribution and its statistical deviation. The result is rendered as variable-size circles on price — larger and more opaque circles indicate statistically rare imbalances between buyers and sellers, with color reflecting the dominant side. This allows traders to immediately identify bars where order flow was unusually one-sided.
5. Volume Alpha Measurement
The bottom panel displays three live metrics:
- Volume α: the average volume (relative to baseline) specifically at bars where price crosses a heatmap level, expressed as a percentage. A reading above 100% means heatmap levels are crossed with above-average volume, confirming their relevance as reaction zones
- A (Benchmark): the same metric computed relative to round levels, providing a baseline for comparison
- Current: the current bar's volume pace relative to average, giving a real-time sense of whether the bar in progress is completing at elevated or subdued activity
Visual Modes
Ω Heatmap supports four rendering configurations:
Areas — horizontal boxes spanning each significant zone, width rolling forward with each bar, filled with the convergence-intensity color
Levels — the nine nearest significant levels to current price are rendered as persistent horizontal lines with price labels, color-coded by convergence and direction
Areas + Levels — both simultaneously for maximum spatial clarity
None — heatmap rendering disabled while delta bubbles remain active
Fourteen color palettes are available, including Standard, Temperature, Viridis, Neon Cyan/Magenta, Carbon, and Custom (user-defined), allowing full integration with any chart aesthetic.
How to Use This Indicator
Setup
Leave Precision at 0 for automatic level snapping calibrated to the instrument, or enter a manual value for custom grid resolution
Set Levels Threshold to control selectivity — a threshold of 3 means a zone must be referenced by at least 3 independent sources to appear. Increase for cleaner charts on instruments with many natural reference levels; decrease to capture more zones on sparser instruments
Select your preferred Mode and Color scheme
Enable Delta Bubbles and configure the Delta Timeframe to a sub-chart timeframe for intraday order flow context
Reading the Heatmap
The brightest, most saturated zones represent the highest convergence — these are the levels where the largest number of independent frameworks agree. Treat them as the strongest candidate reaction zones
Color polarity (direction-dependent) provides an immediate above/below context: each palette renders upper levels and lower levels in distinct hues
When price approaches a cluster of bright zones, the probability of a reaction — pause, reversal, or acceleration — is elevated relative to open space
Delta Bubbles
Large, fully opaque circles indicate statistically exceptional order flow imbalances — bars where one side dominated significantly beyond normal distribution
Use these as confirmation tools: a large delta bubble occurring at a bright heatmap zone represents a high-conviction interaction between price structure and order flow
Volume Alpha Panel
A Volume α significantly above 100% confirms that the computed levels attract elevated participation — they are genuinely active zones, not historical noise
Monitor the Current value to assess whether the bar in progress is developing with meaningful commitment or fading volume
Originality & Why This Is Closed-Source
The Omega Heatmap is not a level-plotting utility. Its core innovation is the convergence scoring architecture: the methodology by which over 90 heterogeneous price references — spanning institutional structure, volume history, statistical projections, and dynamic anchors — are normalized, deduplicated onto a shared precision grid, and scored into a unified intensity map. The adaptive psychological level engine, the level lifecycle management system, the delta reconstruction and normalization logic, and the volume alpha measurement framework are all proprietary implementations developed exclusively within OmegaTools. The source code is protected to preserve the integrity of the methodology and the commercial value of the tool for licensed users.
Important Disclosures
The heatmap, delta, and volume metrics displayed are derived from historical and real-time market data and do not constitute predictions of future price behavior. All trading involves risk. Ω Heatmap is a decision-support tool and does not constitute financial advice. It is designed to supplement, not replace, a complete trading methodology that includes risk management, position sizing, and trade management rules.
About OmegaTools
OmegaTools is a professional suite of proprietary TradingView indicators built for quantitative traders, systematic traders, and technically advanced discretionary traders. All tools are developed with rigorous statistical methodology and tested across multiple instruments and timeframes before release.
© OmegaTools. All rights reserved. Unauthorized redistribution or resale of access is strictly prohibited.
The Omega Heatmap is a comprehensive price architecture engine that aggregates over 90 distinct reference levels from multiple analytical frameworks — HTF structure, volume dynamics, statistical projections, VWAP derivatives, pivot systems, and psychological price theory — into a single, unified heatmap overlay. The result is an always-on visual representation of the full gravitational field acting on price, rendered directly on the chart as colored areas and precision level lines.
Rather than plotting a fixed set of levels, Ω Heatmap is a convergence engine: it measures how many independent analytical methods point to the same price zone, and translates that count into color intensity. The more frameworks agree on a price, the hotter it appears. This turns a multi-source level map into a genuinely readable signal about where the market is likely to react.
he core concept behind Ω Heatmap is the reconstruction of liquidity architecture directly from price and volume data — approximating, without an order book feed, the resting interest zones that would be visible on a platform displaying depth-of-market or limit order distribution. To validate the relevance of each computed zone, an integrated volume scoring system measures the average volume expansion that occurs when price interacts with a displayed level, providing an objective, data-driven confirmation that the identified zones attract real market participation.
Core Methodology
1. Multi-Source Level Aggregation
Ω Heatmap computes price references across six distinct analytical categories simultaneously:
- HTF Structure: previous day/week/month highs, lows, and closes; current day high and low; intraday midpoints; quarterly range levels (25%/75% internal retracements of daily and weekly ranges)
- Psychological Levels: a proprietary adaptive precision system automatically calculates the big figure, mid figure, and sub-figure levels appropriate for the current instrument's price scale, eliminating the need for manual configuration. These levels self-calibrate as price moves across different magnitudes
- Volume Anchors: price levels at which maximum raw volume, maximum buying volume, and maximum selling volume were recorded across multiple lookback windows, identifying where the market committed capital most aggressively
- Statistical Projections: range extensions derived from daily, weekly, and recent swing ranges (×0.5, ×1, ×2 multipliers), providing objective expansion and retracement targets based on the instrument's own volatility signature
- VWAP Framework: both session and weekly VWAP with standard deviation bands, plus the previous session's anchored VWAP levels, offering dynamic institutional reference points
Pivot Systems, traditional daily and weekly pivot points with full support/resistance levels
All levels are snapped to the instrument's minimum tick and rounded to a configurable or auto-calculated precision grid, ensuring that levels from different sources that converge on the same price zone are recognized as the same level, rather than plotted as redundant separate lines.
2. Convergence Scoring & Heatmap Rendering
Once all levels are computed and deduplicated, the engine scores each unique price zone by counting how many independent references converged on it. Zones that exceed the configurable Levels Threshold are considered significant and rendered visually.
The color assigned to each zone is a function of both its convergence count and its directional context relative to current price — above or below determines the color polarity, while the convergence score determines the intensity tier across a 6-level gradient. This produces a genuine heatmap: faint zones represent moderate convergence, fully saturated zones represent exceptional multi-source agreement.
3. Level Lifecycle Management
Ω Heatmap includes a built-in level deactivation system. When price crosses a heatmap level with sufficient force, that level is temporarily suppressed and enters a cooldown period before becoming active again. This prevents stale, already-broken levels from cluttering the map and ensures the heatmap reflects the currently relevant price architecture — not the historical one.
4. Delta Bubbles
Overlaid on the heatmap is a real-time delta visualization layer. The engine reconstructs buying and selling volume from a lower timeframe data feed, computes the net directional delta for each bar, and normalizes it against both its recent distribution and its statistical deviation. The result is rendered as variable-size circles on price — larger and more opaque circles indicate statistically rare imbalances between buyers and sellers, with color reflecting the dominant side. This allows traders to immediately identify bars where order flow was unusually one-sided.
5. Volume Alpha Measurement
The bottom panel displays three live metrics:
- Volume α: the average volume (relative to baseline) specifically at bars where price crosses a heatmap level, expressed as a percentage. A reading above 100% means heatmap levels are crossed with above-average volume, confirming their relevance as reaction zones
- A (Benchmark): the same metric computed relative to round levels, providing a baseline for comparison
- Current: the current bar's volume pace relative to average, giving a real-time sense of whether the bar in progress is completing at elevated or subdued activity
Visual Modes
Ω Heatmap supports four rendering configurations:
Areas — horizontal boxes spanning each significant zone, width rolling forward with each bar, filled with the convergence-intensity color
Levels — the nine nearest significant levels to current price are rendered as persistent horizontal lines with price labels, color-coded by convergence and direction
Areas + Levels — both simultaneously for maximum spatial clarity
None — heatmap rendering disabled while delta bubbles remain active
Fourteen color palettes are available, including Standard, Temperature, Viridis, Neon Cyan/Magenta, Carbon, and Custom (user-defined), allowing full integration with any chart aesthetic.
How to Use This Indicator
Setup
Leave Precision at 0 for automatic level snapping calibrated to the instrument, or enter a manual value for custom grid resolution
Set Levels Threshold to control selectivity — a threshold of 3 means a zone must be referenced by at least 3 independent sources to appear. Increase for cleaner charts on instruments with many natural reference levels; decrease to capture more zones on sparser instruments
Select your preferred Mode and Color scheme
Enable Delta Bubbles and configure the Delta Timeframe to a sub-chart timeframe for intraday order flow context
Reading the Heatmap
The brightest, most saturated zones represent the highest convergence — these are the levels where the largest number of independent frameworks agree. Treat them as the strongest candidate reaction zones
Color polarity (direction-dependent) provides an immediate above/below context: each palette renders upper levels and lower levels in distinct hues
When price approaches a cluster of bright zones, the probability of a reaction — pause, reversal, or acceleration — is elevated relative to open space
Delta Bubbles
Large, fully opaque circles indicate statistically exceptional order flow imbalances — bars where one side dominated significantly beyond normal distribution
Use these as confirmation tools: a large delta bubble occurring at a bright heatmap zone represents a high-conviction interaction between price structure and order flow
Volume Alpha Panel
A Volume α significantly above 100% confirms that the computed levels attract elevated participation — they are genuinely active zones, not historical noise
Monitor the Current value to assess whether the bar in progress is developing with meaningful commitment or fading volume
Originality & Why This Is Closed-Source
The Omega Heatmap is not a level-plotting utility. Its core innovation is the convergence scoring architecture: the methodology by which over 90 heterogeneous price references — spanning institutional structure, volume history, statistical projections, and dynamic anchors — are normalized, deduplicated onto a shared precision grid, and scored into a unified intensity map. The adaptive psychological level engine, the level lifecycle management system, the delta reconstruction and normalization logic, and the volume alpha measurement framework are all proprietary implementations developed exclusively within OmegaTools. The source code is protected to preserve the integrity of the methodology and the commercial value of the tool for licensed users.
Important Disclosures
The heatmap, delta, and volume metrics displayed are derived from historical and real-time market data and do not constitute predictions of future price behavior. All trading involves risk. Ω Heatmap is a decision-support tool and does not constitute financial advice. It is designed to supplement, not replace, a complete trading methodology that includes risk management, position sizing, and trade management rules.
About OmegaTools
OmegaTools is a professional suite of proprietary TradingView indicators built for quantitative traders, systematic traders, and technically advanced discretionary traders. All tools are developed with rigorous statistical methodology and tested across multiple instruments and timeframes before release.
© OmegaTools. All rights reserved. Unauthorized redistribution or resale of access is strictly prohibited.
Informacje o Wersji
V2Informacje o Wersji
Rework: a lot of new calculations added.Note that the indicator visual and aesthetics is completely customizable.
Dostępne w Płatnej Przestrzeni
Ten wskaźnik jest dostępny wyłącznie dla subskrybentów Quant Suite. Dołącz, aby uzyskać dostęp do tego oraz innych skryptów autorstwa OmegaTools.

Wyłączenie odpowiedzialności
Informacje i publikacje nie stanowią i nie powinny być traktowane jako porady finansowe, inwestycyjne, tradingowe ani jakiekolwiek inne rekomendacje dostarczane lub zatwierdzone przez TradingView. Więcej informacji znajduje się w Warunkach użytkowania.
Dostępne w Płatnej Przestrzeni
Ten wskaźnik jest dostępny wyłącznie dla subskrybentów Quant Suite. Dołącz, aby uzyskać dostęp do tego oraz innych skryptów autorstwa OmegaTools.
Wyłączenie odpowiedzialności
Informacje i publikacje nie stanowią i nie powinny być traktowane jako porady finansowe, inwestycyjne, tradingowe ani jakiekolwiek inne rekomendacje dostarczane lub zatwierdzone przez TradingView. Więcej informacji znajduje się w Warunkach użytkowania.