Omega Indicator The Omega Trend and Signal indicator is a toolkit designed to help both experienced and new traders with their trading decisions.
This indicator is a part of the omega toolkit, and his creation method is based on the concept that every trading strategy should have a way to determine the trend, or the bias, that answers the question “long or short?”; the location, which identifies the best price level to enter into a position and to exit, both in profit and in loss, and that will decide the final risk-to-reward ratio of the trade you take; the signal, which is useful to determine the best moment to enter into a position and that if paired with the trend point, his purpose is to identify when the large trend picture is in confluence with the small term; and last but not least the filter point, the filter is used to have another way to have an additional confluence with the trade you want to take, and it’s important to reduce the number of false signals and to increase the win rate.
This tool aims to help traders with the identification of the trend and the signal points, based on a large number of different formula that works combined to display the final output. It’s important to note that indicator and technical analysis is only one of the several different ways to analyze an asset.
One of the main things to keep in mind when working with the financial markets is that not every asset, every historical phase, and every market condition is the same, this is why this tool can be highly personalized and adjustable and provide different overlay tools in order to allow traders to choose the best settings considering this variable and your backtests.
This tool, thanks to the previously cited characteristics, can work on any market and any horizontal time frame, and it has different features:
- Both Trends following and Mean Reversal usage: with different trend detection and signal formulas (not to be followed blindly like any other indicator or trading method).
- Minimalistic usage: with easy-to-enable functions both functionally and aesthetically, to keep your charts clean and to give you the power to choose only what you want to use this indicator for.
- Candle coloring: the easiest way to identify the trend current situation based on the technical formula, with the color you have chosen, and with 5 different variations: strong sell, sell (same color of strong sell but less opacity), neutral, buy, strong buy (same color of buy with more opacity).
- Automatic signal coloring, that will change the way the signals are visualized based on the mid-term trend condition, giving you both entry and exit suggested signals.
- Trend signals: an option that will display the signal based on the same algorithm that works for the candle coloring, but visualizing only the most significant trend changes
- Signal filters, that works differently for trend following and for mean reversal settings, and are divided into three different categories: additional filters remove the repetitive signals in the trend following usage and the low volume signals in the mean reversal usage; location filter remove the signal that is over/below the current trend fair value, giving you only premium or discount signal based on the direction of the trade; and the confluence filter, that for trend following usage filter out signal not in confluence with the Trend cloud overlay indicator and for mean reversal keeps only the signal that is at least in the first band of the Extreme zones overlay indicator.
- Signal sensitivity optimization with the “Fast length” parameter, with base value “1” you can choose the multiplier for that parameter.
- Trend detection optimization with the “Slow length” parameter, with base value “1” you can choose the multiplier for that parameter.
- Overlay indicator optimization with the “Trend length” parameter, with base value “1” you can choose the multiplier for that parameter.
- 4 Overlay indicator to keep the analysis simple and to assist traders to see the trend clearer and identifying the best zones and conditions to enter a trade.
- The option to visualize as numbers that go from 0 to 10 the current trend strength based on the settings to want to use and calculated with the historical best number that has been displayed (it’s shown under the last candles, only if you have selected the trend following or the mean reversal settings).
- Automatic alerts for Buy and Sell signals based on the settings and the filter that you have chosen.
- The option to show only some parts of the indicator, such as the signals or the candle coloring.
- Heikin Ashi: a modified and more simple version of the classic Heikin Ashi candle that is not realistic on the market when used improperly. This option enables the overlay of the candle with the same high, low, and close of the original candle, but the open is the average of the previous open and the previous close.
The signals work this way: if the script has detected a buy signal if the current trend strength is in confluence with the signal, you’ll see a colored dot under the candle (or over if it’s sell), but if the signal is not in confluence, you’ll see a gray (or the color you have chosen for neutral color settings) mark in the same location, so under the candle, if it’s a buy signal not supported by the trend and over the candle if it’s a sell signals not in confluence with the trend parameters, and in this cases the signals aim to suggest to close your open opposite position. This works both for Trend following and for Mean reversal usage.
In this image, there are enable the Adaptive Zone and the Extreme Zones overlay indicators, with the Mean Reversal candle coloring and signal usage.
As you can see, the Extreme Zones are designed to give with a complex script the zones in which the price is likely to reverse, of course depending on the market condition and asset.
The Adaptive Zone is a modified version of the popular super trend indicator, and is designed to work in a different way: instead of giving a buy and sell signal at the switch of the direction, this tool gives its best when used as an area of support and resistance to enter a trade with a bigger risk to reward ratio.
In these other photos, you can see the Trend Midline and the Trend Cloud overlay indicators, with the Trend Following candle coloring and signal usage.
The Trend Midline is a powerful tool that includes different calculations inside and can work like a moving average to identify the level of support and resistance, take profit and stop loss. In addition to that, the Trend Midline overlay indicator is colored based on a large number of different indicators that display the final output as colors, this way, whenever the indicator is colored as the positive color (blue by default) you’ll have another confirmation that the trend is bullish, and vice versa.
The Trend Cloud is a modified version of the popular Ichimoku Kumo, created to help traders identify the trend direction the best. Another great way to use this tool is to mark a horizontal line at the price level in which the two lines of the indicator have switched in position to identify potential future levels of support and resistance.
Risk Disclaimer:
All content and scripts provided are purely for informational & educational purposes only and do not constitute financial advice or a solicitation to buy or sell any securities of any type. Past performance does not guarantee future results. Trading can lead to a loss of the invested capital in the financial markets. I will not accept liability for any loss or damage, including without limitation any loss of profit, which may arise directly or indirectly from the use of or reliance on such information. All investments involve risk, and the past performance of a security, industry, sector, market, financial product, trading strategy, backtest, or individual's trading does not guarantee future results or returns. Investors are fully responsible for any investment decisions they make. Such decisions should be based solely on an evaluation of their financial circumstances, investment objectives, risk tolerance, and liquidity needs. Implied Volatility Walls The Implied Volatility Walls (IVW) indicator is a powerful and advanced trading tool designed to help traders identify key market zones where price may encounter significant resistance or support based on volatility. Using implied volatility, historical volatility, and machine learning models, IVW provides traders with a comprehensive understanding of market dynamics. This indicator is especially useful for those who wish to forecast volatility-driven price movements and adjust their trading strategies accordingly.
How the Implied Volatility Walls (IVW) Works:
The Implied Volatility Walls (IVW) indicator uses a combination of historical price data and advanced machine learning algorithms to calculate key volatility levels and forecast future market conditions. It tracks cumulative volatility, identifies support and resistance zones, and detects liquidation bubbles to highlight critical price areas.
The main concept behind this tool is that price tends to move most of the time by the same amount, making it possible to average the past maximum excursion in order to obtain a validated area where traders can be able to see clearly that the price is moving more than normal.
This indicator primarily focuses on:
1. Volatility Zones: Potential support and resistance levels based on implied and historical volatility.
2. Machine Learning Volatility Forecast: A machine learning model that predicts high, medium, or low volatility for future market conditions.
3. Liquidation Detection: Highlights key areas of potential forced liquidations, where market participants may be forced out of their positions, often leading to significant price movements.
4. Backtesting and Win Rate: The indicator continuously monitors how effective its volatility-based predictions are, offering insights into the performance of its predictions.
Key Features:
1. Volatility Tracking:
- The IVW indicator calculates cumulative volatility by analyzing the range between the high and low prices over time. It also tracks volatility percentiles and separates the market conditions into high, medium, or low volatility zones, enabling traders to gauge how volatile the market is.
2. Volatility Walls (Upper and Lower Zones):
- Upper Volatility Wall (Red Zones): Represent resistance levels where the price might encounter difficulty moving higher due to excess in volatility. This zone is calculated based on the chosen percentile in the settings.
- Lower Volatility Wall (Blue Zones): Represent support levels where price may find buying support.
- These walls help traders visualize potential zones where reversals or breakouts could occur based on volatility conditions.
3. Machine Learning Forecast:
- One of the standout features of the IVW indicator is its machine learning algorithm that estimates future volatility levels. It categorizes volatility into high, medium, and low based on recent data and provides forecasts on what the next market condition is likely to be.
- This forecast helps traders anticipate market conditions and adapt their strategies accordingly. It is displayed on the chart as "Exp. Vol", providing insight into the future expected volatility.
4. VIX Adjustments:
- The indicator can be adjusted using the well-known **VIX (Volatility Index)** to further refine its volatility predictions. This enables traders to incorporate market sentiment into their analysis, improving the accuracy of the predictions for different market conditions.
5. Liquidation Bubbles:
- The Liquidation Bubbles feature highlights areas where large forced selling or buying events may occur, which are usually accompanied by spikes in volatility and volume. These bubbles appear when price deviates significantly from moving averages with substantial volume increases, alerting traders to potential volatile moves.
- Red dots indicate likely forced liquidations on the upside, and blue dots indicate forced liquidations on the downside. These bubbles can help traders spot moments of market stress and potential price swings due to liquidations.
6. Dynamic Volatility Zones:
- IVW dynamically adjusts support and resistance levels as market conditions evolve. This allows traders to always have up-to-date and relevant information based on the latest volatility patterns.
7. Cumulative Volatility Histogram:
- At the bottom of the chart, the purple histogram represents cumulative volatility over time, giving traders a visual cue of whether volatility is building up or subsiding. This can provide early signals of market transitions from low to high volatility, aiding traders in timing their entries and exits more accurately.
8. Backtesting and Win Rate:
- The IVW indicator includes a backtesting function that monitors the success of its volatility predictions over a selected period. It shows a Win Rate (WR) percentage (with 33% meaning that the machine learning algorithm does not bring any edge), representing how often the indicator's predictions were correct. This metric is crucial for assessing the reliability of the model’s forecasts.
9. Opening Range:
- At the beginning of a new session, the indicator will plot two lines indicating the high and the low of the first candle of the new time frame chosen.
Chart Breakdown:
Below is a description of what users see when using the Implied Volatility Walls (IVW) indicator on the chart:
Volatility Walls:
- Red shaded zones at the top represent upper volatility walls (resistance zones), while blue shaded zones at the bottom represent lower volatility walls (support zones). These areas show where price is likely to react due to high or low volatility conditions.
Liquidation Bubbles:
- Red and blue dots plotted above and below the price represent **liquidation bubbles**, indicating moments of market stress where volatility and volume spikes may force market participants to exit positions.
Cumulative Volatility Histogram:
- The purple histogram at the bottom of the chart reflects the buildup of cumulative volatility over time. Higher bars suggest increased volatility, signaling the potential for large price movements, while smaller bars represent calmer market conditions.
Real-Time Support and Resistance Levels:
- Solid and dashed lines represent current and historical support and resistance levels, helping traders identify price zones that have historically acted as volatility-driven turning points.
Gradient Bar Colors:
- The price bars change color based on their proximity to the volatility walls, with different colors representing how close the price is to these key levels. This color gradient provides a quick visual cue of potential market turning points.
Data Tables Explained:
Table 1: **Volatility Information Table (Top Right Corner):
- EV: Expected Volatility (based on the VIX FIX calculation from Larry Williams).
- +V and -V: Represents the adjusted volatility for upward (+V) and downward (-V) movements.
- Exp. Vol: Shows the expected volatility condition for the next period (High, Medium, or Low) based on the machine learning algorithm.
- WR: The Win Rate based on the backtesting of previous volatility predictions (three outcomes, so base Win rate is 33%, and not 50%).
Table 2: Expected Cumulative Range (Top Right Corner of the separated pane):
- Exp. CR: Expected Cumulative Range based on a machine learning algorithm that calculate the most likely outcome (cumulative range) based on the past days and metrics.
How to Use the Indicator:
1. Identify Key Support and Resistance Levels:
- Use the upper (red) and lower (blue) volatility walls to identify zones where the price is likely to face resistance or support due to volatility dynamics.
2. Forecast Future Volatility:
- Pay attention to the Expected Vol field in the table to understand whether the machine learning model predicts high, medium, or low volatility for the next trading session.
3. Monitor Liquidation Bubbles:
- Watch for red and blue bubbles as they can signal significant market events where volatility and volume spikes may lead to sudden price reversals or continuations.
4. Use the Histogram to Gauge Market Conditions:
- The cumulative volatility histogram shows whether the market is entering a high or low volatility phase, helping you adjust your risk accordingly and making you able to identify the potential of the rest of the chosen session.
5. Backtesting Confidence:
- The Win Rate (WR) provides insight into how reliable the indicator’s predictions have been over the backtested period, giving you additional confidence in its future forecasts, remember that considering the 3 scenarios possible (high volatility, medium and low volatility), the standard win rate is 33%, and not 50%!.
Final Notes:
The Implied Volatility Walls (IVW) indicator is a powerful tool for volatility-based analysis, providing traders with real-time data on potential support and resistance levels, liquidation bubbles, and future market conditions. By leveraging a machine learning model for volatility forecasting, this tool helps traders stay ahead of the market’s volatility patterns and make informed decisions.
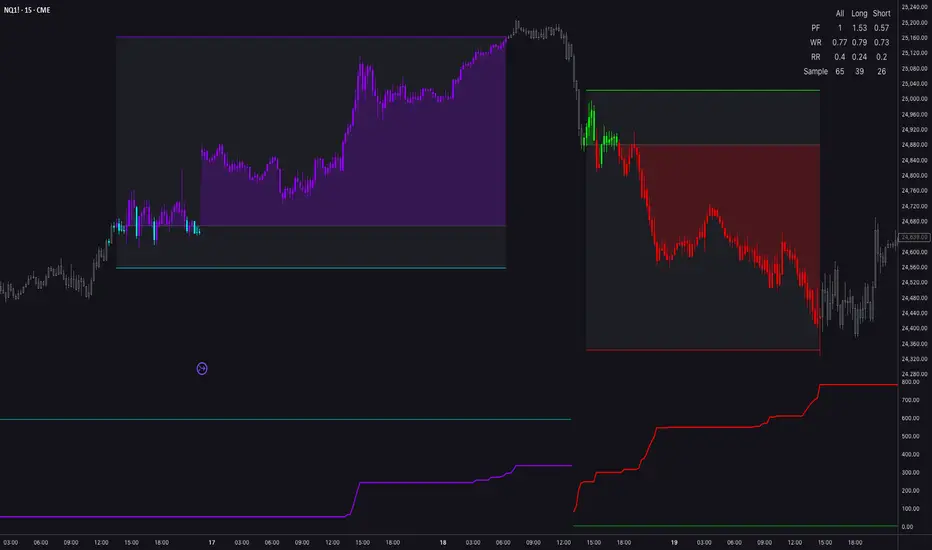
Disclaimer: This tool is for educational purposes only and should not be solely relied upon for trading decisions. Always perform your own research and risk management when trading. Omega Strategy Excursion Omega Strategy Excursion Tester is a research and validation tool designed to help traders test, structure, and refine discretionary or systematic trade ideas directly on the chart. It is not a black-box strategy, and it is not intended to provide ready-made investment decisions. Its purpose is to assist the trader in transforming a market hypothesis into a measurable execution framework by combining signal logic, directional filtering, contextual location analysis, trade projection levels, and maximum excursion statistics.
At its core, this tool is built to answer one of the most important questions in strategy development: once a valid entry idea is defined, how far do trades usually move against the position before working, and how far do they typically extend in favor of the trade before exhausting? In other words, it is specifically designed to study MAE and MFE behavior in a practical chart-based environment. This allows traders to move away from arbitrary stop-loss and take-profit placement and instead anchor risk and reward levels to the empirical behavior of their own setup.
The script generates long and short trade hypotheses from a modular structure made of three separate analytical layers. The first layer is the trigger, which defines the event that initiates a possible opportunity. The second layer is the filter, which acts as directional confirmation or broader bias selection. The third layer is the location component, which identifies whether price is currently in a statistically or technically favorable area for the chosen direction. These three layers can be combined in different ways, allowing the user to test whether a setup performs better when based only on a trigger, when aligned with broader directional context, or when restricted to specific overextended or compressed price locations.
The trigger engine offers several distinct entry archetypes. Z-Score mode detects statistically stretched conditions relative to a moving average and standard deviation framework. Engulfing mode looks for directional engulfing patterns with a volume condition. Breakout mode detects range expansion beyond recent highs or lows while controlling for momentum saturation with RSI. Manipulation mode searches for stop-run or sweep-style behavior, where price briefly exceeds recent extremes and then closes back with directional intent. These trigger styles are intentionally different from one another, so the tool can be used across mean reversion, continuation, breakout, and manipulation-based trading ideas.
The filter layer provides directional bias. The RVWAP option uses a fast-versus-slow rolling VWAP relationship to maintain a directional state, while the MS option uses a market structure style midline progression to define bullish or bearish conditions. This is useful when the trader wants entries to be taken only in the direction of a broader trend or structural bias. Because the filter can be requested from a separate timeframe, the script can also be used in multi-timeframe workflows, such as lower-timeframe execution aligned with a higher-timeframe directional regime.
The location layer adds contextual selectivity. This component is meant to restrict signals to areas where the underlying setup statistically or technically makes more sense. The StDev option evaluates whether the price is outside Bollinger-based deviation bands, the %R option checks whether the price is in an extreme portion of its recent range, and the RSI option evaluates momentum exhaustion zones. By separating direction from location, the script lets the user study a very important aspect of strategy research: not every signal is equal, and the same trigger may behave very differently depending on where it occurs.
Once the chosen signal framework produces a valid event, the script records a reference entry and begins monitoring the trade behavior. At that point, it continuously measures both adverse excursion and favorable excursion. For long trades, MAE is tracked as the distance between the entry and the lowest price reached during the life of the trade, while MFE is tracked as the distance between the entry and the highest price reached. For short trades, the logic is mirrored accordingly. This creates a running profile of how each trade evolves after the signal occurs.
These observations are then stored in historical distributions. Rather than using fixed stop-loss and take-profit distances, the tool derives projected levels from the percentile structure of those distributions. This is one of its most valuable features. The user can select the MAE percentile used for stop-loss generation and the MFE percentile used for target generation. This makes the output adaptable to different philosophies. A more conservative trader may choose lower MFE expectations and tighter MAE thresholds, while a more patient trader may prefer broader adverse tolerance and larger projected reward.
The Double Levels mode extends this concept further. Instead of showing only one stop and one target, the script splits the historical distribution into lower and higher excursion groups around their average and generates two projected levels for each side. In practice, this creates a more nuanced execution map. The first level can be interpreted as a more conservative or more frequently reached projection, while the second level can be seen as a more demanding or wider statistical extension. This feature is particularly useful when testing partial profit-taking logic, staggered exits, tiered stop structures, or different execution styles under the same signal framework.
The resulting chart overlay provides a visual trade framework around every validated signal. Entry, stop, and target levels are displayed directly on the chart, with optional line rendering and optional filled zones. The visual engine is designed not only for aesthetics but for interpretation. It helps the user see whether a current or historical trade was progressing inside a statistically normal range, approaching adverse extremes, or moving toward its favorable extension. Candle coloring can also reflect the evolving profit and loss condition of the active signal, allowing the trader to visually read the current state of the setup in relation to the projected levels.
An additional important setting is the Fixed mode. When enabled, the script avoids repeatedly refreshing the active signal state in the same direction until conditions reset. This is useful when the trader wants a stable level of generation around a discrete event instead of continuous recalculation. The Close at trend change option adds another layer of realism for research purposes by allowing the script to terminate the active study when the directional state reverses. This helps simulate the behavior of traders who would not hold a position through a complete directional inversion and want the historical distributions to reflect earlier logical exits rather than only hard stop or hard target completion.
The lower pane is where the statistical study becomes especially informative. The tool plots the live MAE and MFE paths for long and short trades as they develop, as well as average excursion references. This allows the user to observe whether a current setup is behaving within a normal historical range or whether it is already deviating from the typical pattern of previous trades. In practical use, this can help answer questions such as whether the current trade is still statistically healthy, whether the stop is too tight relative to historical noise, or whether the reward expectation is unrealistic for that specific type of entry.
A built-in summary table provides compact performance diagnostics for all trades, long-only trades, and short-only trades. These include profit factor, win rate, reward-to-risk ratio, and sample size. These metrics are not meant to replace a dedicated strategy backtest engine, but they are highly useful for quick comparative research. They allow the user to compare variations of the same idea, such as one trigger versus another, one filter timeframe versus another, or one location condition versus another, without needing to build a full automated strategy every time. This makes the script especially effective during the concept validation phase of strategy development.
In real use, the best way to approach Omega Signals Target Generator is not to ask whether it “works” in isolation, but whether it helps you understand the structure of your own trading logic. A strong workflow would usually be the following. First, define the type of behavior you want to study: mean reversion, breakout, manipulation, momentum continuation, or another repeatable pattern. Second, select the trigger that most closely represents that behavior. Third, apply a directional filter if your idea performs better when aligned with a higher-timeframe or structural bias. Fourth, add a location condition if you want signals only when price is stretched, compressed, overbought, oversold, or statistically displaced. Fifth, let the script build historical MAE and MFE distributions. Finally, study the projected levels and summary metrics to determine whether your stop and target logic is realistic, whether long and short behavior are symmetric, and whether the setup improves or degrades under different contextual conditions.
This tool is particularly valuable for traders who already have a conceptual edge but need help quantifying it. It can be used by discretionary traders who want to validate chart-reading ideas, by system developers who want a faster prototyping layer before writing a full strategy, and by performance-oriented traders who want to replace intuition-based exits with evidence-based trade management. It is also useful for comparing the quality of market regimes, timeframes, and directional states. Because the tool studies excursion behavior directly, it is well suited for designing stop-loss models, target models, scaling logic, partial exits, and asymmetric reward frameworks.
It is important to understand what this script is and what it is not. It is an analytical engine for structured signal research. It does not claim to produce optimal entries in all markets, and it does not eliminate the need for trader judgment, market understanding, or external validation. The outputs are derived from historical chart behavior under the selected configuration. As with any historical model, results are sensitive to sample quality, market regime, timeframe selection, instrument characteristics, liquidity conditions, and parameter choice. A strong-looking profile on one instrument or one period does not guarantee equivalent behavior elsewhere.
Users should also be aware that any MAE and MFE study is only as useful as the logic used to define trade start and trade end. This script provides a robust framework for that analysis, but the quality of the conclusions depends on whether the chosen trigger, filter, location, session, and exit assumptions truly represent the strategy being studied. For this reason, the tool should be treated as a decision-support and research instrument, not as a substitute for complete testing, execution modeling, or professional risk management.
Disclaimer: This script is provided for research, educational, and analytical purposes only. It does not constitute financial advice, investment advice, trading advice, or a solicitation to buy or sell any financial instrument. It is not a fully automated trading strategy and should not be interpreted as a promise of profitability or future performance. All outputs, including signals, projected stop-loss and take-profit levels, MAE and MFE statistics, and summary metrics, are based on historical price behavior and user-selected settings. Past behavior does not guarantee future results. Market conditions change, statistical distributions evolve, and real-world execution may differ materially due to slippage, spreads, latency, liquidity, volatility, and trader discretion. Users are solely responsible for their own decisions, testing process, and risk management. Always validate any idea independently before applying it in live markets. Orderflow Tool [OmegaTools] Orderflow Tool: Delta Bubbles, Extremes and Divergences Detector
Overview
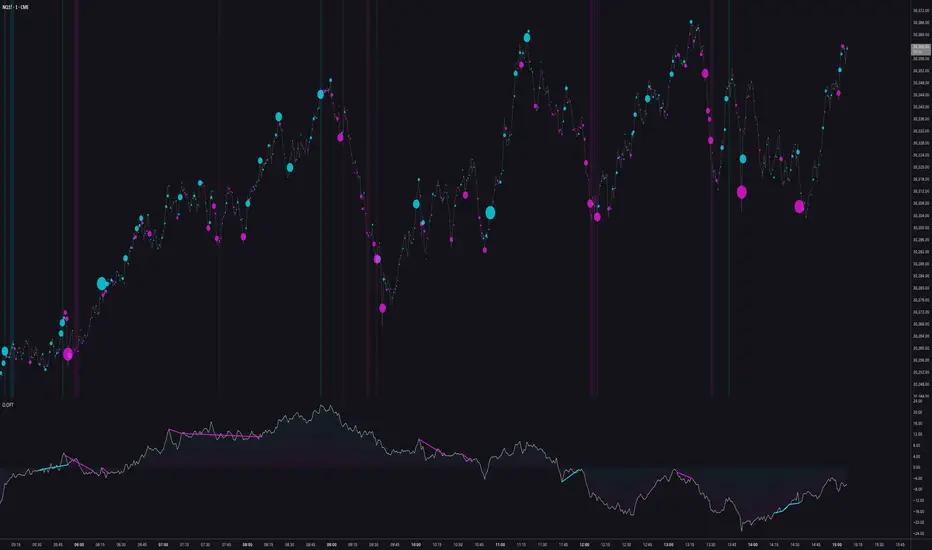
The Orderflow Tool is a volume-based analytical suite that reconstructs buying and selling pressure directly from intrabar data and presents it through four complementary layers: directional volume bubbles on the chart, statistically defined extreme order-flow zones, a multi-factor cumulative delta oscillator, and an automated divergence engine. Rather than relying on a single volume metric, the tool blends raw delta, normalized volume imbalance, and price-action behavior into one coherent reading of who is in control of the market — buyers or sellers — and how committed they are.
The indicator works on any symbol that provides volume data and on any chart timeframe.
How It Works
At its core, the tool pulls lower-timeframe data through TradingView's intrabar engine to estimate volume delta — the difference between volume traded on up-closing intrabars and volume traded on down-closing intrabars. This produces a far more granular picture of net aggression than standard bar volume, without requiring tick-level feeds.
Every derived metric is statistically normalized against its own recent standard deviation. This is a deliberate design choice: by expressing delta, volume, and imbalance in standardized units rather than raw figures, the tool behaves consistently across different instruments, sessions, and volatility regimes. A reading that is "extreme" on a low-volatility forex pair is measured by the same logic as one on a high-volatility index future.
Core Features
1. Order Flow Bubbles
Each bar is marked with a circle plotted at the volume-weighted average price of its intrabar activity — clamped within the bar's range — so the bubble sits where the trading actually concentrated, not simply at the close. The size of each bubble scales with the standardized magnitude of that bar's delta, emphasizing statistically rare bursts of activity, while its color shifts across a gradient between the buyer and seller colors according to the net direction of flow. Large, vividly colored bubbles flag bars where one side committed disproportionate volume — frequently the footprints left at turning points, breakouts, and absorption events.
2. Extreme Order Flow Zones
A rolling cumulative pressure series is compared against its own distribution over a 200-bar window. When buying or selling pressure pushes beyond its 99th or 1st percentile , the background is highlighted in the corresponding color. These zones isolate the moments when order flow becomes genuinely exhausted or climactic, rather than merely strong — a context filter that helps distinguish ordinary momentum from potential capitulation and blow-off conditions.
3. Cumulative Delta Driver
The centerpiece oscillator is a composite driver built from three independent inputs: a short-term buy-versus-sell volume imbalance, a medium-term cumulative normalized delta, and a price-action pressure proxy that classifies each bar by its rejection, absorption, and breakout characteristics. These are blended into a single line — with the intrabar delta component carrying the heaviest weight — and rendered with a directional fill above and below the zero line. The driver is designed to express the underlying current of order flow rather than price itself, often leading or diverging from price during accumulation and distribution phases.
4. Order Flow Divergences
The tool continuously tracks confirmed price pivots and records the value of the Cumulative Delta Driver at each one. When price prints a lower low while the driver prints a higher low , a bullish divergence line is drawn; when price prints a higher high while the driver prints a lower high , a bearish divergence line is drawn. These automatically plotted connections highlight situations where price extension is no longer supported by underlying flow — a classic early-warning signature of weakening conviction.
Settings
Resolution — sets the lower timeframe used to reconstruct intrabar order flow. Selecting a finer resolution increases the granularity of the delta calculation; leaving it empty defaults to chart-level data.
Bubbles — toggles the on-chart volume bubbles.
Bubble Adjustment — shifts the overall sizing of the bubbles to suit different instruments and chart scales.
Extreme — toggles the percentile-based extreme background zones.
Extreme Length — controls the lookback of the cumulative pressure series that feeds the extreme detection.
Buyers / Sellers Colors — fully customizable color scheme applied consistently across bubbles, extremes, the driver fill, and divergence lines.
How To Use It
The four layers are intended to be read together. Use the bubbles to spot where and how aggressively volume is being placed in real time, the extreme zones to frame those bursts within a statistical context, the Cumulative Delta Driver to gauge the broader balance of pressure, and the divergences to anticipate exhaustion before it appears in price. Confluence between an extreme zone, a large opposing bubble, and a fresh divergence is generally the most actionable configuration. The tool is built as a discretionary decision-support layer and pairs naturally with structure-based methods such as support and resistance, order blocks, or trend analysis.
Notes
Order-flow reconstruction depends on the availability of lower-timeframe data for the selected symbol; instruments without volume cannot be analyzed. Divergence lines are based on confirmed pivots and therefore appear after the pivot's confirmation delay, which is normal behavior for pivot-based logic and not a repainting artifact. As with all volume and delta tooling, results should be interpreted as probabilistic context, not as standalone signals.
Disclaimer
This indicator is provided for informational and educational purposes only and does not constitute financial advice. Trading involves substantial risk, and past behavior of any tool or market is not indicative of future results. Always conduct your own analysis and manage risk accordingly. Omega Heatmap Overview
The Omega Heatmap is a comprehensive price architecture engine that aggregates over 90 distinct reference levels from multiple analytical frameworks — HTF structure, volume dynamics, statistical projections, VWAP derivatives, pivot systems, and psychological price theory — into a single, unified heatmap overlay. The result is an always-on visual representation of the full gravitational field acting on price, rendered directly on the chart as colored areas and precision level lines.
Rather than plotting a fixed set of levels, Ω Heatmap is a convergence engine: it measures how many independent analytical methods point to the same price zone, and translates that count into color intensity. The more frameworks agree on a price, the hotter it appears. This turns a multi-source level map into a genuinely readable signal about where the market is likely to react.
he core concept behind Ω Heatmap is the reconstruction of liquidity architecture directly from price and volume data — approximating, without an order book feed, the resting interest zones that would be visible on a platform displaying depth-of-market or limit order distribution. To validate the relevance of each computed zone, an integrated volume scoring system measures the average volume expansion that occurs when price interacts with a displayed level, providing an objective, data-driven confirmation that the identified zones attract real market participation.
Core Methodology
1. Multi-Source Level Aggregation
Ω Heatmap computes price references across six distinct analytical categories simultaneously:
- HTF Structure: previous day/week/month highs, lows, and closes; current day high and low; intraday midpoints; quarterly range levels (25%/75% internal retracements of daily and weekly ranges)
- Psychological Levels: a proprietary adaptive precision system automatically calculates the big figure, mid figure, and sub-figure levels appropriate for the current instrument's price scale, eliminating the need for manual configuration. These levels self-calibrate as price moves across different magnitudes
- Volume Anchors: price levels at which maximum raw volume, maximum buying volume, and maximum selling volume were recorded across multiple lookback windows, identifying where the market committed capital most aggressively
- Statistical Projections: range extensions derived from daily, weekly, and recent swing ranges (×0.5, ×1, ×2 multipliers), providing objective expansion and retracement targets based on the instrument's own volatility signature
- VWAP Framework: both session and weekly VWAP with standard deviation bands, plus the previous session's anchored VWAP levels, offering dynamic institutional reference points
Pivot Systems, traditional daily and weekly pivot points with full support/resistance levels
All levels are snapped to the instrument's minimum tick and rounded to a configurable or auto-calculated precision grid, ensuring that levels from different sources that converge on the same price zone are recognized as the same level, rather than plotted as redundant separate lines.
2. Convergence Scoring & Heatmap Rendering
Once all levels are computed and deduplicated, the engine scores each unique price zone by counting how many independent references converged on it. Zones that exceed the configurable Levels Threshold are considered significant and rendered visually.
The color assigned to each zone is a function of both its convergence count and its directional context relative to current price — above or below determines the color polarity, while the convergence score determines the intensity tier across a 6-level gradient. This produces a genuine heatmap: faint zones represent moderate convergence, fully saturated zones represent exceptional multi-source agreement.
3. Level Lifecycle Management
Ω Heatmap includes a built-in level deactivation system. When price crosses a heatmap level with sufficient force, that level is temporarily suppressed and enters a cooldown period before becoming active again. This prevents stale, already-broken levels from cluttering the map and ensures the heatmap reflects the currently relevant price architecture — not the historical one.
4. Delta Bubbles
Overlaid on the heatmap is a real-time delta visualization layer. The engine reconstructs buying and selling volume from a lower timeframe data feed, computes the net directional delta for each bar, and normalizes it against both its recent distribution and its statistical deviation. The result is rendered as variable-size circles on price — larger and more opaque circles indicate statistically rare imbalances between buyers and sellers, with color reflecting the dominant side. This allows traders to immediately identify bars where order flow was unusually one-sided.
5. Volume Alpha Measurement
The bottom panel displays three live metrics:
- Volume α: the average volume (relative to baseline) specifically at bars where price crosses a heatmap level, expressed as a percentage. A reading above 100% means heatmap levels are crossed with above-average volume, confirming their relevance as reaction zones
- A (Benchmark): the same metric computed relative to round levels, providing a baseline for comparison
- Current: the current bar's volume pace relative to average, giving a real-time sense of whether the bar in progress is completing at elevated or subdued activity
Visual Modes
Ω Heatmap supports four rendering configurations:
Areas — horizontal boxes spanning each significant zone, width rolling forward with each bar, filled with the convergence-intensity color
Levels — the nine nearest significant levels to current price are rendered as persistent horizontal lines with price labels, color-coded by convergence and direction
Areas + Levels — both simultaneously for maximum spatial clarity
None — heatmap rendering disabled while delta bubbles remain active
Fourteen color palettes are available, including Standard, Temperature, Viridis, Neon Cyan/Magenta, Carbon, and Custom (user-defined), allowing full integration with any chart aesthetic.
How to Use This Indicator
Setup
Leave Precision at 0 for automatic level snapping calibrated to the instrument, or enter a manual value for custom grid resolution
Set Levels Threshold to control selectivity — a threshold of 3 means a zone must be referenced by at least 3 independent sources to appear. Increase for cleaner charts on instruments with many natural reference levels; decrease to capture more zones on sparser instruments
Select your preferred Mode and Color scheme
Enable Delta Bubbles and configure the Delta Timeframe to a sub-chart timeframe for intraday order flow context
Reading the Heatmap
The brightest, most saturated zones represent the highest convergence — these are the levels where the largest number of independent frameworks agree. Treat them as the strongest candidate reaction zones
Color polarity (direction-dependent) provides an immediate above/below context: each palette renders upper levels and lower levels in distinct hues
When price approaches a cluster of bright zones, the probability of a reaction — pause, reversal, or acceleration — is elevated relative to open space
Delta Bubbles
Large, fully opaque circles indicate statistically exceptional order flow imbalances — bars where one side dominated significantly beyond normal distribution
Use these as confirmation tools: a large delta bubble occurring at a bright heatmap zone represents a high-conviction interaction between price structure and order flow
Volume Alpha Panel
A Volume α significantly above 100% confirms that the computed levels attract elevated participation — they are genuinely active zones, not historical noise
Monitor the Current value to assess whether the bar in progress is developing with meaningful commitment or fading volume
Originality & Why This Is Closed-Source
The Omega Heatmap is not a level-plotting utility. Its core innovation is the convergence scoring architecture: the methodology by which over 90 heterogeneous price references — spanning institutional structure, volume history, statistical projections, and dynamic anchors — are normalized, deduplicated onto a shared precision grid, and scored into a unified intensity map. The adaptive psychological level engine, the level lifecycle management system, the delta reconstruction and normalization logic, and the volume alpha measurement framework are all proprietary implementations developed exclusively within OmegaTools. The source code is protected to preserve the integrity of the methodology and the commercial value of the tool for licensed users.
Important Disclosures
The heatmap, delta, and volume metrics displayed are derived from historical and real-time market data and do not constitute predictions of future price behavior. All trading involves risk. Ω Heatmap is a decision-support tool and does not constitute financial advice. It is designed to supplement, not replace, a complete trading methodology that includes risk management, position sizing, and trade management rules.
About OmegaTools
OmegaTools is a professional suite of proprietary TradingView indicators built for quantitative traders, systematic traders, and technically advanced discretionary traders. All tools are developed with rigorous statistical methodology and tested across multiple instruments and timeframes before release.
© OmegaTools. All rights reserved. Unauthorized redistribution or resale of access is strictly prohibited. Omega Macro The Omega Macro is an indicator part of the Omega Toolkit. The purpose of this tool is to provide a clear vision and a lot of useful indicators to analyze the market in the long term with more macro analysis.
The script has different features:
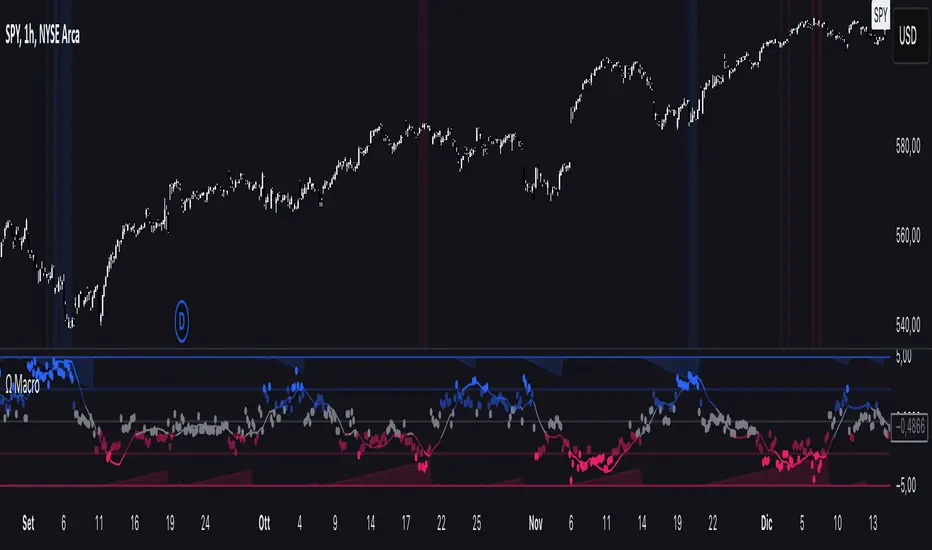
- Rating evaluator: this feature allow traders to have an overview of all the indicator inside of this script at once giving the asset you’re on a rating above or below zero.
- Option to select the chosen indicator to display
- Option to insert a benchmark symbol to analyze the correlation between the two assets. By default, if you enable the compared symbol, you’ll get a modification on the rating evaluator, the detrended spread, the value at risk, and on the sentiment oscillator. The benchmark can even be used in reverse, allowing for example traders to change the asset from USDJPY to JPYUSD.
- Option to activate the only long rating, useful to adjust the formula of the rating estimator for only long strategies.
- Settings to change the length of the indicator: between “Fast”, “Normal” and “Slow”. This setting is designed to use the indicator mainly on the Daily chart, analyzing respectively a month, a semester, and an entire year.
- Clear and easy visuals: users can adjust the color of all the indicators to have a common aesthetics and select the gradient mode for a different color mode of the rating evaluator
The Commitment of Traders (COT) report is a widely followed weekly publication in the futures market that provides a breakdown of the positions held by various market participants. It offers valuable insights into the market sentiment and helps traders and analysts assess the positioning of different market players, including commercial traders, non-commercial traders, and non-reportable traders. On this indicator you’ll see a colored line, indicating the Large traders, and the gray histogram, which displays the difference between the large traders and the commercial hedgers.
The VIX, also known as the CBOE Volatility Index, is a popular measure of market risk and investor sentiment. It is often referred to as the "fear gauge" or "fear index" because it is designed to reflect the market's expectation of future volatility over the next 30 days. On this indicator, we have designed a formula that allows traders to see an indicator that gives an output very similar to the standard Vix and can be calculated on any market.
Additionally, as shown in the picture, this indicator has two lines and a histogram, the upper line reflects the inverted vix, useful to analyze potential long reversal, meanwhile, the one below the zero line is calculated to detect the short price reversal and inversion. Together, they originate the gray histogram, which acts like a midpoint of the two lines.
The Detrended Spread indicator allows traders to analyze whether one asset outperforms or not the chosen benchmark, and also to detect clear price cycles and overbought or oversold levels thanks to the color coding of the main line.
The Value at Risk (VaR) is a widely used risk management tool that provides an estimate of the potential loss in value of a portfolio or assets over a specified time horizon, under normal market conditions, at a given confidence level. VaR helps traders assess and quantify the potential downside risk associated with their investments and portfolios.
With this script you’ll have both the short-term and the long-term VAR lines, being able to detect periods that allow traders to have less estimated risk on the market. The VAR does not provide any indication of the potential direction of the market, but it’s important data for risk management and volatility.
The Sentiment estimator is a tool that aims to give an indication about the sentiment of the markets, allowing traders both to have an indication about the direction of the market by timings and to have useful pieces of information about areas that can lead to a reversal of the price.
Risk Disclaimer:
All content and scripts provided are purely for informational & educational purposes only and do not constitute financial advice or a solicitation to buy or sell any securities of any type. Past performance does not guarantee future results. Trading can lead to a loss of the invested capital in the financial markets. I will not accept liability for any loss or damage, including without limitation any loss of profit, which may arise directly or indirectly from the use of or reliance on such information. All investments involve risk, and the past performance of a security, industry, sector, market, financial product, trading strategy, backtest, or individual's trading does not guarantee future results or returns. Investors are fully responsible for any investment decisions they make. Such decisions should be based solely on an evaluation of their financial circumstances, investment objectives, risk tolerance, and liquidity needs. Omega Bias Forecaster OVERVIEW
The Omega Bias Forecaster is a session-level directional prediction engine that applies a Markov-inspired state transition framework to intraday session analysis. It observes the directional outcome of up to three user-defined input sessions, encodes each into a ternary state (bullish, neutral, bearish), and queries a continuously updated frequency matrix to forecast the most probable directional outcome of a target output session — before that session begins.
The core premise is grounded in a well-documented market microstructure observation: the behavior of early sessions often conditions the behavior of later ones. Ω Session quantifies this relationship systematically, replacing discretionary session-bias reads with a data-driven probabilistic model that learns directly from the instrument's own history.
CONCEPTS
Session-Level Markov Architecture
The indicator discretizes each trading day into distinct session windows. For each input session, the system determines whether that session closed bullish (above the session open range), bearish (below it), or neutral (within it). These ternary classifications are combined into a composite state index that addresses a row in an internal frequency matrix.
The frequency matrix stores, for every observed combination of input session outcomes, how many times each directional outcome occurred in the target output session. When a new trading day begins and the input sessions complete, the system reads the row corresponding to today's observed state and retrieves the historically dominant outcome — producing a forecast for the output session that is grounded entirely in accumulated statistical evidence.
The matrix updates continuously: each time the output session completes, the observed result is recorded at the state address defined by that day's input session outcomes. Over hundreds of trading days, this builds a detailed probabilistic map of how session sequences tend to resolve.
Session Classification & Range Sensitivity
Each session's directional outcome is not a simple open-vs-close comparison. The system constructs a dynamic range envelope around the session's opening bar, calibrated by a fraction of the 200-period ATR. A session is classified as bullish only if it closes above the upper boundary of this envelope, and bearish only if it closes below the lower boundary. Outcomes that fall within the envelope are classified as neutral.
The Range Sensitivity parameter controls the width of this neutral zone. At higher values, only decisive session moves qualify as directional — producing fewer but higher-conviction state transitions. At zero, the neutral category is eliminated entirely and the system operates as a pure binary classifier (long or short), increasing signal frequency at the cost of granularity.
Single Candle Mode
Each input session can optionally operate in Single Candle mode, where instead of evaluating the full session's close relative to its open range, the system classifies only the first candle of that session. This captures the initial order flow impulse — the direction of the opening bar — which in many instruments carries predictive information about how the session will develop, particularly during high-liquidity opens.
Cross-Session State Encoding
The model supports up to three independent input sessions plus an optional daily context layer, producing a state space of up to 3⁴ = 81 unique configurations. Each configuration maps to its own row in the frequency matrix, meaning the system learns the conditional probability of the output session's direction given the specific combination of input session outcomes observed that day.
For example, the model can learn that when the Asian session was bearish, the London session was bullish, and the pre-NY session was neutral, the New York session historically closed bullish 68% of the time — and produce that forecast automatically.
FEATURES
Configurable Session Windows
All session times are fully user-defined, with timezone support spanning UTC-10 to UTC+10 plus automatic detection. This makes the indicator applicable to any global instrument — forex, futures, crypto, equities — regardless of the user's local timezone or the exchange's native hours.
Past Day Context
An optional fourth input channel incorporates the previous day's directional classification into the state vector, extending the model's memory beyond the current day's sessions. This captures overnight bias and multi-day momentum as additional conditioning information.
Dynamic Target Levels
When a directional forecast is active, the indicator computes and plots a projected target level based on the historical distribution of moves in the forecasted direction. The target is derived from a blend of the average move and a user-configurable percentile of historical moves, providing a statistically grounded profit objective rather than an arbitrary fixed distance.
Win Rate Filter
The confidence threshold filters out low-conviction forecasts. Only state configurations whose dominant outcome exceeds the specified percentage are displayed as active predictions, suppressing noise from states with ambiguous or evenly distributed historical outcomes.
Revert Mode
A single toggle inverts the forecast direction, allowing traders to test the contrarian hypothesis — whether fading the statistically dominant session outcome produces a better edge for their specific instrument.
Integrated Backtester
The indicator tracks two performance metrics in real time:
• Win Rate — the percentage of filtered forecasts where the predicted direction matched the actual output session outcome, computed from the user-defined backtest start date
• No Loss Rate — a more permissive metric that counts any outcome other than a loss in the predicted direction as a win, capturing scenarios where the forecast was neutral rather than wrong
Visual Session Mapping
Each input and output session is rendered on the chart with background highlighting and range threshold lines, providing immediate visual context for how the system is reading the current day's session structure.
HOW TO USE
Setup
1 — Define your input sessions to match the market phases you believe carry predictive power for your instrument. The defaults (17:00–01:00 and 01:00–09:00 UTC+2) correspond to the Asian and London sessions for European-timezone traders
2 — Set the output session to the trading window you want to forecast — typically the session where you plan to execute trades
3 — Adjust Range Sensitivity based on your instrument's behavior: higher values for volatile instruments where only decisive moves are meaningful, lower values for quieter markets where smaller directional edges matter
4 — Set the Win Rate Filter to at least 55% initially, then calibrate based on the number of data points available
Reading the Output
• When the output session begins, the table displays the forecasted direction along with its historical probability
• The second and third rows show the probability of the alternative outcomes, giving a complete distributional view
• Bar coloring during the output session reflects the predicted direction and its confidence
• When Target is enabled, a projected level line appears in the forecasted direction, representing the statistically expected move magnitude
Recommended Workflow
• Monitor the input sessions as they complete — the table updates in real time to show the state of each input ("was Long", "was Short", "was Neutral")
• Once all input sessions have completed and the output session begins, the forecast activates
• Use the Full InfoTable toggle to access detailed statistics including total data points, similarity count, individual session states, and backtest metrics
• Compare the forecast's win rate against its theoretical expectation to assess whether the model has captured a genuine edge on the current instrument and timeframe
LIMITATIONS
• The indicator is designed exclusively for intraday timeframes (60 minutes or lower). Applying it to daily or higher timeframes will produce an error
• The quality of the forecast depends directly on the amount of historical data available. Instruments with limited intraday history will have sparse frequency matrices and less reliable predictions
• Session definitions that overlap or leave gaps between input and output windows may produce inconsistent classifications. Ensure your session times form a coherent daily sequence
• The model assumes that inter-session conditional relationships are stationary over the learning period. Structural changes in trading hours, liquidity regimes, or market microstructure may reduce forecast accuracy until the matrix adapts
ORIGINALITY & WHY THIS IS CLOSED-SOURCE
The Omega Bias Forecaster is not a session highlighter or a static bias table. Its core innovation is the application of a Markov-inspired frequency matrix architecture to session-level directional forecasting: the methodology by which intraday session outcomes are discretized through ATR-adaptive range envelopes, combined into a multi-session composite state index, and used to address a continuously updated probabilistic transition table that outputs directional forecasts with confidence metrics and dynamic target projections. The dual-mode session classification (full session vs. single candle), the integrated no-loss backtester, and the percentile-based target computation framework are all proprietary implementations developed exclusively within OmegaTools. The source code is protected to preserve the integrity of the methodology and the commercial value of the tool for licensed users.
IMPORTANT DISCLOSURES
The statistical metrics displayed within the indicator (win rate, no loss rate, confidence percentages) are derived from historical data. Past performance is not indicative of future results. All trading involves risk. Ω Session is a decision-support tool and does not constitute financial advice. It is designed to supplement — not replace — a complete trading methodology that includes risk management, position sizing, and trade management rules.
ABOUT OMEGATOOLS
OmegaTools is a professional suite of proprietary TradingView indicators built for quantitative traders, systematic traders, and technically advanced discretionary traders. All tools are developed with rigorous statistical methodology and tested across multiple instruments and timeframes before release.
© OmegaTools. All rights reserved. Unauthorized redistribution or resale of access is strictly prohibited. Omega Trigger Pattern Forecaster Overview
The Omega Trigger Pattern Forecaster is a proprietary multi-dimensional pattern recognition engine designed to identify high-probability trade setups by combining adaptive trigger detection with contextual market condition filtering. Rather than generating signals based on a single indicator or fixed rule, Ω TPF learns from historical market behavior to determine which combination of market conditions has statistically preceded favorable price movement — and only fires a signal when those conditions are active simultaneously.
This tool is built for traders who understand that when you enter matters as much as how you enter, and who want a quantified, data-driven edge over discretionary pattern recognition.
Core Methodology
At its heart, Ω TPF operates through a three-layer architecture:
1. Trigger Detection
The indicator supports four distinct trigger mechanisms that define the event initiating the pattern search:
- Pivot: identifies structural swing points where price briefly violates a prior extreme before reversing
- Breakout: captures momentum expansion events as price breaks through recent range boundaries
- ZScore: detects statistically extreme deviations from mean price, normalized for current volatility
- Sequential: tracks directional persistence, flagging when one-sided price movement has extended beyond its typical duration
Each trigger includes a configurable sensitivity control that adjusts how selective or permissive the detection threshold is, allowing adaptation across instruments and timeframes.
2. Contextual Pattern Matching
Once a trigger event is identified, the engine evaluates whether the surrounding market context matches the historical profile of confirmed moves. This is done through up to four simultaneously active market condition parameters — Volume, Range, Excursion (close-to-open body ratio), Break (wick positioning within the candle), RSI, and MFI — each quantified using one of three statistical classification modes:
Percentile mode: classifies conditions into discrete tiers based on their historical distribution
ZScore mode: normalizes conditions relative to recent mean and standard deviation
Average mode: applies a simpler above/below mean binary classification
The matching logic compares the current state of each selected parameter against the statistical profile accumulated from past trigger occurrences, using a rolling learning memory that you can configure. Signals are only produced when the current context aligns with what the market has historically looked like before those triggers led to confirmed follow-through.
3. Confirmation Threshold
Beyond the contextual match, the engine requires that price has moved a minimum distance from the trigger point — derived dynamically from recent momentum distribution — before confirming the signal. This eliminates low-conviction setups and ensures only triggers with meaningful initial follow-through are forwarded to the signal layer.
Built-in Backtester & Alpha Measurement
Every signal is evaluated in real time through an integrated backtester that tracks directional accuracy over a configurable lookback window (up to 5,000 bars). The results panel displays:
α (Alpha): the win rate advantage over a 50% random baseline, computed for both long and short signals
A (Benchmark Alpha): the win rate of the raw trigger alone, without context filtering
The spread between α and A directly measures how much value the contextual filtering adds beyond the bare trigger — giving you an objective, live metric of the indicator's edge on your specific instrument and timeframe. The optional Average Excursion weighting further adjusts alpha by factoring in the relative size of winning vs losing moves, rewarding setups that not only win more often but win larger.
Hourly Efficiency Analysis
When used on intraday timeframes, Ω TPF includes an optional Hourly Efficiency Table that breaks down signal performance hour-by-hour (UTC+2). The table renders a heat map of win rates across the 24-hour cycle, allowing you to immediately identify which sessions produce the strongest results for your chosen configuration.
The Filter Valid Hours option takes this further by automatically suppressing signals during hours with historically sub-50% win rates, keeping only the strongest time windows active. This is particularly powerful for instruments like futures, forex majors, and crypto with well-defined session dynamics.
Visual Output
Ω TPF provides flexible signal rendering:
Signals: small diamond markers plotted above/below bars at confirmed entry points
Background: full candle background coloring for a less cluttered view
Signals & Background: combined mode for maximum visibility
Colors are fully customizable for long and short signals independently.
How to Use This Indicator
Setup
Select a Trigger type appropriate to your trading style (Pivot and ZScore work well for mean-reversion approaches; Breakout and Sequential suit trend-following)
Set the Length parameter to match the lookback that defines your relevant swing or volatility window (typically 5–20 for intraday, 10–30 for swing)
Choose the Sensitivity to control selectivity — higher values produce fewer but more filtered signals
Configure 1–4 Parameters to match the conditions you want confirmed before a signal fires. Starting with Volume + Range is a solid default for most instruments
Optimization
Monitor the α and A columns in the bottom-right panel. A healthy setup shows α > 0 and α > A (meaning the filter is adding value over the raw trigger)
Use the Hourly Efficiency Table on intraday charts to identify the most favorable trading windows, then enable Filter Valid Hours to apply that knowledge automatically
Adjust Learning Memory to control how many historical events inform the pattern profile. Lower values make the engine more adaptive to recent conditions; higher values produce a more robust statistical baseline
Set Backtest Length to define how far back win rate tracking extends
What to look for in a signal
Ω TPF signals are highest quality when:
Both α values are positive and the gap between α and A is significant (≥3%)
The signal fires during a historically high-efficiency hour (if using intraday timeframe)
The signal aligns with higher-timeframe structure or bias
Originality & Why This Is Closed-Source
Ω TPF is not a wrapper around standard indicators. Its core innovation lies in the adaptive pattern memory system: the way market conditions at the moment of each historical trigger are encoded, stored in rolling statistical profiles, and then matched against live market state to produce probabilistic signal qualification. The classification engine, the multi-modal discretization logic, and the real-time alpha measurement framework are all proprietary implementations developed exclusively within OmegaTools. The source code is protected to preserve the integrity of the methodology and the commercial value of the tool for licensed users.
Important Disclosures
Past performance of signal statistics displayed within the indicator is based on historical in-sample data and is not indicative of future results. All trading involves risk. Ω TPF is a decision-support tool and does not constitute financial advice. It is designed to supplement — not replace — a complete trading methodology that includes risk management, position sizing, and trade management rules.
About OmegaTools
OmegaTools is a professional suite of proprietary indicators built for quantitative traders, systematic traders, and technically advanced discretionary traders. All tools are developed with rigorous statistical methodology and tested across multiple instruments and timeframes before release.
© OmegaTools. All rights reserved. Unauthorized redistribution or resale of access is strictly prohibited.