MA Trend Ribbon# MA Trend Ribbon
## Overview
MA Trend Ribbon is a trend-following overlay that sits directly on the price chart. It draws a band made of six moving-average lines stacked from fastest to slowest. The band fills with color to show whether the market is leaning up or down, and it prints clear BUY and SELL labels at the moments the trend flips. It can also read the entire ribbon from a higher timeframe, so a lower-timeframe chart can be traded in line with the broader trend. The goal is a single, easy-to-read picture of trend direction and the points where that direction changes.
## What It Shows
- **The ribbon** — six moving averages of increasing length, drawn together as a colored band. When the band tilts and expands upward the trend is up; when it rolls over and expands downward the trend is down. A band that pinches flat signals a market with little direction.
- **The color** — the entire ribbon turns one color for an up-trend and another for a down-trend, so direction reads at a glance without studying the individual lines.
- **The labels** — a BUY label marks the bar where the trend turns up, and a SELL label marks the bar where the trend turns down. By default the labels ride the ribbon itself, sitting just outside the band; they can instead be pinned to the price candles. A label always appears on the same bar the ribbon changes color, so the two never disagree.
- **Optional bar coloring** — price bars can be tinted to match the trend for an even faster read.
- **Alerts** — built-in alerts announce each new BUY and SELL so the chart does not have to be watched constantly.
## The Structure Timeframe
The ribbon can be calculated on a timeframe other than the one being viewed. Left blank, it simply uses the chart's own timeframe. Set to a higher timeframe, the whole ribbon — its lines, its color, and its signals — is drawn from that broader view and displayed on the current chart. This makes it possible to watch a fast chart while keeping every reading aligned to a slower, more meaningful trend.
Two things are worth knowing when a higher timeframe is selected. The ribbon will look stepped, because each higher-timeframe value holds flat across the smaller bars until the larger bar completes. And the most recent portion can shift while the current higher-timeframe bar is still forming, settling once that bar closes; the confirm-on-close option keeps alerts from acting before it settles.
## How Direction Is Decided
The ribbon offers two ways to define the trend, chosen from a single setting:
- **Ribbon Flip** — the trend is up while the fastest line sits above the slowest line, and down when it drops below. This waits for the whole ribbon to turn over, giving steadier, less frequent signals.
- **Fastest MA Slope** — the trend is up the moment the fastest line starts rising and down the moment it starts falling. This reacts earlier and produces more signals.
Whichever method is selected controls both the ribbon color and the labels, keeping the visual and the signals in step.
## Choice of Averages
The ribbon is not limited to one style of average. A dropdown selects the type used for all six lines, ranging from smooth-and-steady to fast-and-reactive. Smoother types change direction later but hold trends more calmly. Faster types change direction sooner but shift more often. Because every line uses the same base length regardless of the type chosen, the base length usually deserves a fresh look after switching types, since the same number behaves differently from one average to the next.
The default type is volume-weighted, which leans on the bars that trade the most. On symbols whose data feed does not carry real volume, a volume-weighted average may behave unpredictably; on those markets one of the price-only types is the better choice.
## Optional Polish
Two extra touches can be switched on to make trends easier to judge, and both are off by default so the standard look stays clean:
- **Momentum-scaled ribbon** — the fill grows more solid as the band expands during a strong trend and fades as it compresses in a quiet market, so strong moves stand out and flat stretches recede.
- **Price-to-ribbon fill** — a soft shade fills the gap between price and the ribbon, making pullbacks toward the band easy to spot.
---
## User Inputs
### Structure
- **Structure Timeframe** — the timeframe the entire ribbon is calculated on. Blank uses the chart's own timeframe. A higher selection draws that higher timeframe's ribbon and signals on the current chart. Default is blank.
### Moving Average
- **Source** — the price used for the calculation. Default is the closing price. Other choices include the open, high, low, or an average of these.
- **MA Type** — the style of average used for every line in the ribbon. Ten options are available, from the smoothest and steadiest to the fastest and most reactive: Simple, Exponential, Weighted, Hull, Wilder's, Volume-Weighted, Double Exponential, Triple Exponential, Arnaud Legoux, and Least Squares. Default is Volume-Weighted.
- **Base MA Length** — the length of the fastest line in the ribbon. Smaller values make the whole ribbon quicker to react; larger values make it slower and smoother. Default is 40.
- **Ribbon Spacing** — the amount added to each line's length as the ribbon steps from fastest to slowest. Smaller values pack the six lines into a tight band; larger values spread them apart so the band widens and narrows more dramatically. Default is 8.
### Advanced MA Inputs
These settings apply only to specific average types and are ignored by the rest.
- **ALMA Offset** — applies only when the Arnaud Legoux type is selected. Higher values make that average track price more closely; lower values make it smoother. Default is 0.85.
- **ALMA Sigma** — applies only when the Arnaud Legoux type is selected. Larger values produce a smoother line; smaller values follow price more closely. Default is 6.
- **LSMA Offset** — applies only when the Least Squares type is selected. Shifts that line forward or backward by a set number of bars. Default is 0.
### Signals
- **Signal Trigger** — chooses how the trend is defined, either Ribbon Flip (steadier, later) or Fastest MA Slope (earlier, more frequent). Default is Ribbon Flip.
- **Show Buy/Sell Labels** — turns the BUY and SELL labels on or off. Default is on.
- **Label Position** — chooses where labels sit. Ribbon attaches them to the band, just below the lowest line for a buy and just above the highest for a sell, so they travel with the ribbon. Bar pins them to the candles instead, below the low for a buy and above the high for a sell. Default is Ribbon.
- **Label ATR Offset** — sets how far a label sits from the ribbon in Ribbon mode, scaled to recent price movement so the gap stays consistent in calm and volatile markets. A value of zero places the label right on the band; larger values push it further away. Has no effect in Bar mode. Default is 0.5.
- **Color Bars By Trend** — tints the price bars to match the current trend color. Default is off.
- **Confirm Signals On Bar Close** — when on, alerts wait until a bar has fully closed before firing, so a signal cannot appear and then disappear before the bar finishes. Labels still show while the bar is forming. Default is on.
### Style
- **Bullish Color** — the color of the ribbon and labels during an up-trend.
- **Bearish Color** — the color of the ribbon and labels during a down-trend.
- **Ribbon Fill Transparency** — how see-through the shaded band is, from solid to invisible. Default is 78.
- **Ribbon Line Width** — the thickness of each ribbon line. Default is 1.
- **Label Size** — the text size of the BUY and SELL labels, from tiny to large. Default is Normal.
### Visual Polish
- **Momentum-Scaled Ribbon** — when on, the fill grows more solid as the ribbon expands and fades as it compresses, so trend strength is reflected in the shading. Default is off.
- **Strong-Trend Fill Transparency** — the solidity of the fill at full ribbon expansion when the scaling above is on. Lower is more solid. Default is 38.
- **Momentum Normalization Length** — how many bars are used to judge how wide the ribbon is now compared with its recent range. Shorter values react faster to changes in strength; longer values give a steadier scale. Default is 100.
- **Fill Price To Ribbon** — shades the gap between price and the ribbon to highlight pullbacks. Default is off.
- **Price Fill Transparency** — how subtle that price-to-ribbon shading is. Higher is fainter. Default is 88.
---
## Best Use
The ribbon works best as a trend filter rather than a stand-alone entry system. Trends are followed most cleanly when trades lean in the direction of the ribbon color, using the labels to mark the turning points. Reading the ribbon from a higher Structure Timeframe while entering on a faster chart is a natural way to keep trades aligned with the larger trend. In quiet, sideways markets the ribbon will change color back and forth and produce more frequent, less reliable signals; the Ribbon Flip setting and a wider spacing reduce this, at the cost of later entries. Faster average types and tighter spacing suit active, short-term charts, while smoother types and wider spacing suit calmer, longer-term views. Wskaźnik

B8 UltimateB8 Ultimate
An Open Price Range indicator that automatically identifies the High/Low of a reference hour and extends this range over a configurable duration.
Features:
Up to 5 configurable symbols.
Zones are displayed only on their corresponding symbol.
Independent reference time for each symbol, in 30-minute increments.
Independent time zone for each symbol, with automatic Daylight Saving Time (DST) handling.
Rectangle duration and color configurable for each symbol.
Optional first-hour marker.
Configurable number of historical zones.
IG DAX and CAC preconfigured, with 3 additional free slots.
Behatsla’ha
Notes:
Uses 1H data for XX:00 reference times and aggregates 2 × 30-minute candles for XX:30.
Rectangle border width and transparency are configurable globally.
Rectangle fill can be enabled or disabled.
The optional first-hour marker automatically adapts to the chart timeframe.
The first-hour marker is displayed only on timeframes below 1H.
For XX:30 reference times on a 1H chart, the rectangle starts at the opening of the 1H candle containing XX:30. Example: 14:30 → displayed from 14:00.
The rectangle end is recalculated from this visual starting point. With a 24-hour duration: 14:00 → 14:00 the following day, preventing overlapping zones.
The High/Low is always calculated from the actual reference hour.
Short legend name: B8.
==========================================================================
Français :
B8 Ultimate
Indicateur de type "open price range" permettant de matérialiser automatiquement le High/Low d’une heure de référence et de prolonger cette zone sur une durée configurable.
Fonctionnalités :
Jusqu’à 5 actifs configurables.
Affichage uniquement sur l’actif correspondant.
Heure de référence configurable par actif, par pas de 30 minutes.
Fuseau horaire indépendant par actif, avec gestion automatique des changements d’heure.
Durée et couleur du rectangle configurables par actif.
Marqueur optionnel de la première heure
Nombre de zones historiques configurable.
DAX et CAC IG préconfigurés, avec 3 emplacements supplémentaires libres.
Behatsla’ha
Notes :
Calcul en 1H pour XX:00 et agrégation de 2 × 30 min pour XX:30.
Épaisseur et transparence du rectangle configurables globalement.
Option pour afficher ou masquer le remplissage du rectangle.
Marqueur optionnel de la première heure, adapté automatiquement à l’unité de temps affichée.
Le marqueur est affiché uniquement sur les timeframes inférieurs à 1H.
Pour XX:30 sur un graphique 1H, le rectangle commence à l’ouverture de la bougie 1H contenant XX:30. Exemple : 14:30 → affichage à partir de 14:00.
La fin est recalculée depuis ce début visuel. Avec une durée de 24 h : 14:00 → 14:00 le lendemain, afin d’éviter le chevauchement des rectangles.
Le High/Low est calculé sur l’heure réelle de référence.
Nom court dans la légende : B8. Wskaźnik

Market Maker BoxMarket Maker Box draws the last completed candle’s high and low as a live trading box, then colors that box for the candle that is forming now.
The idea is simple: market structure from the previous candle becomes the range you scalp this candle. Green means the forming candle is leaning up. Purple means it is leaning down. No color means chop — stand down.
Built for 5m and 15m charts so price prints inside the box, not beside it.
The boxes
Turn on the timeframes you want. They all run the same engine.
4H — on by default. Prior 4-hour high/low over the current 4-hour window.
Daily — prior day high/low over today.
9-day — prior 9-day high/low over the current 9-day window.
When a window closes, that box dies and a new one starts from the candle that just completed. The box grows with printed bars and stops a few candles past price so the live bar is readable.
How to read it
Color Meaning Destination
Neon green
Forming candle leaning bullish
Upper half — median to high
Neon purple
Forming candle leaning bearish
Lower half — low to median
Orange / TF tint
Chop. No call.
No shade
The shaded half is where price is predicted to go on that candle, not where you blindly click.
Labels show the level and how far price is from it, in percent.
Optional fibs (0.236 / 0.382 / 0.618 / 0.786) draw on every box you have turned on.
The lean
Trend first. A dip does not flip a green box purple.
EMA stack and slope on that box timeframe
The two candles before the box
A higher-timeframe completed body (daily helps 4H, 9-day helps daily)
Live candle can confirm the trend
Live candle cannot reverse the color unless a sweep-and-reclaim prints late in the window
ADX chop gate — no color in a dead tape
Color must hold a few chart bars before it paints
Stack the boxes. A green 4H inside a green daily is the clean scalp. Mixed colors means wait.
How to use it
Green box, price in the lower quarter → look long toward the median, then the high
Purple box, price in the upper quarter → look short toward the median, then the low
Price already in the destination half → you are late; wait for a pullback or the next box
Narrow grey box → range is too thin; fees eat the trade
Box-timeframe closes outside the range → the box is dead. That is continuation, not a fade
The box is the map. Your entry is still a reclaim, a rejection, or a limit at the level.
Defaults that stay clean
4H box on. Daily and 9-day off. Median on. Extra fibs off. Destination shade on. Break stamps off.
Add daily and 9-day when you want higher-timeframe context. Leave them off when you only want the session range.
Alerts
Off by default. Optional:
Price taps the box high or low
Confirmed 4H lean flips to bull or bear
What this is not
Not a signal bot. Not a guarantee the forming candle closes that color. Not financial advice.
The box tells you where you are and which way this window is leaning. You still pick the trigger and the size.
Pine v6 · © SRUS · Education and research only. Wskaźnik

Wskaźnik

Wskaźnik

Key Levels by fehzyKey Levels draws the price levels intraday traders usually mark by hand, as dotted lines that start at the candle where each level formed and extend past current price, with labels.
LEVELS
- Day High/Low (live) and Previous Day High/Low (PDH/PDL)
- Week High/Low (live) and Previous Week High/Low (PWH/PWL)
- Asia, London and New York session High/Low
- Daily Open, Weekly Open, and Market Open price (default 09:30 New York) with an optional vertical line
HOW IT WORKS
- Session presets: Full sessions (Tokyo 09:00-18:00 Tokyo time, London 08:00-17:00 London time, New York 08:00-17:00 NY time), ICT killzones (Asia 20:00-00:00, London 02:00-05:00, NY 07:00-10:00, all NY time), or Custom times with a separate timezone per session. Each session runs on its own clock, so levels stay correct during the weeks when US and UK daylight saving dates differ.
- Session highs/lows update live while a session is open and freeze when it closes.
- Day/week boundary option: chart daily candle, NY 17:00, NY midnight, or UTC 00:00, so PDH/PDL can match the daily candles of the broker you actually trade on.
- Swept levels option: once price trades through a completed level (PDH/PDL, PWH/PWL, session H/L), the line can keep extending, stop at the sweep candle, or be hidden.
- Session resets also work on charts without overnight data (a long data gap starts a new session).
HOW TO USE
Apply on a 15m or lower chart. Choose the session preset and day boundary that match your market and broker. Use the levels as reference zones for liquidity and reactions. The script does not generate buy or sell signals.
LIMITATIONS
- Sessions are designed for 15m and lower. On 1H, a 09:30 start falls inside the 09:00 candle.
- Only the most recent instance of each level is drawn, not past days.
- Day and session levels show on intraday charts only. Weekly levels show on intraday and daily.
- Labels can overlap when two levels share the same price. Wskaźnik

LDO-Swing v1.0LDO-Swing v1.0 — Simple Guide
## Purpose
LDO-Swing identifies directional swing highs and swing lows, marks their price levels, and tracks each level until price invalidates it.
## Swing logic
### Swing low (SL)
A swing low forms when price moves into a pivot with bearish candles and then moves away with two bullish candles.
### Swing high (SH)
A swing high is the converse: price moves into a pivot with bullish candles and then moves away with two bearish candles.
The signal is confirmed only when the second moving-away candle closes. The SH or SL box is then drawn on the earlier pivot candle. This confirmation prevents temporary intrabar signals from appearing and disappearing.
## Pattern layouts
- **5-bar (separate pivot):** two incoming candles, one separate pivot candle, then two moving-away candles. This is the default.
- **4-bar:** the second incoming candle is also the pivot, followed by two moving-away candles.
## Structure lookback
The default structure lookback is **10 bars**.
When **Apply structure-lookback filter** is enabled:
- An SH must be higher than the highs of the selected number of bars before its pivot.
- An SL must be lower than the lows of the selected number of bars before its pivot.
- The two moving-away candles must also remain below the SH or above the SL.
A larger lookback produces fewer, more selective swings. A smaller lookback produces more signals.
The lookback qualifies the swing; it does not give a level an expiry date. Once printed, a virgin level remains active until price actually breaks it.
## Levels and invalidation
- Swing-high levels are red by default.
- Swing-low levels are green by default.
- Levels are solid rather than dashed.
- Each swing has its own independently tracked level.
- **Extend virgin levels right** displays an unbroken level as a ray into future chart space.
- When price breaks a level, the ray becomes a finite line ending on the break candle.
Under **Level invalidation**, select:
- **Wick:** any wick beyond the level invalidates it. This is the default.
- **Close:** the candle must close beyond the level.
An exact touch does not count as a break; price must move beyond the level.
## Display settings
- **Show SH text boxes:** shows or hides swing-high labels.
- **Show SL text boxes:** shows or hides swing-low labels.
- **Show swing levels:** shows or hides the horizontal levels.
- **Swing-high colour / Swing-low colour:** changes the level and label colours.
- **Treat doji candles as invalid:** prevents a doji from satisfying a bullish or bearish candle requirement.
The BOS and CHoCH annotations sometimes visible on the same chart are not created by LDO-Swing. They come from another indicator, such as LDO-Vex.
## Alerts
LDO-Swing includes five alert conditions:
1. **New SH printed** — fires when a new swing high is confirmed.
2. **New SL printed** — fires when a new swing low is confirmed.
3. **New SH or SL printed** — one combined alert for either new swing type.
4. **Swing high broken** — fires when price invalidates an active SH level.
5. **Swing low broken** — fires when price invalidates an active SL level.
### Creating an alert in TradingView
1. Add **LDO-Swing v1.0** to the chart.
2. Select **Create Alert** in TradingView.
3. Under **Condition**, select **LDO-Swing v1.0**.
4. Select the required alert condition from the second menu.
5. For new SH/SL alerts, use **Once Per Bar Close**.
6. Choose the desired notification method and select **Create**.
The SH or SL marker is positioned on the pivot candle, but its alert fires two candles later—when the second moving-away candle closes and confirms the swing.
## Suggested starting settings
- Pattern layout: **5-bar (separate pivot)**
- Apply structure-lookback filter: **On**
- Structure lookback: **10**
- Treat doji candles as invalid: **On**
- Extend virgin levels right: **On**
- Level invalidation: **Wick**
Wskaźnik

FVG AtlasFVG Atlas — Multi-Timeframe Gap Mapping
FVG Atlas maps Fair Value Gaps across up to four timeframe layers, helping you see nearby zones, overlapping imbalances, and how price interacts with them.
Designed around a clean 1-minute NQ workflow, its timeframes, filters, and display settings are adjustable for other charts.
Features
Multi-timeframe FVGs: Track bullish and bearish gaps with independent colors and invalidation rules for each layer.
Focus mode: Display nearby zones while hidden records continue tracking fills, reactions, and statistics.
50% midpoint: Show consequent encroachment and emphasize it once reached.
Origin markers: Retain a small outline where an invalidated FVG originally formed.
BPR and confluence: Highlight opposing-gap overlaps within a layer and overlapping FVGs across distinct timeframes.
Session labels: Identify gaps formed during your configured regular-session window or outside it.
Nearest-gap panel: Show the distance in points to the closest active bullish and bearish FVG.
Third-candle classification: Describe confirmed FVG formation as Expansion, Inside, Opposing, or Neutral.
First-touch reactions: Mark confirmed rejections and provide hover details identifying the contributing zones.
Optional tools: Volume Imbalances, Opening Gaps, inverse FVGs, formation grading, and configurable lifecycle alerts.
How gaps are tracked
A bullish FVG forms when candle 3’s low is above candle 1’s high. A bearish FVG uses the opposite relationship.
Choose when a zone retires: first touch, midpoint reached, full wick penetration, or a confirmed chart close at or beyond its far edge. Invalidation and complete filling are tracked separately.
Live mode displays developing gaps that can change or disappear. Confirmation is processed when the next candle of that timeframe begins, so session breaks can delay confirmation. Higher-timeframe candles are assembled from chart data.
Reading the signals
Third-candle classifications describe formation behavior; they do not predict continuation or a fill.
Rejection triangles mark price touching a confirmed zone and subsequently closing back outside its near edge within the configured window. They represent observed reactions, not buy/sell instructions.
The dashboard reports detected zones, active records, invalidation statistics, and completed first-touch reactions. These are descriptive statistics—not strategy win rates.
Customization
Adjust minimum gap size, timeframe layers, drawing lookback, Focus limits, session hours, labels, colors, and alerts. Drawing and record limits keep the display manageable. Session labels use a configurable clock window rather than an exchange holiday calendar.
For alerts, enable the desired events in settings and create a TradingView alert using “Any alert() function call.” Wskaźnik

SBP Crypto Volume Structure IndicatorSBP Crypto Volume Structure Indicator is a crypto-specific price and volume structure framework designed to organize continuous 24/7 market movement into a developing value region and a confirmed directional signal state.
The indicator is based on the idea that cryptocurrency markets frequently move through alternating phases of value formation, expansion and acceptance. Instead of treating every price movement as an independent trend signal, the framework first estimates where trading activity has been concentrated within a rolling market window. It then evaluates whether price is remaining within that developed area or establishing itself outside it.
The central component is the Value Channel.
For the active rolling window, the script divides the observed price range into multiple price rows. The volume of each completed candle is distributed across the rows covered by that candle. The rows containing the greatest concentration of accumulated volume are then expanded around the dominant area until the required core participation percentage is reached.
This calculation creates an internal upper and lower structural region representing the part of the recent market range where a significant portion of trading activity has taken place.
The Value Channel is derived from this structural region rather than from a fixed percentage of price or a conventional moving-price envelope. Its centre is based on the developing structural range, while its width is related to the distance between the upper and lower structural boundaries. A volatility floor is also applied so the channel does not become unrealistically narrow during temporarily quiet market conditions.
Because cryptocurrency markets trade continuously, abrupt changes can occur when a large candle enters the rolling window or an older high-volume move leaves it. To reduce unnecessary visual jumps, the internal structure does not relocate instantly to every newly calculated level. Instead, the framework allows the structural region and Value Channel to migrate progressively toward the latest calculated values.
The second part of the framework evaluates price acceptance.
A Buy condition is not created simply because price touches or briefly crosses the upper side of the Value Channel. The script examines whether the candle is sufficiently established above the developed value region and whether the candle body shows adequate directional quality.
Similarly, a Sale condition requires meaningful establishment below the lower Value Channel rather than a temporary wick below the region.
The directional qualification process combines several related measurements: short-term versus slower price direction, directional movement balance, recent momentum, distance from the developing centre and the position of price relative to the Value Channel. These measurements are combined internally to determine whether the apparent breakout or continuation is sufficiently supported by current market behaviour.
The signal engine recognizes several related structural situations. These include decisive movement outside the Value Channel, successful interaction with a previously crossed channel boundary and continuation after price has already established itself outside the value region.
These are not separate indicators placed together on the chart. They are stages of one process: volume distribution establishes the structural context, the Value Channel defines the active value region, directional measurements evaluate acceptance, and the final state engine decides whether a Buy or Sale condition is qualified.
The indicator also applies a strict alternating signal sequence. After a Buy has been accepted, another Buy cannot print until a valid Sale condition occurs. After a Sale, another Sale cannot print until a valid Buy occurs. This helps prevent repeated same-direction labels during one continuous movement.
Signals are evaluated on confirmed bars only. The script does not intentionally use future data or negative plot offsets.
The indicator should be used as a structural market-analysis tool rather than as a prediction of future price. Crypto assets can experience rapid volatility, gaps between liquidity conditions, liquidation-driven moves and temporary false breakouts. Users should therefore evaluate the signals together with their own risk management, timeframe selection and broader market context. Wskaźnik

Wskaźnik

Asian ORB - Opening Range Breakout With MidpointAsian ORB — Opening Range Breakout
This indicator calculates the opening range for the Asian trading session and plots the session high, low, midpoint, and range area on the chart.
By default, the Asian ORB begins at 8:00 PM New York time and measures the first 15 minutes of trading. The levels are then extended until 2:00 AM New York time.
The indicator includes:
Asian session high and low
Opening-range midpoint
Optional range shading
Long and short breakout labels
Breakout alerts
Custom session times
Custom colors and line styles
Support for futures such as MNQ, NQ, MES, ES, YM, and GC
A long signal appears when price closes above the Asian ORB high. A short signal appears when price closes below the Asian ORB low.
For stronger confirmation, combine the signals with VWAP, moving averages, liquidity levels, market structure, or your preferred trading strategy. This indicator is designed as a breakout tool and should not be used as a standalone trading system.
Recommended timeframe: 5-minute chart.
This script is for educational purposes only and does not constitute financial advice. Wskaźnik

Economic Release and Earnings Highlighter -CPI, NFP, FOMC, etc.This script highlights historical and current candles during specific types of economic and earnings releases (the ones that typically result in high volatility and higher margin requirements). This includes triple witching days, CPI, FOMC, Non-farm Payroll, Jackson Hole speeches, PPI, CPE, and major earnings as well (including Target for instance that does influence equities a lot).
Highlights are color-coded for different releases, making it easy to scroll back and visually assess what happened. I will try and update for upcoming releases, this is getting published on Sept. 10th 2026 for 5 years back plus known dates of upcoming releases.
I hope it's useful to you.
Thanks. :)
Wskaźnik

Wskaźnik

Tidemarks - Session Levels & VWAPTidemarks — Session Levels & VWAP
Tidemarks brings session levels, daily and weekly reference prices, confirmed higher-timeframe swings, and VWAP into one customizable chart overlay. It keeps key prices visible as the session develops, with individual level controls and automatic label staggering to help keep crowded areas readable.
Available levels include:
Session: Pre-market and after-hours highs and lows.
Daily: Prior-day open, high, low, and close; current-day open, high, low, and range midpoint.
Weekly: Prior-week high, low, and close; current-week open, high, and low.
Swings: Latest confirmed 1-hour and 4-hour swing highs and lows, with adjustable pivot strength.
All-time high: Highest price found in the available monthly history.
VWAP uses typical price, (high + low + close) / 3, with session, weekly, or monthly resets. Optional ±1 and ±2 standard-deviation bands show price’s distance from VWAP.
Choose between historical level segments, the latest levels extending right, or the latest levels spanning the full chart. Customize individual colors, separate line styles and widths for daily, weekly, and swing levels, label size and spacing, and optional prices on labels and the price scale. Nearby labels automatically stagger horizontally.
Built-in alert conditions cover regular-session crosses above the pre-market high or below the pre-market low, plus crosses above and below VWAP.
Tidemarks is designed primarily for intraday charts. Pre-market and after-hours levels require extended-session bars to be available and enabled. VWAP requires volume data. The 1-hour swing levels appear on chart timeframes of 1 hour or lower; 4-hour swings appear on timeframes of 4 hours or lower. Swing levels become available after confirmation, with a delay determined by the selected swing strength.
Current daily and weekly ranges develop during their periods. Historical daily, weekly, and all-time-high displays can reflect completed higher-timeframe values before those values were known live, so historical charts should not be interpreted as a record of real-time signals. The all-time-high level also depends on available history.
Rebuilt and streamlined from “Price levels” by nkwdesmond, with attribution retained under the Mozilla Public License 2.0. Wskaźnik

PPT First 5-Minute Candle High/LowMarks the high and low of the very first 5-minute candle of the trading session — the "opening range" that opening-range-breakout (ORB) traders use as their first reference level of the day.
WHAT IT DOES
At the session open (9:30-9:35 AM ET by default), the indicator watches that opening 5-minute candle form in real time. The instant that candle closes, its high and low are locked in and drawn as two horizontal lines extending forward across the rest of the chart, optionally tagged with price labels ("5M High = ..." / "5M Low = ..."). Those two lines become your reference: a break above the high or below the low is the classic opening-range-breakout signal, while price holding between them marks the range traders can fade.
The lines are drawn fresh every session. By default only today's lines are kept (each new day's lines replace yesterday's); turn off "Show Only Today's Lines" to instead build up a running history of every session's opening range on the chart.
WORKS ON ANY CHART TIMEFRAME
You do not need to be viewing the 5-minute chart. When you are, the indicator reads the high/low directly off your own chart bars; on any other timeframe (1m, 15m, 1H, daily, etc.) it pulls the 5-minute data for you in the background, so the same opening-range lines show up no matter what timeframe you actually trade from.
MULTI-EXCHANGE SESSION SUPPORT
Choose which exchange's regular session open to mark — New York, London, Tokyo, Sydney or Hong Kong — or define your own session time and IANA timezone with the "Custom" option. This makes it useful for opening-range setups on US equities/futures, FX session opens, or other global markets without changing your chart's own timezone.
INPUTS
High/Low Line Color — colors for the two opening-range lines
Line Style / Width — solid, dashed or dotted, and line thickness
Exchange Timezone — which session's open to track (or Custom)
Custom Session/Timezone — session time (HHMM-HHMM) and IANA timezone, used only when Exchange = Custom
Show Only Today's Lines — keep just the current session's lines, or accumulate every past session's lines too
Show High/Low Labels — toggle the price-value text labels
Label Text Size — size of those labels
Label Gap — how far the labels sit from their line, as a percentage of price
This is a pure charting/visualization tool — it draws the opening-range levels for you to trade around manually; it does not place trades, plot buy/sell signals, or generate alerts on its own. Wskaźnik

Liquidity Sweep Confirmation Zones [Pineify]Liquidity Sweep Confirmation Zones
Overview
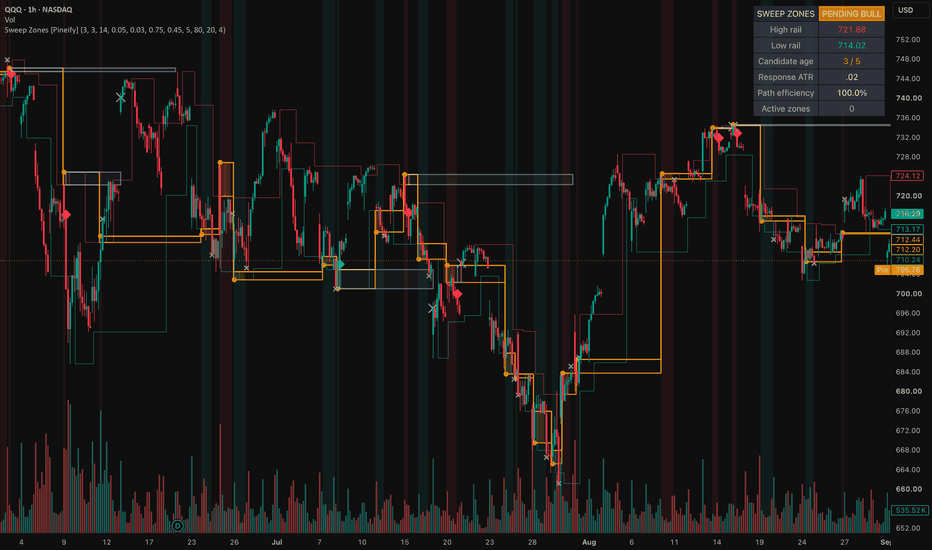
This overlay separates a wick beyond known swing liquidity from a response that earns a zone. It shows rails, a candidate bridge, confirmed boxes, retest wear, and a dashboard.
Problem Definition
A basic sweep rule labels every wick beyond a prior high or low. It cannot separate rejection from a breakout near the level, and it ignores later response. Permanent lines remain prominent after failure. Back-plotting a pivot also hides that right-side bars were required to confirm it. The task is to find a closed-bar pierce and reclaim at a level already known, then require timely departure before creating support or resistance.
Design Rationale
Confirmed pivots provide structure that existed before the sweep. Each rail is armed once to stop repeated events. ATR scaling replaces raw ticks across price levels, while the sweep freezes its rail, extreme, close, and ATR so later bars cannot rewrite the test. A limited window rejects delayed movement. Net displacement alone was rejected because a choppy path can eventually travel as far; efficiency also measures progress versus total close travel. This can omit real reversals, but accepted events are easier to audit. Dual-rail sweeps are ignored as directionally ambiguous.
Key Features
One-shot confirmed swing rails.
ATR-scaled pierce and reclaim gates.
Frozen response, path efficiency, and age.
Zones beginning at confirmation, with retest wear and bounded life.
Closed-bar candidate, confirmation, and invalidation alerts.
How It Works
ATR is calculated while a pivot waits for its right-side bars; its rail appears only when confirmed. A later closed bar becomes a candidate when its wick pierces one armed rail by the required ATR fraction and its close reclaims it by the chosen distance. That rail is consumed, while a dual-rail reclaim is ignored.
The candidate freezes direction, rail, extreme, reclaim close, and ATR. Later bars accumulate close travel. Response is directional progress divided by frozen ATR, and efficiency divides positive response by total travel. Both thresholds must pass on the reclaimed side before timeout. Closing through the extreme also fails the candidate.
Confirmation creates a green support or red resistance box on that bar. Each new entry counts as a retest and increases transparency. Bullish zones invalidate below their extreme; bearish zones invalidate above it. Age stops extension, storage removes the oldest excess box, and warm-up shows no rail until ATR and a pivot exist.
How Multiple Indicators Work Together
The stages form one causal chain. Pivots supply pre-existing levels; ATR supplies scale; reclaim establishes rejection; displacement tests follow-through; efficiency rejects wandering paths; the time window links response to sweep. The box preserves that frozen evidence for retest and invalidation. Removing a stage changes the question, so the components are not an arbitrary mashup.
Trading Ideas and Insights
A circle records rejection, not completed follow-through. The amber bridge shows the pending interval while response develops. Green means a downside sweep received efficient upward confirmation; red means the inverse. Fading records more separate retests and can suggest wear for review. These states organize rejection, confirmation, retest, and failure, but do not define entries, targets, returns, or size.
Unique Aspects
The contribution separates event knowledge from outcome. A rail begins only when confirmed, a sweep consumes it once, and its facts are frozen. Promotion needs ATR-scaled progress plus path efficiency within a fixed window. The box starts at promotion, so history does not imply earlier confirmation. Retests count only new entries, not every bar inside. This is an auditable state sequence rather than a renamed pivot marker.
How to Use
Choose pivots for the intended structure horizon.
Watch armed rails; a circle marks a closed-bar pierce and reclaim.
Read bridge, response ATR, efficiency, and age while pending.
Treat a diamond and new box as confirmation on that bar; then monitor retests and failure.
Use Once Per Bar Close alerts with separate execution and risk rules.
Customization
Larger pivots select broader but later structure. Higher pierce or reclaim values filter shallow probes. Raising displacement or efficiency requires cleaner response but reduces events; longer windows weaken temporal linkage. Zone life sets the horizon, maximum zones bounds objects, and maximum retests changes wear shading only. Visual layers hide independently. Defaults are not universal optima.
Assumptions and Limitations
Confirmed pivots are assumed useful liquidity references and ATR an adequate scale. Pivot delay leaves recent structure unavailable. Only one candidate is tracked, and dual-rail sweeps are rejected. Bar-based efficiency cannot reveal intrabar order, actual liquidity, stops, or intent. Gaps, fast trends, thin markets, and poor settings can break interpretation. Closed bars drive state, but setting or data revisions can recalculate history. The script does not detect actual stop hunts, predict reversals, measure profitability, or decide whether to trade a zone.
Conclusion
The overlay turns a known swing, closed-bar reclaim, and bounded efficient response into a staged record. No zone exists before follow-through qualifies it; delay, wear, expiry, and failure stay visible.
Wskaźnik
NASH BBv2: TRADE BY HAND FOR NOW### Overview
**NASH BBv2** is an all-in-one intraday market structure and trend-analysis script designed for futures and equity traders. It combines three distinct institutional concepts into a single chart overlay:
1. **Higher Timeframe Trend Anchoring:** A customizable HTF EMA filter (default: 15-minute 21 EMA) to keep trades aligned with the dominant trend.
2. **Session Open Basis Hierarchy:** Time-anchored opening price levels (Globex, Midnight, and NY Equities Open in Central Time) to score directional bias based on structural alignment.
3. **Automated Fair Value Gap (FVG) Engine:** Real-time 15-minute imbalance detection, complete with 50% equilibrium midlines and real-time mitigation tracking.
---
### Core Components & Mechanics
#### 1. HTF Trend Anchor (15m 21 EMA)
* **Calculation:** Fetches the 21-period Exponential Moving Average from a higher timeframe (default: 15m) using non-repainting `request.security` calls.
* **Trend Filtering:** Flags the market as bullish when price trades above the anchor line, and bearish when below.
* **Visuals:** Features an optional background shading gradient and serves as an execution filter for breakout signals.
#### 2. Session Open Basis Hierarchy (Chicago / CT Timezone)
Anchoring price relative to major institutional shift points provides crucial context for daily expansion:
* **5:00 PM CT (Globex Open):** Establishes the initial baseline for the trading day.
* **11:00 PM CT (MNO / Midnight Open):** Captures the European/London liquidity anchor.
* **8:30 AM CT (NY Open):** Marks the New York Cash Equities opening bell.
**Directional Scoring System:**
At 8:30 AM CT, the script automatically evaluates the spatial hierarchy of these three open levels:
* **Bulls Strong (`Score = +2`):** `5:00 PM Open < 11:00 PM Open < 8:30 AM Open` (Higher highs across session opens).
* **Bears Strong (`Score = -2`):** `5:00 PM Open > 11:00 PM Open > 8:30 AM Open` (Lower lows across session opens).
* **Mixed / No Edge (`Score = 0`):** Opens are out of sequence, signaling choppy or non-trending structural conditions.
#### 3. Intraday Breakout Signals
* **Logic:** Detects when intraday price pierces or closes beyond any of the three anchored open levels (5pm, 11pm, 8:30am CT).
* **Detection Modes:**
* `Wick/Touch`: Fires immediately when high or low crosses the level intraday.
* `Close`: Requires a full candle close beyond the level for strict confirmation.
* **Filter:** Breakout signals are aligned with the HTF EMA (Longs only above EMA, Shorts only below EMA).
#### 4. 15-Minute Fair Value Gap (FVG) Tracker
* **Imbalance Detection:** Identifies 3-bar price inefficiencies on the 15-minute timeframe (`High < Low ` for Bullish FVGs; `Low > High ` for Bearish FVGs).
* **Mitigation Tracking:** Dynamically extends FVG boxes and draws a 50% equilibrium line until price enters the zone. Once mitigated, the box dims to gray and stops extending.
---
### How to Use
1. **Determine Bias:** Check the 8:30 AM CT NY Open label and background tint. Look for **BULLS STRONG** or **BEARS STRONG** readings for high-conviction daily bias.
2. **Confirm Trend:** Ensure price is on the correct side of the HTF 21 EMA line before taking setups.
3. **Identify Key Zones:** Use the 15m FVG boxes and 50% midlines as high-probability entry or target zones during retests.
4. **Execute Breakouts:** Use the signal triangles (green/red) to catch momentum expansion off key session open lines.
---
### Key Inputs & Customization
| Parameter Group | Option | Description |
| --- | --- | --- |
| **EMA Settings** | `EMA Anchor Timeframe` | Timeframe for the higher timeframe EMA anchor (Default: `15`). |
| | `EMA Period` | Length of the anchor EMA (Default: `21`). |
| | `Filter Signals via EMA` | Enforces trend direction on breakout signals. |
| **Open Levels** | `Timezone` | Primary timezone for session anchors (Default: `America/Chicago`). |
| | `Breakout Detection` | Toggle between `Wick/Touch` or `Close` break modes. |
| | `Show Breakout Signals` | Plot/hide signal triangles on the chart. |
| **FVG Settings** | `FVG Master Timeframe` | Timeframe used for FVG detection (Default: `15`). |
| | `Bullish / Bearish Color` | Custom opacity and color schemes for gap boxes and midlines. |
---
### Alert Setup
This script includes pre-configured alert conditions for seamless execution monitoring:
* **NY Open Alignment:** Fires when the 8:30 AM CT structural score resolves to Bulls Strong, Bears Strong, or Mixed.
* **Breakout Alerts:** Fires real-time notifications on Long or Short open-level breakouts.
---
*Disclaimer: This indicator is designed solely for technical analysis, educational, and research purposes. It does not constitute financial advice, and past structural setups do not guarantee future market performance.* Wskaźnik

VWAP A BE BOPVWAP A BE BOP — Every Anchor You'll Ever Need, One Indicator
VWAP A BE BOP consolidates the anchored VWAP toolkit that traders normally piece together from three or four separate scripts into a single, clean overlay. Instead of hunting for daily VWAP here, a weekly anchor there, and a rolling previous-day reference somewhere else, every timeframe you actually trade around lives in one place — fully customizable, fully synced.
Five calendar-anchored VWAPs — Daily, Weekly, Monthly, Quarterly, and Yearly — give you the institutional reference levels that price consistently reacts to, each with its own toggle and color so you can build exactly the confluence stack your strategy calls for. Layer a fast Daily VWAP against a slower Monthly or Quarterly anchor to instantly see whether you're trading with or against the higher-timeframe flow.
Daily and Previous Day deviation bands bring statistical context to the mix. Three independently adjustable standard-deviation multipliers (defaulting to 1, 2, and 2.5) mark the zones where price has statistically stretched from fair value — classic mean-reversion and breakout-confirmation territory, without cluttering your chart with bands on every single line.
A true Previous Day VWAP, anchored precisely at session open with zero configuration required, plus optional rolling lines going back a full week — perfect for spotting how current price stacks up against where the market was trading 2, 3, or even 7 sessions ago.
Fully adjustable labels turn a wall of colored lines into an instantly readable chart. Rename any line to whatever shorthand you like — "pDay," "M," "Q" — and control label size and horizontal offset so the tags sit exactly where you want them, whether you're on a widescreen monitor or a cramped mobile chart.
Built for traders who live and die by mean reversion, fair value, and institutional order flow, VWAP A BE BOP strips away the noise of over-engineered multi-panel scripts and gives you a single, elegant, endlessly configurable VWAP suite — the last VWAP indicator you'll need to add to your chart.
For educational and informational purposes only. Not financial advice. Wskaźnik

Wskaźnik

Wskaźnik

Wskaźnik

Multi Cycle Session Boxes
Multi Cycle Session Boxes is an overlay tool that frames freely defined time windows with a box that grows with the price inside it.
It is built for anyone who keeps drawing the same rectangle over the same hours — a trading session, the run-up to a weekly close, a month, a season — and would rather have that window marked on every repetition without touching the chart again.
The principle is a plain comparison: each session holds a start point and an end point, and while the current bar falls between them the box tracks the highest high and the lowest low reached since the window opened.
There is no indicator arithmetic behind this; the entire calculation is calendar arithmetic carried out in a timezone of your choosing, which is what allows the same window to repeat on a daily, weekly, monthly or yearly cycle.
Seven such sessions run independently of one another, each with its own cycle, its own window and its own colors.
Timezone
Timezone: the timezone all seven sessions are evaluated in; Exchange follows the timezone of the symbol itself.
SESSION 1 (present seven times, SESSION 1–SESSION 7, each instance identically structured)
Show boxes: switches the session on or off.
Repeat: the cycle the window repeats on — Daily, Weekly, Monthly or Yearly.
It also decides which of the time fields below are evaluated.
Session 1 Time (Start:End)
Month: first and last month of the window, evaluated in Yearly only.
Day: first and last day of the window, evaluated in Weekly, Monthly and Yearly. In Weekly the day is counted from 1 for Monday to 7 for Sunday, otherwise it is the day of the month.
Hour: first and last hour of the window.
Minute: first and last minute of the window.
Session 1 Graphic
Fill: color of the box area.
Border: switches the border on or off, and sets its color and its width.
A box opens on the first bar that falls inside the window and is redrawn with every bar that follows: its upper edge sits at the highest high reached since the window opened, its lower edge at the lowest low, and its right edge moves along with the last bar still inside.
Once the window closes the box stays where it is, so what builds up on the chart is a record of what each repetition of that window actually contained.
Every session keeps its last seventy boxes and removes the oldest as new ones open, which keeps all seven of them together within what the platform allows a single script to draw.
The end of a window is exclusive: a window ending at 15:30 contains the bar before it, not the 15:30 bar itself.
A window whose end lies before its start is not discarded but crosses the boundary of its cycle instead, which is how an overnight session from 22:00 to 06:00 remains a single box.
If start and end are set to the same point, the window is open at all times and each box then spans one full cycle before the next one begins.
In Weekly the two day fields count only up to seven, and higher values are read as Sunday.
In Monthly and Yearly a day the calendar month does not have is never reached: an out-of-range start skips that repetition altogether, an out-of-range end carries the box through to the end of the month.
One point worth knowing before the first attempt: a window can only be resolved as precisely as the chart's timeframe permits.
A window from 12:00 to 15:30 needs bars that fall inside those hours — on a daily chart no bar begins at 12:00, so nothing is drawn there.
This indicator is intended solely for market analysis and does not constitute investment advice or a guarantee of success.
Use it at your own discretion and risk; past results are not indicative of future performance.
Wskaźnik

Candlestick Pattern ScannerCandlestick Pattern Scanner
Candlestick Pattern Scanner detects 28 classic Japanese candlestick patterns, 13 bullish, 13 bearish, 2 neutral, and qualifies every reversal pattern against its own prior-trend context, not candle shape alone. The same geometry (small body, long lower wick) reads as a Hammer after a downtrend and a Hanging Man after an uptrend.
HOW IT WORKS
Trend Engine, combines EMA slope, price displacement, market structure (higher-highs/higher-lows vs. lower-highs/lower-lows), and an optional efficiency-ratio directional weight into a 5-state trend read (Strong Downtrend to Strong Uptrend).
Off / Standard / Strict per pattern, every pattern is configured independently. Strict demands tighter geometric tolerance, a stronger prior trend, and better close/open placement than Standard.
Quality Score (0-100), geometry (40%), trend alignment (30%), proximity to a recent swing high/low (15%), and range-vs-ATR normalcy (15%). Ranks how far beyond the bare minimum a detection sits; it never changes whether a pattern fires, only how it's ranked and filtered.
Conflict resolution, when multiple patterns fire on the same bar, Display Mode picks what gets labeled: All, Highest Priority (multi-candle > two-candle > single-candle > neutral), or Highest Quality (default).
Built-in legend, a bottom-left table maps every abbreviation to its full pattern name.
BUILT-IN TRACKING
The Data Window keeps a running count of every pattern found, grouped Bullish/Bearish/Neutral with totals, a quick read on which patterns are actually showing up on this symbol/timeframe, not just single detections.
INPUTS
General: master Bullish/Bearish/Neutral toggles, Display Mode, Use Full Names, Show Quality Score, Minimum Quality.
Trend Engine: lookback, EMA lengths, strong/weak thresholds, efficiency-ratio toggle, ATR length, tolerance factors.
Pattern Configuration: Off/Standard/Strict per pattern, 28 total.
Appearance: bullish/bearish/neutral colors, label size/offset/transparency, legend table toggle.
Alerts: per-direction toggles and a minimum alert quality.
DISCLAIMER
This is an independent, original implementation of publicly known candlestick concepts, not a clone of, or claim of equivalence to, any specific commercial product. Every threshold is disclosed in the script itself. Classical candlestick patterns are not inherently predictive; use the Quality Score and your own back-testing to judge whether a given pattern/context combination has real edge on the symbol and timeframe you're trading, and always apply proper risk management.
Wskaźnik


