Gaussian RSI | NAL1. Overview
Gaussian RSI | NAL is a smoothed momentum-regime indicator built around an RSI engine filtered through a Gaussian weighting model. Instead of plotting raw RSI, the indicator applies Gaussian smoothing to reduce noise and create a cleaner momentum line.
The signal is then refined with an optional Gaussian confluence filter. This adds a second smoothing layer that acts as a directional confirmation structure, helping separate stronger momentum regimes from weaker internal fluctuations.
2. Calculation
The indicator starts by calculating RSI from the selected source. This creates the base momentum reading used by the rest of the model.
The RSI is then passed through a Gaussian filter. The Gaussian filter weights the lookback window using a bell-curve style distribution, creating a smoother momentum line while still preserving directional movement.
A second Gaussian filter can also be applied as a confluence line. This creates a slower reference layer for the Gaussian RSI, allowing the indicator to judge whether the current RSI structure is aligned with its own smoothed trend.
The bullish condition requires the Gaussian RSI to move above the upper threshold. When confluence is enabled, the Gaussian RSI must also be above the Gaussian confluence line.
The bearish condition requires the Gaussian RSI to move below the lower threshold. When confluence is enabled, the Gaussian RSI must also be below the Gaussian confluence line.
The final state holds its previous direction when neither condition is active. This creates a cleaner regime output instead of constantly flipping to neutral between threshold zones.
3. Key Features
Gaussian-smoothed RSI momentum engine.
Optional Gaussian confluence filter.
Upper and lower threshold-based regime detection.
State-based candle coloring and RSI coloring.
Glow-style RSI plot, regime fills, confluence line, and transition labels.
Designed to reduce raw RSI noise while preserving momentum structure.
4. Use
Gaussian RSI is designed to identify when momentum begins shifting into a stronger bullish or bearish regime. A move above the upper threshold reflects bullish momentum pressure, while a move below the lower threshold reflects bearish momentum pressure.
The confluence filter adds an additional layer of structure by requiring the Gaussian RSI to align with its own smoother reference line. This can help separate cleaner momentum expansions from weaker internal movement.
This indicator is best used as a specialized momentum module within a complete strategy framework. Its role is to isolate a refined RSI-based momentum layer, where the full value comes from how the signal is integrated into a broader process for regime, timing, and execution.
Wskaźnik

Wskaźnik

X-trenderThis script is designed to identify the market trend, its momentum, and potential reversal points by combining Arnaud Legoux Moving Averages (ALMA) and the Relative Strength Index (RSI).
The indicator is plotted in a separate pane below the price chart (overlay=false).
Here is a detailed breakdown of how the script works:
1. Core Logic (The Calculation)
The indicator filters out market noise by combining two powerful tools:
- ALMA (Arnaud Legoux Moving Average): An advanced moving average that reduces lag while maintaining superior smoothness. The script allows you to choose your preferred price source (e.g., Close, HLC3, OHLC4).
- RSI (Relative Strength Index): Instead of applying RSI directly to raw prices, the script calculates the RSI of the smoothed ALMA values and subtracts 50. This centers the indicator around a zero (0) baseline:
x - Values above 0 signal a bullish (upward) trend.
x - Values below 0 signal a bearish (downward) trend.
2. Dual Time Horizons (Short vs. Long)
The indicator analyzes the market from two perspectives simultaneously, creating two overlapping histograms:
- ShortTermXtrender: Calculates the RSI based on the difference between two fast ALMA lines. This captures rapid, local changes in price momentum.
- LongTermXtrender: Calculates the RSI directly from a single long ALMA line. This tracks the more stable, macro market trend.
3. Visual Signals and Charting
- Histogram Colors: Bright green/dark green represents upward momentum, while bright red/dark red represents downward momentum. The color brightens when the move accelerates and darkens when it slows down.
- Signal Line: A further smoothed ALMA of the short-term indicator. It turns bright green when moving up and red when moving down.
- Reversal Dots (Tiny Circles): Plotted at the exact pivot points of the signal line. A green dot marks a local bottom (potential buy signal), and a red dot marks a local peak (potential sell signal).
- Fixed Levels: Horizontal lines at 30 / -30 and 40 / -40 help identify overbought and oversold conditions.
4. Dynamic ATR Bands
When enabled, orange bands are drawn around the short-term indicator based on market volatility (Average True Range). These work similarly to Bollinger Bands. When the histogram breaks outside these bands, it signals an extreme market condition and a high probability of a price correction.
5. Multi-Timeframe (MTF) Dashboard
The script features an MTF dashboard that creates a clean table in the corner of your chart. It fetches the long-term trend data from multiple higher timeframes (e.g., 15m, 1h, 4h, 1D) at the same time:
- Displays BULL (green) if the long-term trend on that timeframe is positive.
- Displays BEAR (red) if the trend on that timeframe is negative.This allows you to quickly check the "higher timeframe bias" without switching charts. Wskaźnik

HBAR RSI Indicator [3Commas]HBAR RSI Indicator
🔷 What it does:
This is a signal-only indicator that mirrors a long-only DCA workflow on HBAR / USDT. It tracks a single virtual position: a base entry opens when 4h RSI(14) drops below 28; if price keeps falling, five averaging orders add to the virtual position at fixed deviations from the base entry, each larger than the last; the position is then closed at a fixed take-profit above the blended average entry. The indicator computes running average entry, deployed capital, open PnL, and lifetime realized PnL from honest fill-by-fill bookkeeping, and emits a webhook-ready JSON alert payload on the base order, every safety order, and the close.
- Single entry filter: 4h RSI(14) below 28 (deep oversold).
- Five averaging orders at fixed deviations (−2%, −5%, −9.5%, −16%, −25%) with 1.8× size scaling per rung.
- Fixed take-profit on the blended average entry; no trailing, no stop loss.
- Honest virtual bookkeeping: avg entry, deployed capital, Open PnL, and cumulative realized PnL displayed live on the chart.
🔷 Who is it for:
- Swing traders accumulating HBAR on deep RSI flushes who want a chart-driven signal source.
- Bot operators who want base / safety-order / close webhook JSON ready to drive a DCA Bot.
- Traders comfortable with martingale-style averaging who size their capital to the worst-case ladder fill.
- Traders who want strategy-tester-equivalent insight (live realized / unrealized PnL) without running a backtest engine.
🔷 How does it work:
Base Entry: On each closed 4h bar the indicator reads RSI(14). When RSI falls below 28 and there is no open virtual position, it marks a virtual base order at the close price and dispatches the entry webhook.
Averaging Orders: Once in a virtual position, the indicator watches price relative to the original base entry. The five safety orders are armed at fixed deviations from that base entry — not cumulatively — at −2%, −5%, −9.5%, −16%, and −25%. As each threshold is crossed on bar close, the corresponding safety order is recorded and its webhook fires. Order sizes scale 1.8× per rung ($900 → $1,620 → $2,916 → $5,249 → $9,448 from a $500 base), pulling the blended average entry down toward the latest fill.
Honest Virtual Bookkeeping: Total cost and qty are updated incrementally on every event, so the avg entry, deployed capital, and Open PnL displayed in the status table reflect the actual broker-equivalent position state — no shortcut, no synthetic averaging.
Take Profit & Lifetime PnL: When price closes at or above the take-profit level (a fixed percentage above the average entry), the virtual position is closed, its round-trip profit is added to a persistent realized-PnL counter, and the close webhook fires. The status table displays both Open PnL (current unrealized state) and cumulative realized PnL, so live performance is visible directly on the chart.
Capital Bounds: Total virtual deployed capital cannot exceed the base order plus the five safety orders. Once all five are filled, no further adds occur — the position simply waits for the take-profit.
🔷 Why it's unique:
- Deep-Oversold-Only Entries: A single, strict RSI(14) < 28 filter on 4h keeps the signal quiet in normal conditions and only fires after a meaningful flush.
- Fixed-Deviation Martingale Ladder: Safety orders are placed at fixed percentages from the base entry with deliberate 1.8× size scaling — a transparent, fully-specified averaging schedule rather than an opaque adaptive grid.
- Full Webhook Chain: Base order, each safety order, and the close all emit dedicated JSON payloads. One TradingView alert with "Any alert() function call" drives a 3Commas DCA Bot end-to-end.
- Live PnL Tracking: Open PnL and cumulative realized PnL are displayed live on the chart — the indicator gives strategy-tester-equivalent insight without running a backtest.
🔷 Considerations Before Using the Indicator:
Martingale Tail Risk: Order sizes scale 1.8× per rung, so the deepest fills are by far the largest. If HBAR trends hard below the −25% AO5 level without recovering to take-profit, the virtual position sits fully loaded with no further adds and no stop — Open PnL can grow deeply negative until price reverts.
No Stop Loss: There is no exit signal on adverse moves. Risk is bounded only by the fixed ladder allocation (base + five AOs ≈ $20,633 at default sizing). If a hard exchange-side stop is required, configure it on the bot directly.
Match Sizing to Your Bot: The avg-entry and PnL display becomes meaningful only when the indicator's base/AO sizing matches your real DCA Bot configuration.
Cross Detection Granularity: Base, safety-order, and take-profit events are evaluated on bar close. A bar that spikes through a level and returns within the same bar may be missed by design — this matches realistic polling behavior and avoids over-signaling on intra-bar wicks.
Live vs Historical State: The virtual position is rebuilt from chart history each time the indicator is recompiled. If the indicator is added mid-deployment or the live bot diverges from the signal stream (manual interventions, partial fills), the indicator state may not match the live bot. Toggle the indicator off and on to reset.
Backtesting Note: This is an indicator, not a strategy. There is no built-in P&L tester — but the live realized-PnL counter in the status table gives a running approximation. For full metrics over the reference ~30-month sample (81 closed trades, 82.72% win rate, 0.92% max drawdown, profit factor 11.248, +3.90% net return over January 1, 2024 – July 2, 2026), use the companion strategy version on identical parameters. Note the 81-trade sample is below the ~100-trade floor for statistical confidence — treat those metrics, including the high profit factor, as indicative.
🔷 How to Use It:
🔸 Add the indicator to a 4h HBAR / USDT chart.
🔸 Confirm the RSI level (28), the five AO deviations and sizes, and the take-profit percentage match your bot's configuration. Match the base/AO sizing so the avg-entry and PnL display stays meaningful.
🔸 In the DCA Bot Webhook group, paste the Bot ID, Email Token, and Pair (QUOTE_BASE format, e.g., USDT_HBAR).
🔸 Create an alert on the indicator with "Any alert() function call". Paste the DCA Bot's webhook URL into the alert's Webhook field. The base order, each safety order, and the close will each emit a dedicated JSON payload formatted for direct DCA Bot consumption.
🔷 INDICATOR SETTINGS
Base Order Size: Virtual capital committed on the first (base) entry.
AO Deviations: Fixed percentage distances from the base entry where each safety order fires.
AO Sizes: Virtual capital per safety order (1.8× scaling by default).
RSI Timeframe / Length / Level: Oversold filter for the base entry (default 4h, 14, below 28).
Take Profit (%): Distance above average entry where the full position closes.
DCA Bot Webhook: Bot ID, Email Token, and Pair fields injected into every alert payload.
Visualization: Toggle the AO ladder, fill labels, avg/TP lines, and status table (shows status, AOs filled, base/avg entry, TP target, deployed capital, open PnL, RSI, and cumulative realized PnL).
Brand Watermark: Configurable text, position, size, and transparency.
👨🏻💻💭 We hope this tool helps enhance your trading. Your feedback is invaluable, so feel free to share any suggestions for improvements or new features you'd like to see implemented.
__
The information and publications within the 3Commas TradingView account are not meant to be and do not constitute financial, investment, trading, or other types of advice or recommendations supplied or endorsed by 3Commas and any of the parties acting on behalf of 3Commas, including its employees, contractors, ambassadors, etc. Wskaźnik

HBAR RSI Strategy [3Commas]HBAR Long Strategy
🔷 What it does:
This is a long-only DCA (Dollar-Cost Averaging) strategy for HBAR / USDT that opens a position only in deep-oversold conditions and then averages down on a fixed safety-order ladder. A base order fires when 4h RSI(14) drops below 28; if price keeps falling, five averaging orders add to the position at fixed deviations from the base entry, each larger than the last. The full position is closed at a fixed take-profit above the blended average entry. There is no trailing exit and no stop loss — the position is structurally bounded by the five-order ladder.
- Single entry filter: 4h RSI(14) below 28 (deep oversold).
- Five averaging orders at fixed deviations (−2%, −5%, −9.5%, −16%, −25%) with 1.8× size scaling per rung.
- Fixed take-profit on the blended average entry; no trailing, no stop loss.
- Every fill and close emits a webhook-ready JSON alert payload for a DCA Bot.
🔷 Who is it for:
- Swing traders accumulating HBAR on deep RSI flushes rather than chasing momentum.
- Bot operators who want a chart-driven signal source with base / safety-order / close webhook JSON ready to drive a DCA Bot.
- Traders comfortable with martingale-style averaging who size their capital to the worst-case ladder fill.
- Range / mean-reversion traders who prefer mechanical oversold entries over discretionary timing.
🔷 How does it work:
Entry (Base Order): On each closed 4h bar the strategy reads RSI(14). When RSI falls below 28 and there is no open position, it opens the base order at market (or limit, optionally) and dispatches the entry webhook.
Averaging Orders: Once in a position, the strategy watches price relative to the original base entry. The five safety orders are armed at fixed deviations from that base entry — not cumulatively — at −2%, −5%, −9.5%, −16%, and −25%. As each threshold is crossed on bar close, the corresponding averaging order fires. Order sizes scale 1.8× per rung ($900 → $1,620 → $2,916 → $5,249 → $9,448 from a $500 base), pulling the blended average entry down toward the latest fill.
Exit (Take Profit): While in a position, the strategy computes a take-profit price a fixed percentage above the current average entry. When price closes at or above that level, the entire position is closed at market and the close webhook fires. There is no trailing and no stop loss.
Capital Bounds: Total deployed capital cannot exceed the base order plus the five safety orders. Once all five averaging orders are filled, no further adds occur — the position simply waits for the take-profit. This ladder cap is the strategy's primary risk control.
🔷 Why it's unique:
- Deep-Oversold-Only Entries: A single, strict RSI(14) < 28 filter on 4h keeps the strategy out of the market in normal conditions and only commits capital after a meaningful flush.
- Fixed-Deviation Martingale Ladder: Safety orders are placed at fixed percentages from the base entry with deliberate 1.8× size scaling, so each rung has progressively more influence on the average — a transparent, fully-specified averaging schedule rather than an opaque adaptive grid.
- Full Webhook Chain: Base order, each safety order, and the close all emit dedicated JSON payloads. The strategy can drive a 3Commas DCA Bot end-to-end with no glue layer.
- On-Chart Transparency: The AO ladder, average entry, and take-profit target are plotted live, and the status table reports RSI, AOs filled, base/average entry, TP target, and max deployable capital — so the position state is always visible.
🔷 Considerations Before Using the Strategy:
Trade Volume — Below the Statistical Floor: The reference backtest produced 81 closed trades over ~30 months. This is below the ~100-trade threshold often used as a floor for statistical relevance, so treat the win rate and the high profit factor as indicative rather than conclusive. The strict RSI < 28 filter is what keeps the trade count low.
Martingale Tail Risk: Order sizes scale 1.8× per rung, so the deepest fills are by far the largest. If HBAR trends hard below the −25% AO5 level without recovering to take-profit, the position sits fully loaded with no further adds and no stop — unrealized loss can grow until price reverts. The 1.8× scaling amplifies both the recovery speed and the downside.
No Stop Loss Justification: There is no exit on adverse moves. Per-order risk is bounded by the fixed ladder allocation; aggregate exposure is capped at base + five AOs (≈ $20,633 on the default $100k account, ~20.6% of equity). Size the base/AO inputs down to match the worst-case exposure you are willing to hold.
Capital Deployment & Drawdown: The reference backtest reached a 0.92% maximum equity drawdown at default sizing — but that depends on the configured ladder fitting within HBAR's observed swings. A deeper or more prolonged decline than the test sample would produce a larger drawdown.
Fees: The default commission (0.06% per trade) should be matched to your exchange's actual taker fees. With a fixed 3% take-profit the per-trade edge is modest, so a fee mismatch matters.
Demo Testing: Always demo-test before going live. Past results do not guarantee future performance, particularly for martingale-style averaging strategies whose risk profile is dominated by rare deep drawdowns.
🔷 STRATEGY PROPERTIES
Symbol: BYBIT:HBARUSDT.P (Perpetual) — strategy is portable to any HBAR / USDT pair.
Timeframe: 4H (RSI sampled on 4h).
Test Period: January 1, 2024 — July 2, 2026 (~30 months).
Initial Capital: 100,000 USDT.
Base Order Size: 500 USDT.
Averaging Orders: 5, at −2% / −5% / −9.5% / −16% / −25% from base entry.
AO Sizing: 1.8× per rung — 900 / 1,620 / 2,916 / 5,249 / 9,448 USDT.
Max Deployed Capital: ≈ 20,633 USDT (~20.6% of equity, all AOs filled).
Commission: 0.06% per trade.
Slippage: 3 ticks.
Entry Filter: 4h RSI(14) below 28.
Take Profit: 3% above average entry.
Stop Loss: None — ladder allocation is the structural risk cap.
Trailing: None.
Strategy: Long Only.
🔷 STRATEGY RESULTS
⚠️ Remember, past results do not guarantee future performance.
Net Profit: +3,902.32 USDT (+3.90%)
Max Equity Drawdown: 938.07 USDT (0.92%)
Total Closed Trades: 81
Percent Profitable: 82.72% (67 / 81)
Profit Factor: 11.248
🔷 How to Use It:
🔸 Adjust Settings: Open the strategy inputs and confirm the RSI level (28), the five AO deviations and sizes, and the take-profit percentage match your risk profile. Scale the base/AO sizes down for lower exposure.
🔸 Results Review: Run a full-period backtest and confirm Max Drawdown stays within your personal risk band — note this configuration reached just 0.92%. Keep in mind the 81-trade sample is below the ~100-trade floor for statistical confidence, and the 11.248 profit factor reflects that small, favorable sample.
🔸 Create alerts to trigger the DCA Bot: Add one alert on the strategy using "Any alert() function call". Paste your DCA Bot's webhook URL into the alert's Webhook field, and fill the Bot ID, Email Token, and Pair inputs on the script. The base order, each safety order, and the close will each emit a dedicated JSON payload.
🔷 INDICATOR SETTINGS
Base Order Size: Capital committed on the first (base) entry.
AO Deviations: Fixed percentage distances from the base entry where each safety order fires.
AO Sizes: Capital per safety order (1.8× scaling by default).
RSI Timeframe / Length / Level: Oversold filter for the base entry (default 4h, 14, below 28).
Take Profit (%): Distance above average entry where the full position closes.
Bot ID / Email Token / Pair: Webhook fields injected into every alert payload.
Visualization: Toggle the AO ladder, fill labels, avg/TP lines, and status table.
Brand Watermark: Configurable text, position, size, and transparency.
👨🏻💻💭 We hope this tool helps enhance your trading. Your feedback is invaluable, so feel free to share any suggestions for improvements or new features you'd like to see implemented.
__
The information and publications within the 3Commas TradingView account are not meant to be and do not constitute financial, investment, trading, or other types of advice or recommendations supplied or endorsed by 3Commas and any of the parties acting on behalf of 3Commas, including its employees, contractors, ambassadors, etc. Strategia

BTC RSI Indicator [3Commas]BTC RSI Indicator
🔷 What it does:
This is a signal-only indicator that mirrors a long-only DCA workflow on BTC / USDT. It tracks a single virtual position: a base entry opens when 4h RSI(14) drops below 28; if price keeps falling, five averaging orders add to the virtual position at fixed deviations from the base entry, each larger than the last; the position is then closed at a fixed take-profit above the blended average entry. The indicator computes running average entry, deployed capital, open PnL, and lifetime realized PnL from honest fill-by-fill bookkeeping, and emits a webhook-ready JSON alert payload on the base order, every safety order, and the close.
Single entry filter: 4h RSI(14) below 28 (deep oversold).
Five averaging orders at fixed deviations (−2%, −5%, −9.5%, −16%, −25%) with 1.8× size scaling per rung.
Fixed take-profit on the blended average entry; no trailing, no stop loss.
Honest virtual bookkeeping: avg entry, deployed capital, Open PnL, and cumulative realized PnL displayed live on the chart.
🔷 Who is it for:
Swing traders accumulating BTC on deep RSI flushes who want a chart-driven signal source.
Bot operators who want base / safety-order / close webhook JSON ready to drive a DCA Bot.
Traders comfortable with martingale-style averaging who size their capital to the worst-case ladder fill.
Traders who want strategy-tester-equivalent insight (live realized / unrealized PnL) without running a backtest engine.
🔷 How does it work:
Base Entry: On each closed 4h bar the indicator reads RSI(14). When RSI falls below 28 and there is no open virtual position, it marks a virtual base order at the close price and dispatches the entry webhook.
Averaging Orders: Once in a virtual position, the indicator watches price relative to the original base entry. The five safety orders are armed at fixed deviations from that base entry — not cumulatively — at −2%, −5%, −9.5%, −16%, and −25%. As each threshold is crossed on bar close, the corresponding safety order is recorded and its webhook fires. Order sizes scale 1.8× per rung ($900 → $1,620 → $2,916 → $5,249 → $9,448 from a $500 base), pulling the blended average entry down toward the latest fill.
Honest Virtual Bookkeeping: Total cost and qty are updated incrementally on every event, so the avg entry, deployed capital, and Open PnL displayed in the status table reflect the actual broker-equivalent position state — no shortcut, no synthetic averaging.
Take Profit & Lifetime PnL: When price closes at or above the take-profit level (a fixed percentage above the average entry), the virtual position is closed, its round-trip profit is added to a persistent realized-PnL counter, and the close webhook fires. The status table displays both Open PnL (current unrealized state) and cumulative realized PnL, so live performance is visible directly on the chart.
Capital Bounds: Total virtual deployed capital cannot exceed the base order plus the five safety orders. Once all five are filled, no further adds occur — the position simply waits for the take-profit.
🔷 Why it's unique:
Deep-Oversold-Only Entries: A single, strict RSI(14) < 28 filter on 4h keeps the signal quiet in normal conditions and only fires after a meaningful flush.
Fixed-Deviation Martingale Ladder: Safety orders are placed at fixed percentages from the base entry with deliberate 1.8× size scaling — a transparent, fully-specified averaging schedule rather than an opaque adaptive grid.
Full Webhook Chain: Base order, each safety order, and the close all emit dedicated JSON payloads. One TradingView alert with "Any alert() function call" drives a 3Commas DCA Bot end-to-end.
Live PnL Tracking: Open PnL and cumulative realized PnL are displayed live on the chart — the indicator gives strategy-tester-equivalent insight without running a backtest.
🔷 Considerations Before Using the Indicator:
Martingale Tail Risk: Order sizes scale 1.8× per rung, so the deepest fills are by far the largest. If BTC trends hard below the −25% AO5 level without recovering to take-profit, the virtual position sits fully loaded with no further adds and no stop — Open PnL can grow deeply negative until price reverts.
No Stop Loss: There is no exit signal on adverse moves. Risk is bounded only by the fixed ladder allocation (base + five AOs ≈ $20,633 at default sizing). If a hard exchange-side stop is required, configure it on the bot directly.
Match Sizing to Your Bot: The avg-entry and PnL display becomes meaningful only when the indicator's base/AO sizing matches your real DCA Bot configuration.
Cross Detection Granularity: Base, safety-order, and take-profit events are evaluated on bar close. A bar that spikes through a level and returns within the same bar may be missed by design — this matches realistic polling behavior and avoids over-signaling on intra-bar wicks.
Live vs Historical State: The virtual position is rebuilt from chart history each time the indicator is recompiled. If the indicator is added mid-deployment or the live bot diverges from the signal stream (manual interventions, partial fills), the indicator state may not match the live bot. Toggle the indicator off and on to reset.
Backtesting Note: This is an indicator, not a strategy. There is no built-in P&L tester — but the live realized-PnL counter in the status table gives a running approximation. For full metrics over the reference ~30-month sample (62 closed trades, 70.97% win rate, 3.79% max drawdown, profit factor 4.028, +3.08% net return over January 1, 2024 – June 29, 2026), use the companion strategy version on identical parameters. Note the 62-trade sample is below the ~100-trade floor for statistical confidence — treat those metrics as indicative.
🔷 How to Use It:
🔸 Add the indicator to a 4h BTC / USDT chart.
🔸 Confirm the RSI level (28), the five AO deviations and sizes, and the take-profit percentage match your bot's configuration. Match the base/AO sizing so the avg-entry and PnL display stays meaningful.
🔸 In the DCA Bot Webhook group, paste the Bot ID, Email Token, and Pair (QUOTE_BASE format, e.g., USDT_BTC).
🔸 Create an alert on the indicator with "Any alert() function call". Paste the DCA Bot's webhook URL into the alert's Webhook field. The base order, each safety order, and the close will each emit a dedicated JSON payload formatted for direct DCA Bot consumption.
🔷 INDICATOR SETTINGS
Base Order Size: Virtual capital committed on the first (base) entry.
AO Deviations: Fixed percentage distances from the base entry where each safety order fires.
AO Sizes: Virtual capital per safety order (1.8× scaling by default).
RSI Timeframe / Length / Level: Oversold filter for the base entry (default 4h, 14, below 28).
Take Profit (%): Distance above average entry where the full position closes.
DCA Bot Webhook: Bot ID, Email Token, and Pair fields injected into every alert payload.
Visualization: Toggle the AO ladder, fill labels, avg/TP lines, and status table (shows status, AOs filled, base/avg entry, TP target, deployed capital, open PnL, RSI, and cumulative realized PnL).
Brand Watermark: Configurable text, position, size, and transparency.
👨🏻💻💭 We hope this tool helps enhance your trading. Your feedback is invaluable, so feel free to share any suggestions for improvements or new features you'd like to see implemented.
__
The information and publications within the 3Commas TradingView account are not meant to be and do not constitute financial, investment, trading, or other types of advice or recommendations supplied or endorsed by 3Commas and any of the parties acting on behalf of 3Commas, including its employees, contractors, ambassadors, etc. Wskaźnik

BTC RSI Strategy [3Commas]BTC RSI Strategy
🔷 What it does:
This is a long-only DCA (Dollar-Cost Averaging) strategy for BTC / USDT that opens a position only in deep-oversold conditions and then averages down on a fixed safety-order ladder. A base order fires when 4h RSI(14) drops below 28; if price keeps falling, five averaging orders add to the position at fixed deviations from the base entry, each larger than the last. The full position is closed at a fixed take-profit above the blended average entry. There is no trailing exit and no stop loss — the position is structurally bounded by the five-order ladder.
- Single entry filter: 4h RSI(14) below 28 (deep oversold).
- Five averaging orders at fixed deviations (−2%, −5%, −9.5%, −16%, −25%) with 1.8× size scaling per rung.
- Fixed take-profit on the blended average entry; no trailing, no stop loss.
- Every fill and close emits a webhook-ready JSON alert payload for a DCA Bot.
🔷 Who is it for:
- Swing traders accumulating BTC on deep RSI flushes rather than chasing momentum.
- Bot operators who want a chart-driven signal source with base / safety-order / close webhook JSON ready to drive a DCA Bot.
- Traders comfortable with martingale-style averaging who size their capital to the worst-case ladder fill.
- Range / mean-reversion traders who prefer mechanical oversold entries over discretionary timing.
🔷 How does it work:
Entry (Base Order): On each closed 4h bar the strategy reads RSI(14). When RSI falls below 28 and there is no open position, it opens the base order at market (or limit, optionally) and dispatches the entry webhook.
Averaging Orders: Once in a position, the strategy watches price relative to the original base entry. The five safety orders are armed at fixed deviations from that base entry — not cumulatively — at −2%, −5%, −9.5%, −16%, and −25%. As each threshold is crossed on bar close, the corresponding averaging order fires. Order sizes scale 1.8× per rung ($900 → $1,620 → $2,916 → $5,249 → $9,448 from a $500 base), pulling the blended average entry down toward the latest fill.
Exit (Take Profit): While in a position, the strategy computes a take-profit price a fixed percentage above the current average entry. When price closes at or above that level, the entire position is closed at market and the close webhook fires. There is no trailing and no stop loss.
Capital Bounds: Total deployed capital cannot exceed the base order plus the five safety orders. Once all five averaging orders are filled, no further adds occur — the position simply waits for the take-profit. This ladder cap is the strategy's primary risk control.
🔷 Why it's unique:
- Deep-Oversold-Only Entries: A single, strict RSI(14) < 28 filter on 4h keeps the strategy out of the market in normal conditions and only commits capital after a meaningful flush.
- Fixed-Deviation Martingale Ladder: Safety orders are placed at fixed percentages from the base entry with deliberate 1.8× size scaling, so each rung has progressively more influence on the average — a transparent, fully-specified averaging schedule rather than an opaque adaptive grid.
- Full Webhook Chain: Base order, each safety order, and the close all emit dedicated JSON payloads. The strategy can drive a 3Commas DCA Bot end-to-end with no glue layer.
- On-Chart Transparency: The AO ladder, average entry, and take-profit target are plotted live, and the status table reports RSI, AOs filled, base/average entry, TP target, and max deployable capital — so the position state is always visible.
🔷 Considerations Before Using the Strategy:
Trade Volume — Below the Statistical Floor: The reference backtest produced 62 closed trades over ~30 months. This is below the ~100-trade threshold often used as a floor for statistical relevance, so treat the win rate and profit factor as indicative rather than conclusive. The strict RSI < 28 filter is what keeps the trade count low — and BTC is less volatile than smaller alts, so deep flushes below the entry threshold are relatively rare.
Martingale Tail Risk: Order sizes scale 1.8× per rung, so the deepest fills are by far the largest. If BTC trends hard below the −25% AO5 level without recovering to take-profit, the position sits fully loaded with no further adds and no stop — unrealized loss can grow until price reverts. The 1.8× scaling amplifies both the recovery speed and the downside.
No Stop Loss Justification: There is no exit on adverse moves. Per-order risk is bounded by the fixed ladder allocation; aggregate exposure is capped at base + five AOs (≈ $20,633 on the default $100k account, ~20.6% of equity). Size the base/AO inputs down to match the worst-case exposure you are willing to hold.
Capital Deployment & Drawdown: The reference backtest reached a 3.79% maximum equity drawdown at default sizing — but that depends on the configured ladder fitting within BTC's observed swings. A deeper or more prolonged decline than the test sample would produce a larger drawdown.
Fees: The default commission (0.06% per trade) should be matched to your exchange's actual taker fees. With a fixed 3% take-profit the per-trade edge is modest, so a fee mismatch matters.
Demo Testing: Always demo-test before going live. Past results do not guarantee future performance, particularly for martingale-style averaging strategies whose risk profile is dominated by rare deep drawdowns.
🔷 STRATEGY PROPERTIES
Symbol: BYBIT:BTCUSDT.P (Perpetual) — strategy is portable to any BTC / USDT pair.
Timeframe: 4H (RSI sampled on 4h).
Test Period: January 1, 2024 — June 29, 2026 (~30 months).
Initial Capital: 100,000 USDT.
Base Order Size: 500 USDT.
Averaging Orders: 5, at −2% / −5% / −9.5% / −16% / −25% from base entry.
AO Sizing: 1.8× per rung — 900 / 1,620 / 2,916 / 5,249 / 9,448 USDT.
Max Deployed Capital: ≈ 20,633 USDT (~20.6% of equity, all AOs filled).
Commission: 0.06% per trade.
Slippage: 3 ticks.
Entry Filter: 4h RSI(14) below 28.
Take Profit: 3% above average entry.
Stop Loss: None — ladder allocation is the structural risk cap.
Trailing: None.
Strategy: Long Only.
🔷 STRATEGY RESULTS
⚠️ Remember, past results do not guarantee future performance.
Net Profit: +3,078.29 USDT (+3.08%)
Max Equity Drawdown: 3,852.12 USDT (3.79%)
Total Closed Trades: 62
Percent Profitable: 70.97% (44 / 62)
Profit Factor: 4.028
🔷 How to Use It:
🔸 Adjust Settings: Open the strategy inputs and confirm the RSI level (28), the five AO deviations and sizes, and the take-profit percentage match your risk profile. Scale the base/AO sizes down for lower exposure.
🔸 Results Review: Run a full-period backtest and confirm Max Drawdown stays within your personal risk band — note this configuration reached 3.79%. Keep in mind the 62-trade sample is below the ~100-trade floor for statistical confidence.
🔸 Create alerts to trigger the DCA Bot: Add one alert on the strategy using "Any alert() function call". Paste your DCA Bot's webhook URL into the alert's Webhook field, and fill the Bot ID, Email Token, and Pair inputs on the script. The base order, each safety order, and the close will each emit a dedicated JSON payload.
🔷 INDICATOR SETTINGS
Base Order Size: Capital committed on the first (base) entry.
AO Deviations: Fixed percentage distances from the base entry where each safety order fires.
AO Sizes: Capital per safety order (1.8× scaling by default).
RSI Timeframe / Length / Level: Oversold filter for the base entry (default 4h, 14, below 28).
Take Profit (%): Distance above average entry where the full position closes.
Bot ID / Email Token / Pair: Webhook fields injected into every alert payload.
Visualization: Toggle the AO ladder, fill labels, avg/TP lines, and status table.
Brand Watermark: Configurable text, position, size, and transparency.
👨🏻💻💭 We hope this tool helps enhance your trading. Your feedback is invaluable, so feel free to share any suggestions for improvements or new features you'd like to see implemented.
__
The information and publications within the 3Commas TradingView account are not meant to be and do not constitute financial, investment, trading, or other types of advice or recommendations supplied or endorsed by 3Commas and any of the parties acting on behalf of 3Commas, including its employees, contractors, ambassadors, etc. Strategia

Wskaźnik

XRP RSI Indicator [3Commas]XRP RSI Indicator
🔷 What it does:
This is a signal-only indicator that mirrors a long-only DCA workflow on XRP / USDT. It tracks a single virtual position: a base entry opens when 4h RSI(14) drops below 28; if price keeps falling, five averaging orders add to the virtual position at fixed deviations from the base entry, each larger than the last; the position is then closed at a fixed take-profit above the blended average entry. The indicator computes running average entry, deployed capital, open PnL, and lifetime realized PnL from honest fill-by-fill bookkeeping, and emits a webhook-ready JSON alert payload on the base order, every safety order, and the close.
- Single entry filter: 4h RSI(14) below 28 (deep oversold).
- Five averaging orders at fixed deviations (−2%, −5%, −9.5%, −16%, −25%) with 1.8× size scaling per rung.
- Fixed take-profit on the blended average entry; no trailing, no stop loss.
- Honest virtual bookkeeping: avg entry, deployed capital, Open PnL, and cumulative realized PnL displayed live on the chart.
🔷 Who is it for:
- Swing traders accumulating XRP on deep RSI flushes who want a chart-driven signal source.
- Bot operators who want base / safety-order / close webhook JSON ready to drive a DCA Bot.
- Traders comfortable with martingale-style averaging who size their capital to the worst-case ladder fill.
- Traders who want strategy-tester-equivalent insight (live realized / unrealized PnL) without running a backtest engine.
🔷 How does it work:
Base Entry: On each closed 4h bar the indicator reads RSI(14). When RSI falls below 28 and there is no open virtual position, it marks a virtual base order at the close price and dispatches the entry webhook.
Averaging Orders: Once in a virtual position, the indicator watches price relative to the original base entry. The five safety orders are armed at fixed deviations from that base entry — not cumulatively — at −2%, −5%, −9.5%, −16%, and −25%. As each threshold is crossed on bar close, the corresponding safety order is recorded and its webhook fires. Order sizes scale 1.8× per rung ($900 → $1,620 → $2,916 → $5,249 → $9,448 from a $500 base), pulling the blended average entry down toward the latest fill.
Honest Virtual Bookkeeping: Total cost and qty are updated incrementally on every event, so the avg entry, deployed capital, and Open PnL displayed in the status table reflect the actual broker-equivalent position state — no shortcut, no synthetic averaging.
Take Profit & Lifetime PnL: When price closes at or above the take-profit level (a fixed percentage above the average entry), the virtual position is closed, its round-trip profit is added to a persistent realized-PnL counter, and the close webhook fires. The status table displays both Open PnL (current unrealized state) and cumulative realized PnL, so live performance is visible directly on the chart.
Capital Bounds: Total virtual deployed capital cannot exceed the base order plus the five safety orders. Once all five are filled, no further adds occur — the position simply waits for the take-profit.
🔷 Why it's unique:
- Deep-Oversold-Only Entries: A single, strict RSI(14) < 28 filter on 4h keeps the signal quiet in normal conditions and only fires after a meaningful flush.
- Fixed-Deviation Martingale Ladder: Safety orders are placed at fixed percentages from the base entry with deliberate 1.8× size scaling — a transparent, fully-specified averaging schedule rather than an opaque adaptive grid.
- Full Webhook Chain: Base order, each safety order, and the close all emit dedicated JSON payloads. One TradingView alert with "Any alert() function call" drives a 3Commas DCA Bot end-to-end.
- Live PnL Tracking: Open PnL and cumulative realized PnL are displayed live on the chart — the indicator gives strategy-tester-equivalent insight without running a backtest.
🔷 Considerations Before Using the Indicator:
Martingale Tail Risk: Order sizes scale 1.8× per rung, so the deepest fills are by far the largest. If XRP trends hard below the −25% AO5 level without recovering to take-profit, the virtual position sits fully loaded with no further adds and no stop — Open PnL can grow deeply negative until price reverts.
No Stop Loss: There is no exit signal on adverse moves. Risk is bounded only by the fixed ladder allocation (base + five AOs ≈ $20,633 at default sizing). If a hard exchange-side stop is required, configure it on the bot directly.
Match Sizing to Your Bot: The avg-entry and PnL display becomes meaningful only when the indicator's base/AO sizing matches your real DCA Bot configuration.
Cross Detection Granularity: Base, safety-order, and take-profit events are evaluated on bar close. A bar that spikes through a level and returns within the same bar may be missed by design — this matches realistic polling behavior and avoids over-signaling on intra-bar wicks.
Live vs Historical State: The virtual position is rebuilt from chart history each time the indicator is recompiled. If the indicator is added mid-deployment or the live bot diverges from the signal stream (manual interventions, partial fills), the indicator state may not match the live bot. Toggle the indicator off and on to reset.
Backtesting Note: This is an indicator, not a strategy. There is no built-in P&L tester — but the live realized-PnL counter in the status table gives a running approximation. For full metrics over the reference ~30-month sample (75 closed trades, 76.00% win rate, 1.00% max drawdown, profit factor 13.058, +3.45% net return over January 1, 2024 – June 29, 2026), use the companion strategy version on identical parameters. Note the 75-trade sample is below the ~100-trade floor for statistical confidence — treat those metrics, including the high profit factor, as indicative.
🔷 How to Use It:
🔸 Add the indicator to a 4h XRP / USDT chart.
🔸 Confirm the RSI level (28), the five AO deviations and sizes, and the take-profit percentage match your bot's configuration. Match the base/AO sizing so the avg-entry and PnL display stays meaningful.
🔸 In the DCA Bot Webhook group, paste the Bot ID, Email Token, and Pair (QUOTE_BASE format, e.g., USDT_XRP).
🔸 Create an alert on the indicator with "Any alert() function call". Paste the DCA Bot's webhook URL into the alert's Webhook field. The base order, each safety order, and the close will each emit a dedicated JSON payload formatted for direct DCA Bot consumption.
🔷 INDICATOR SETTINGS
Base Order Size: Virtual capital committed on the first (base) entry.
AO Deviations: Fixed percentage distances from the base entry where each safety order fires.
AO Sizes: Virtual capital per safety order (1.8× scaling by default).
RSI Timeframe / Length / Level: Oversold filter for the base entry (default 4h, 14, below 28).
Take Profit (%): Distance above average entry where the full position closes.
DCA Bot Webhook: Bot ID, Email Token, and Pair fields injected into every alert payload.
Visualization: Toggle the AO ladder, fill labels, avg/TP lines, and status table (shows status, AOs filled, base/avg entry, TP target, deployed capital, open PnL, RSI, and cumulative realized PnL).
Brand Watermark: Configurable text, position, size, and transparency.
👨🏻💻💭 We hope this tool helps enhance your trading. Your feedback is invaluable, so feel free to share any suggestions for improvements or new features you'd like to see implemented.
__
The information and publications within the 3Commas TradingView account are not meant to be and do not constitute financial, investment, trading, or other types of advice or recommendations supplied or endorsed by 3Commas and any of the parties acting on behalf of 3Commas, including its employees, contractors, ambassadors, etc. Wskaźnik

XRP RSI Strategy [3Commas]XRP RSI Strategy
🔷 What it does:
This is a long-only DCA (Dollar-Cost Averaging) strategy for XRP / USDT that opens a position only in deep-oversold conditions and then averages down on a fixed safety-order ladder. A base order fires when 4h RSI(14) drops below 28; if price keeps falling, five averaging orders add to the position at fixed deviations from the base entry, each larger than the last. The full position is closed at a fixed take-profit above the blended average entry. There is no trailing exit and no stop loss — the position is structurally bounded by the five-order ladder.
- Single entry filter: 4h RSI(14) below 28 (deep oversold).
- Five averaging orders at fixed deviations (−2%, −5%, −9.5%, −16%, −25%) with 1.8× size scaling per rung.
- Fixed take-profit on the blended average entry; no trailing, no stop loss.
- Every fill and close emits a webhook-ready JSON alert payload for a DCA Bot.
🔷 Who is it for:
- Swing traders accumulating XRP on deep RSI flushes rather than chasing momentum.
- Bot operators who want a chart-driven signal source with base / safety-order / close webhook JSON ready to drive a DCA Bot.
- Traders comfortable with martingale-style averaging who size their capital to the worst-case ladder fill.
- Range / mean-reversion traders who prefer mechanical oversold entries over discretionary timing.
🔷 How does it work:
Entry (Base Order): On each closed 4h bar the strategy reads RSI(14). When RSI falls below 28 and there is no open position, it opens the base order at market (or limit, optionally) and dispatches the entry webhook.
Averaging Orders: Once in a position, the strategy watches price relative to the original base entry. The five safety orders are armed at fixed deviations from that base entry — not cumulatively — at −2%, −5%, −9.5%, −16%, and −25%. As each threshold is crossed on bar close, the corresponding averaging order fires. Order sizes scale 1.8× per rung ($900 → $1,620 → $2,916 → $5,249 → $9,448 from a $500 base), pulling the blended average entry down toward the latest fill.
Exit (Take Profit): While in a position, the strategy computes a take-profit price a fixed percentage above the current average entry. When price closes at or above that level, the entire position is closed at market and the close webhook fires. There is no trailing and no stop loss.
Capital Bounds: Total deployed capital cannot exceed the base order plus the five safety orders. Once all five averaging orders are filled, no further adds occur — the position simply waits for the take-profit. This ladder cap is the strategy's primary risk control.
🔷 Why it's unique:
- Deep-Oversold-Only Entries: A single, strict RSI(14) < 28 filter on 4h keeps the strategy out of the market in normal conditions and only commits capital after a meaningful flush.
- Fixed-Deviation Martingale Ladder: Safety orders are placed at fixed percentages from the base entry with deliberate 1.8× size scaling, so each rung has progressively more influence on the average — a transparent, fully-specified averaging schedule rather than an opaque adaptive grid.
- Full Webhook Chain: Base order, each safety order, and the close all emit dedicated JSON payloads. The strategy can drive a 3Commas DCA Bot end-to-end with no glue layer.
- On-Chart Transparency: The AO ladder, average entry, and take-profit target are plotted live, and the status table reports RSI, AOs filled, base/average entry, TP target, and max deployable capital — so the position state is always visible.
🔷 Considerations Before Using the Strategy:
Martingale Tail Risk: Order sizes scale 1.8× per rung, so the deepest fills are by far the largest. If XRP trends hard below the −25% AO5 level without recovering to take-profit, the position sits fully loaded with no further adds and no stop — unrealized loss can grow until price reverts. The 1.8× scaling amplifies both the recovery speed and the downside.
No Stop Loss Justification: There is no exit on adverse moves. Per-order risk is bounded by the fixed ladder allocation; aggregate exposure is capped at base + five AOs (≈ $20,633 on the default $100k account, ~20.6% of equity). Size the base/AO inputs down to match the worst-case exposure you are willing to hold.
Trade Volume — Below the Statistical Floor: The reference backtest produced 75 closed trades over ~30 months. This is below the ~100-trade threshold often used as a floor for statistical relevance, so treat the win rate and the high profit factor as indicative rather than conclusive. The strict RSI < 28 filter is what keeps the trade count low.
Capital Deployment & Drawdown: The reference backtest reached a 1.00% maximum equity drawdown at default sizing — but that depends on the configured ladder fitting within XRP's observed swings. A deeper or more prolonged decline than the test sample would produce a larger drawdown.
Fees: The default commission (0.06% per trade) should be matched to your exchange's actual taker fees. With a fixed 3% take-profit the per-trade edge is modest, so a fee mismatch matters.
Demo Testing: Always demo-test before going live. Past results do not guarantee future performance, particularly for martingale-style averaging strategies whose risk profile is dominated by rare deep drawdowns.
🔷 STRATEGY PROPERTIES
Symbol: BYBIT:XRPUSDT.P (Perpetual) — strategy is portable to any XRP / USDT pair.
Timeframe: 4H (RSI sampled on 4h).
Test Period: January 1, 2024 — June 29, 2026 (~30 months).
Initial Capital: 100,000 USDT.
Base Order Size: 500 USDT.
Averaging Orders: 5, at −2% / −5% / −9.5% / −16% / −25% from base entry.
AO Sizing: 1.8× per rung — 900 / 1,620 / 2,916 / 5,249 / 9,448 USDT.
Max Deployed Capital: ≈ 20,633 USDT (~20.6% of equity, all AOs filled).
Commission: 0.06% per trade.
Slippage: 3 ticks.
Entry Filter: 4h RSI(14) below 28.
Take Profit: 3% above average entry.
Stop Loss: None — ladder allocation is the structural risk cap.
Trailing: None.
Strategy: Long Only.
🔷 STRATEGY RESULTS
⚠️ Remember, past results do not guarantee future performance.
Net Profit: +3,450.27 USDT (+3.45%)
Max Equity Drawdown: 1,010.83 USDT (1.00%)
Total Closed Trades: 75
Percent Profitable: 76.00% (57 / 75)
Profit Factor: 13.058
🔷 How to Use It:
🔸 Adjust Settings: Open the strategy inputs and confirm the RSI level (28), the five AO deviations and sizes, and the take-profit percentage match your risk profile. Scale the base/AO sizes down for lower exposure.
🔸 Results Review: Run a full-period backtest and confirm Max Drawdown stays within your personal risk band — note this configuration reached just 1.00%. Keep in mind the 75-trade sample is below the ~100-trade floor for statistical confidence, and the 13.058 profit factor reflects that small, favorable sample.
🔸 Create alerts to trigger the DCA Bot: Add one alert on the strategy using "Any alert() function call". Paste your DCA Bot's webhook URL into the alert's Webhook field, and fill the Bot ID, Email Token, and Pair inputs on the script. The base order, each safety order, and the close will each emit a dedicated JSON payload.
🔷 INDICATOR SETTINGS
Base Order Size: Capital committed on the first (base) entry.
AO Deviations: Fixed percentage distances from the base entry where each safety order fires.
AO Sizes: Capital per safety order (1.8× scaling by default).
RSI Timeframe / Length / Level: Oversold filter for the base entry (default 4h, 14, below 28).
Take Profit (%): Distance above average entry where the full position closes.
Bot ID / Email Token / Pair: Webhook fields injected into every alert payload.
Visualization: Toggle the AO ladder, fill labels, avg/TP lines, and status table.
Brand Watermark: Configurable text, position, size, and transparency.
👨🏻💻💭 We hope this tool helps enhance your trading. Your feedback is invaluable, so feel free to share any suggestions for improvements or new features you'd like to see implemented.
__
The information and publications within the 3Commas TradingView account are not meant to be and do not constitute financial, investment, trading, or other types of advice or recommendations supplied or endorsed by 3Commas and any of the parties acting on behalf of 3Commas, including its employees, contractors, ambassadors, etc. Strategia

Wskaźnik

Ultimate RSIHere is a breakdown of its core features and how they work together:
1. Volatility-Adaptive RSI Length
How it works: Instead of using a static length (like the traditional 14-period RSI), the script calculates the market's standard deviation (volatility).
The Benefit: When the market is highly volatile, the RSI length dynamically shortens, making the indicator more responsive so you can catch quick reversals. When volatility drops (consolidation), the length expands, smoothing the RSI line to filter out "chop" and false signals.
2. Dynamic Overbought / Oversold Zones (Bollinger Bands)
How it works: Standard RSIs use static horizontal lines at 70 and 30. This script applies Bollinger Bands directly to the RSI values themselves.
The Benefit: A reading of 70 isn't always overbought in a strong trend. By wrapping the RSI in a standard deviation channel, you get a dynamic zone. If the RSI breaks above its upper dynamic band, you know momentum is genuinely extreme relative to recent conditions, rather than a fixed arbitrary number.
3. Automated Divergence Detection
How it works: The script constantly scans for discrepancies between price action and RSI momentum.
The Benefit: It automatically plots visual markers on the RSI pane when it detects:
Regular Divergences (Reversals): E.g., Price makes a Lower Low, but RSI makes a Higher Low (Bullish Divergence).
Hidden Divergences (Trend Continuations): E.g., Price makes a Higher Low, but RSI drops to a Lower Low (Hidden Bullish).
4. RSI Moving Average (Signal Line)
How it works: An additional moving average (you can choose between SMA, EMA, RMA, WMA, or HMA) is plotted alongside the RSI.
The Benefit: This acts as a trigger line. An RSI crossing above its EMA can be used as an early entry signal, or as confirmation that momentum has definitively shifted.
5. Multi-Timeframe (MTF) Support
How it works: You can configure the indicator to calculate RSI based on a higher timeframe (e.g., pulling 4-Hour RSI data while you are looking at a 15-minute chart).
The Benefit: This ensures your lower timeframe entries are always aligned with the macro momentum, preventing you from trading against the larger trend.
6. Visual Confluence & Alerts
The RSI line itself is color-coded. For example, it turns bright green when momentum is both above 50 and rising, and dark red when below 50 and falling.
It includes a full suite of alert conditions (divergences and MA crossovers) so you can automate your trading or get pinged when a setup occurs.
In summary, it's designed to replace 3 or 4 different indicators on your chart by giving you adaptive momentum, dynamic exhaustion zones, trend direction, and divergence signals all natively in one branded, professional package. Wskaźnik

VWAP + RSI ConfluenceThis indicator merges VWAP and RSI into one clean visual system by coloring candles based on their agreement.
Green candles → Bullish confluence: Price is above VWAP and RSI is above the midline (default 50).
Red candles → Bearish confluence: Price is below VWAP and RSI is below the midline.
White candles (Hold) → Conflict between VWAP and RSI. The market is undecided — best to stay out and avoid choppy, low-quality setups.
The white “Hold” candles act as a powerful filter that helps you avoid trading when the two indicators disagree.
How to Use
Trade in the direction of the colored candles (green = long bias, red = short bias).
Avoid trading during white “Hold” candles.
Best used at key support/resistance levels or in combination with your existing price action or structure.
Works on all timeframes and instruments.
Important Setup Step (Required for Reliable Colors)
For the custom candle colors to display correctly even when the indicator is not selected, you must do the following once:
Add the indicator to your chart.
Right-click anywhere on the chart.
Select Object Tree.
Right-click on VWAP + RSI Confluence.
Go to Visual Order → Bring to front.
After this step, the colors will remain stable. It is recommended to save your chart as a template afterward so you don’t have to repeat this process.
Settings
VWAP Anchor: Choose between Day, Week, Month, or Year (resets the VWAP calculation accordingly).
RSI Length: Default is 21 (adjustable).
RSI Midline: Default is 50.0 (the threshold for bullish/bearish agreement).
Colors: Fully customizable colors for Bullish candles, Bearish candles, Hold candles, and their wicks.
Recommended Use
This indicator is especially useful for day trading and swing trading when you want a clear visual filter that reduces conflicting signals between momentum (RSI) and institutional average price (VWAP). Wskaźnik

RSI Volume-Validated Overbought/OversoldRSI Volume-Validated Overbought/Oversold
OVERVIEW
This indicator combines a standard RSI with a volume validation layer. The core idea: an RSI reading in overbought or oversold territory does not by itself guarantee that price will decelerate or reverse — the move often needs participation (volume) behind it to be meaningful. This script accumulates volume while price sits inside an overbought or oversold RSI zone and only flags the episode once that accumulated volume reaches a defined threshold, distinguishing zones with real participation from zones with weak, low-volume RSI extremes that are more likely to be ignored by price.
WHAT IT IS MADE OF
1. RSI Engine
A standard RSI (configurable length and source) checked against two configurable levels: an overbought level (default 70) and an oversold level (default 30).
2. Volume Accumulator
From the moment RSI enters an overbought or oversold zone, the indicator starts summing the volume of every bar for as long as RSI remains inside that zone. This running total resets to zero each time a new zone episode begins (i.e., each fresh entry into overbought or oversold after having been outside it).
3. Volume Threshold
A simple moving average of volume (default length 20) multiplied by a user-defined factor (default 8) forms the validation threshold. This threshold is recalculated on every bar using current volume conditions.
4. Validation Logic
The indicator continuously compares the accumulated zone volume against the threshold. The first bar where the accumulated volume reaches or exceeds the threshold — while RSI is still inside the zone — triggers the signal for that episode. Only one signal can fire per zone episode; once triggered, the indicator will not signal again until RSI exits the zone and re-enters it later.
WHAT IT SIGNALS AND HOW
- A green upward triangle below the bar marks a validated oversold episode (accumulated volume met the threshold while RSI was oversold).
- A red downward triangle above the bar marks a validated overbought episode (accumulated volume met the threshold while RSI was overbought).
- A label is plotted at the signal bar showing the exact accumulated volume figure for that episode, so the reader can see how much participation triggered the validation.
- RSI readings that reach overbought/oversold but never accumulate enough volume before exiting the zone produce no signal at all. These "weak" episodes are intentionally left unmarked.
HOW TO INTERPRET IT
A signal does not mean "buy here" or "sell here." It means: at this point, price has been overbought/oversold for long enough, with enough volume behind that condition, that the RSI extreme is more likely to carry real weight. Historically, this tends to coincide with one of three outcomes:
- Price decelerates and reverses direction.
- Price decelerates and consolidates/pauses before continuing.
- Price continues in the same direction, but at a reduced pace.
The signal is a condition-strength marker, not a directional entry trigger.
HOW TO USE IT
Use this indicator as a filter or confirmation layer on top of your own analysis — for example, alongside support/resistance, structure, or other timing tools — to judge whether a given overbought/oversold reading is likely to matter. It is best suited as a heads-up that momentum may be about to change character, not as a standalone trigger for opening positions.
LIMITATIONS
- This indicator does NOT generate buy/sell entries. It only flags when a volume-validated overbought/oversold condition occurs. Any trading decision based on it requires additional confirmation and risk management from the user.
- It does not predict the magnitude or exact timing of a reversal or deceleration — only that the condition has met a volume-based validation threshold.
- The volume SMA and threshold factor are fully adjustable; results will vary significantly by asset, timeframe, and the chosen factor. Defaults shown here (SMA length 20, factor 8) were tuned through visual backtesting and may need re-calibration for other instruments or timeframes.
- On instruments or data feeds where volume data is unavailable or unreliable (e.g., some spot forex feeds), the volume accumulation and threshold comparison will not function as intended.
- This script does not repaint: each signal is generated and locked in on the bar where the volume threshold is met and does not change on historical bars after that point. Wskaźnik

ETH RSI Indicator [3Commas]ETH RSI Indicator
🔷 What it does:
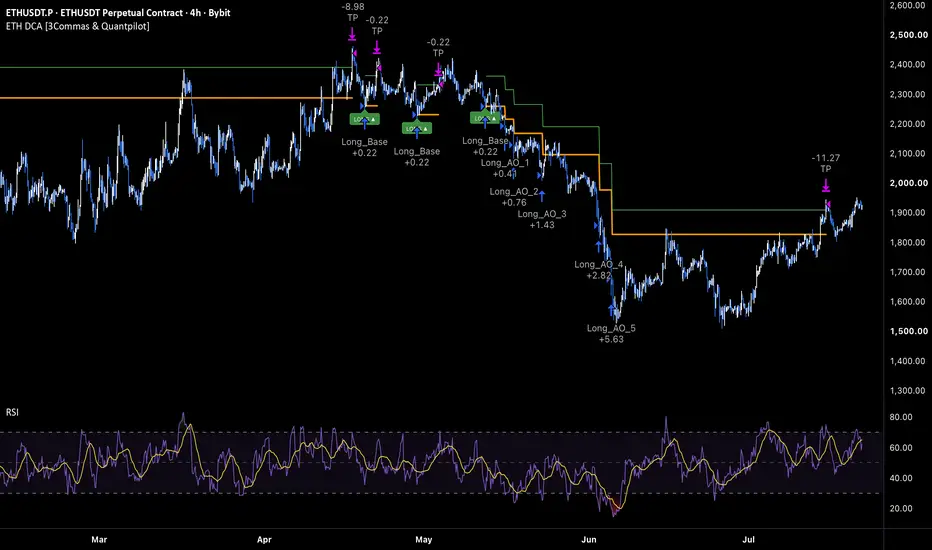
This is a signal-only indicator that mirrors a long-only DCA workflow on ETH / USDT. It tracks a single virtual position: a base entry opens when 4h RSI(14) drops below 28; if price keeps falling, five averaging orders add to the virtual position at fixed deviations from the base entry, each larger than the last; the position is then closed at a fixed take-profit above the blended average entry. The indicator computes running average entry, deployed capital, open PnL, and lifetime realized PnL from honest fill-by-fill bookkeeping, and emits a webhook-ready JSON alert payload on the base order, every safety order, and the close.
- Single entry filter: 4h RSI(14) below 28 (deep oversold).
- Five averaging orders at fixed deviations (−2%, −5%, −9.5%, −16%, −25%) with 1.8× size scaling per rung.
- Fixed take-profit on the blended average entry; no trailing, no stop loss.
- Honest virtual bookkeeping: avg entry, deployed capital, Open PnL, and cumulative realized PnL displayed live on the chart.
🔷 Who is it for:
- Swing traders accumulating ETH on deep RSI flushes who want a chart-driven signal source.
- Bot operators who want base / safety-order / close webhook JSON ready to drive a DCA Bot.
- Traders comfortable with martingale-style averaging who size their capital to the worst-case ladder fill.
- Traders who want strategy-tester-equivalent insight (live realized / unrealized PnL) without running a backtest engine.
🔷 How does it work:
Base Entry: On each closed 4h bar the indicator reads RSI(14). When RSI falls below 28 and there is no open virtual position, it marks a virtual base order at the close price and dispatches the entry webhook.
Averaging Orders: Once in a virtual position, the indicator watches price relative to the original base entry. The five safety orders are armed at fixed deviations from that base entry — not cumulatively — at −2%, −5%, −9.5%, −16%, and −25%. As each threshold is crossed on bar close, the corresponding safety order is recorded and its webhook fires. Order sizes scale 1.8× per rung ($900 → $1,620 → $2,916 → $5,249 → $9,448 from a $500 base), pulling the blended average entry down toward the latest fill.
Honest Virtual Bookkeeping: Total cost and qty are updated incrementally on every event, so the avg entry, deployed capital, and Open PnL displayed in the status table reflect the actual broker-equivalent position state — no shortcut, no synthetic averaging.
Take Profit & Lifetime PnL: When price closes at or above the take-profit level (a fixed percentage above the average entry), the virtual position is closed, its round-trip profit is added to a persistent realized-PnL counter, and the close webhook fires. The status table displays both Open PnL (current unrealized state) and cumulative realized PnL, so live performance is visible directly on the chart.
Capital Bounds: Total virtual deployed capital cannot exceed the base order plus the five safety orders. Once all five are filled, no further adds occur — the position simply waits for the take-profit.
🔷 Why it's unique:
- Deep-Oversold-Only Entries: A single, strict RSI(14) < 28 filter on 4h keeps the signal quiet in normal conditions and only fires after a meaningful flush.
- Fixed-Deviation Martingale Ladder: Safety orders are placed at fixed percentages from the base entry with deliberate 1.8× size scaling — a transparent, fully-specified averaging schedule rather than an opaque adaptive grid.
- Full Webhook Chain: Base order, each safety order, and the close all emit dedicated JSON payloads. One TradingView alert with "Any alert() function call" drives a 3Commas DCA Bot end-to-end.
- Live PnL Tracking: Open PnL and cumulative realized PnL are displayed live on the chart — the indicator gives strategy-tester-equivalent insight without running a backtest.
🔷 Considerations Before Using the Indicator:
Martingale Tail Risk: Order sizes scale 1.8× per rung, so the deepest fills are by far the largest. If ETH trends hard below the −25% AO5 level without recovering to take-profit, the virtual position sits fully loaded with no further adds and no stop — Open PnL can grow deeply negative until price reverts.
No Stop Loss: There is no exit signal on adverse moves. Risk is bounded only by the fixed ladder allocation (base + five AOs ≈ $20,633 at default sizing). If a hard exchange-side stop is required, configure it on the bot directly.
Match Sizing to Your Bot: The avg-entry and PnL display becomes meaningful only when the indicator's base/AO sizing matches your real DCA Bot configuration.
Cross Detection Granularity: Base, safety-order, and take-profit events are evaluated on bar close. A bar that spikes through a level and returns within the same bar may be missed by design — this matches realistic polling behavior and avoids over-signaling on intra-bar wicks.
Live vs Historical State: The virtual position is rebuilt from chart history each time the indicator is recompiled. If the indicator is added mid-deployment or the live bot diverges from the signal stream (manual interventions, partial fills), the indicator state may not match the live bot. Toggle the indicator off and on to reset.
Backtesting Note: This is an indicator, not a strategy. There is no built-in P&L tester — but the live realized-PnL counter in the status table gives a running approximation. For full metrics over the reference ~30-month sample (93 closed trades, 68.82% win rate, 3.83% max drawdown, profit factor 5.019, +5.79% net return over January 1, 2024 – June 28, 2026), use the companion strategy version on identical parameters. Note the 93-trade sample is just below the ~100-trade floor for statistical confidence — treat those metrics as indicative.
🔷 How to Use It:
🔸 Add the indicator to a 4h ETH / USDT chart.
🔸 Confirm the RSI level (28), the five AO deviations and sizes, and the take-profit percentage match your bot's configuration. Match the base/AO sizing so the avg-entry and PnL display stays meaningful.
🔸 In the DCA Bot Webhook group, paste the Bot ID, Email Token, and Pair (QUOTE_BASE format, e.g., USDT_ETH).
🔸 Create an alert on the indicator with "Any alert() function call". Paste the DCA Bot's webhook URL into the alert's Webhook field. The base order, each safety order, and the close will each emit a dedicated JSON payload formatted for direct DCA Bot consumption.
🔷 INDICATOR SETTINGS
Base Order Size: Virtual capital committed on the first (base) entry.
AO Deviations: Fixed percentage distances from the base entry where each safety order fires.
AO Sizes: Virtual capital per safety order (1.8× scaling by default).
RSI Timeframe / Length / Level: Oversold filter for the base entry (default 4h, 14, below 28).
Take Profit (%): Distance above average entry where the full position closes.
DCA Bot Webhook: Bot ID, Email Token, and Pair fields injected into every alert payload.
Visualization: Toggle the AO ladder, fill labels, avg/TP lines, and status table (shows status, AOs filled, base/avg entry, TP target, deployed capital, open PnL, RSI, and cumulative realized PnL).
Brand Watermark: Configurable text, position, size, and transparency.
👨🏻💻💭 We hope this tool helps enhance your trading. Your feedback is invaluable, so feel free to share any suggestions for improvements or new features you'd like to see implemented.
__
The information and publications within the 3Commas TradingView account are not meant to be and do not constitute financial, investment, trading, or other types of advice or recommendations supplied or endorsed by 3Commas and any of the parties acting on behalf of 3Commas, including its employees, contractors, ambassadors, etc. Wskaźnik

ETH RSI Strategy [3Commas]ETH RSI Strategy
🔷 What it does:
This is a long-only DCA (Dollar-Cost Averaging) strategy for ETH / USDT that opens a position only in deep-oversold conditions and then averages down on a fixed safety-order ladder. A base order fires when 4h RSI(14) drops below 28; if price keeps falling, five averaging orders add to the position at fixed deviations from the base entry, each larger than the last. The full position is closed at a fixed take-profit above the blended average entry. There is no trailing exit and no stop loss — the position is structurally bounded by the five-order ladder.
- Single entry filter: 4h RSI(14) below 28 (deep oversold).
- Five averaging orders at fixed deviations (−2%, −5%, −9.5%, −16%, −25%) with 1.8× size scaling per rung.
- Fixed take-profit on the blended average entry; no trailing, no stop loss.
- Every fill and close emits a webhook-ready JSON alert payload for a DCA Bot.
🔷 Who is it for:
- Swing traders accumulating ETH on deep RSI flushes rather than chasing momentum.
- Bot operators who want a chart-driven signal source with base / safety-order / close webhook JSON ready to drive a DCA Bot.
- Traders comfortable with martingale-style averaging who size their capital to the worst-case ladder fill.
- Range / mean-reversion traders who prefer mechanical oversold entries over discretionary timing.
🔷 How does it work:
Entry (Base Order): On each closed 4h bar the strategy reads RSI(14). When RSI falls below 28 and there is no open position, it opens the base order at market (or limit, optionally) and dispatches the entry webhook.
Averaging Orders: Once in a position, the strategy watches price relative to the original base entry. The five safety orders are armed at fixed deviations from that base entry — not cumulatively — at −2%, −5%, −9.5%, −16%, and −25%. As each threshold is crossed on bar close, the corresponding averaging order fires. Order sizes scale 1.8× per rung ($900 → $1,620 → $2,916 → $5,249 → $9,448 from a $500 base), pulling the blended average entry down toward the latest fill.
Exit (Take Profit): While in a position, the strategy computes a take-profit price a fixed percentage above the current average entry. When price closes at or above that level, the entire position is closed at market and the close webhook fires. There is no trailing and no stop loss.
Capital Bounds: Total deployed capital cannot exceed the base order plus the five safety orders. Once all five averaging orders are filled, no further adds occur — the position simply waits for the take-profit. This ladder cap is the strategy's primary risk control.
🔷 Why it's unique:
- Deep-Oversold-Only Entries: A single, strict RSI(14) < 28 filter on 4h keeps the strategy out of the market in normal conditions and only commits capital after a meaningful flush.
- Fixed-Deviation Martingale Ladder: Safety orders are placed at fixed percentages from the base entry with deliberate 1.8× size scaling, so each rung has progressively more influence on the average — a transparent, fully-specified averaging schedule rather than an opaque adaptive grid.
- Full Webhook Chain: Base order, each safety order, and the close all emit dedicated JSON payloads. The strategy can drive a 3Commas DCA Bot end-to-end with no glue layer.
- On-Chart Transparency: The AO ladder, average entry, and take-profit target are plotted live, and the status table reports RSI, AOs filled, base/average entry, TP target, and max deployable capital — so the position state is always visible.
🔷 Considerations Before Using the Strategy:
Trade Volume — Below the Statistical Floor: The reference backtest produced 93 closed trades over ~30 months. This is just below the ~100-trade threshold often used as a floor for statistical relevance, so treat the win rate and profit factor as indicative rather than conclusive. The strict RSI < 28 filter is what keeps the trade count low.
Martingale Tail Risk: Order sizes scale 1.8× per rung, so the deepest fills are by far the largest. If ETH trends hard below the −25% AO5 level without recovering to take-profit, the position sits fully loaded with no further adds and no stop — unrealized loss can grow until price reverts. The 1.8× scaling amplifies both the recovery speed and the downside.
No Stop Loss Justification: There is no exit on adverse moves. Per-order risk is bounded by the fixed ladder allocation; aggregate exposure is capped at base + five AOs (≈ $20,633 on the default $100k account, ~20.6% of equity). Size the base/AO inputs down to match the worst-case exposure you are willing to hold.
Capital Deployment & Drawdown: The reference backtest reached a 3.83% maximum equity drawdown at default sizing — but that depends on the configured ladder fitting within ETH's observed swings. A deeper or more prolonged decline than the test sample would produce a larger drawdown.
Fees: The default commission (0.06% per trade) should be matched to your exchange's actual taker fees. With a fixed 3% take-profit the per-trade edge is modest, so a fee mismatch matters.
Demo Testing: Always demo-test before going live. Past results do not guarantee future performance, particularly for martingale-style averaging strategies whose risk profile is dominated by rare deep drawdowns.
🔷 STRATEGY PROPERTIES
Symbol: BYBIT:ETHUSDT.P (Perpetual) — strategy is portable to any ETH / USDT pair.
Timeframe: 4H (RSI sampled on 4h).
Test Period: January 1, 2024 — June 28, 2026 (~30 months).
Initial Capital: 100,000 USDT.
Base Order Size: 500 USDT.
Averaging Orders: 5, at −2% / −5% / −9.5% / −16% / −25% from base entry.
AO Sizing: 1.8× per rung — 900 / 1,620 / 2,916 / 5,249 / 9,448 USDT.
Max Deployed Capital: ≈ 20,633 USDT (~20.6% of equity, all AOs filled).
Commission: 0.06% per trade.
Slippage: 3 ticks.
Entry Filter: 4h RSI(14) below 28.
Take Profit: 3% above average entry.
Stop Loss: None — ladder allocation is the structural risk cap.
Trailing: None.
Strategy: Long Only.
🔷 STRATEGY RESULTS
⚠️ Remember, past results do not guarantee future performance.
Net Profit: +5,790.33 USDT (+5.79%)
Max Equity Drawdown: 3,976.44 USDT (3.83%)
Total Closed Trades: 93
Percent Profitable: 68.82% (64 / 93)
Profit Factor: 5.019
🔷 How to Use It:
🔸 Adjust Settings: Open the strategy inputs and confirm the RSI level (28), the five AO deviations and sizes, and the take-profit percentage match your risk profile. Scale the base/AO sizes down for lower exposure.
🔸 Results Review: Run a full-period backtest and confirm Max Drawdown stays within your personal risk band — note this configuration reached 3.83%. Keep in mind the 93-trade sample is just below the ~100-trade floor for statistical confidence.
🔸 Create alerts to trigger the DCA Bot: Add one alert on the strategy using "Any alert() function call". Paste your DCA Bot's webhook URL into the alert's Webhook field, and fill the Bot ID, Email Token, and Pair inputs on the script. The base order, each safety order, and the close will each emit a dedicated JSON payload.
🔷 INDICATOR SETTINGS
Base Order Size: Capital committed on the first (base) entry.
AO Deviations: Fixed percentage distances from the base entry where each safety order fires.
AO Sizes: Capital per safety order (1.8× scaling by default).
RSI Timeframe / Length / Level: Oversold filter for the base entry (default 4h, 14, below 28).
Take Profit (%): Distance above average entry where the full position closes.
Bot ID / Email Token / Pair: Webhook fields injected into every alert payload.
Visualization: Toggle the AO ladder, fill labels, avg/TP lines, and status table.
Brand Watermark: Configurable text, position, size, and transparency.
👨🏻💻💭 We hope this tool helps enhance your trading. Your feedback is invaluable, so feel free to share any suggestions for improvements or new features you'd like to see implemented.
__
The information and publications within the 3Commas TradingView account are not meant to be and do not constitute financial, investment, trading, or other types of advice or recommendations supplied or endorsed by 3Commas and any of the parties acting on behalf of 3Commas, including its employees, contractors, ambassadors, etc. Strategia

Macd and RSI % Change Signals MTF MACD & RSI % Change Signals + MTF Open Confirmation
Advanced momentum indicator combining Logarithmic RSI % Change, modified MACD, and Multi-Timeframe Open Price Confirmation.
This indicator detects high-probability entries by filtering custom MACD and RSI-based signals with strict multi-timeframe price action confirmation.
How It Works
1. Dual Signal Engine
Logarithmic RSI % Change System:
Uses RSI calculated on logarithmic scale (high, low, close) to generate more sensitive momentum signals.
Multiple bullish and bearish crossover levels (C20, C10, L20 for longs / L20, C20, C10 for shorts).
Modified MACD System:
Special MACD built with RSI applied to the oscillator for smoother and more responsive signals.
Multiple threshold levels (M2, M3, M4, M5) for both long and short entries.
2. MTF Open Price Confirmation (Core Filter)
Checks current price against the opening price of 4 customizable timeframes (default: 5m, 15m, 60m, 240m).
Long Signal is only valid if price is above the open on all selected timeframes.
Short Signal is only valid if price is below the open on all selected timeframes.
This powerful filter ensures you only trade in the direction of the current multi-timeframe bias.
3. Visual Elements
Clear triangle signals with labels (C20L, M5S, etc.) for easy identification.
Pullback Levels: Automatically plots the most recent confirmed signal’s high/low as dynamic support/resistance.
Live MTF Status Table: Shows current Open prices of all timeframes and overall market bias (LONG / SHORT / NEUTRAL).
Key Features
Log RSI % Change signals (highly responsive)
Modified MACD with multiple confirmation levels
Strict 4-Timeframe Open Price Confirmation Filter
Pullback level plotting for better risk management
Real-time MTF Open Status Panel
Fully customizable timeframes
Multiple alert conditions
Best Used For
Intraday & Scalping on lower timeframes (5m, 15m)
Swing Trading on 1H and 4H charts
Filtering false MACD/RSI signals in choppy markets
Trading with the dominant multi-timeframe momentum
This system significantly reduces whipsaws by combining powerful momentum oscillators with a strict higher-timeframe open price alignment filter. Wskaźnik

Divergence Strength Analyzer-John HaydenHayden Momentum Regimes & Time-Decay Divergence Analyzer
Overview:
Most retail traders treat the Relative Strength Index (RSI) as a basic overbought/oversold oscillator—shorting above 70 and buying below 30. In *"RSI: The Complete Guide," John Hayden* completely flips this flawed conventional wisdom on its head. Hayden demonstrates that extreme RSI levels actually represent high-velocity structural momentum expansions rather than impending reversals.
This open-source Pine Script tool here maps Hayden's proprietary market regimes, isolates institutional *Hidden and Normal Divergences, and introduces a strict **Time-Decay Strength Matrix* to filter out low-velocity market noise.
Core Mechanics
1. The High-Velocity Regime Speedometer
Instead of looking for immediate trend reversals when the RSI enters extreme territories, this indicator uses these levels to categorize the macro trend structure:
*The Bull Market Regime (40/80 Range):* Initiated when the RSI breaks out above 70. Once confirmed, the RSI establishes a firm support floor around the *40* line during pullbacks, indicating heavy institutional backing.
*The Bear Market Regime (20/60 Range):* Initiated when the RSI drops below 30. Relief rallies consistently stall out and find a ceiling around the *60* line, proving persistent distribution.
2. The Power of Hayden's Hidden Divergence
While normal divergence frequently acts as a near-term counter-trend trap, Hayden highlights *Hidden Divergence* as the ultimate trend-continuation footprint.
* In a confirmed bullish regime, the price prints a structurally higher low while the RSI registers a deeply oversold lower low. This discrepancy indicates that while emotional momentum has fully cooled off, structural buying pressure remains completely intact, creating a coiled spring ready to unleash the next "superfast" leg up.
3. The Time-Decay Strength Matrix (%)
A primary reason traders fail with standard divergence indicators is that they fail to account for the element of time. Hayden explicitly teaches that the validity of a momentum discrepancy decays the longer it takes to form.
This script mathematically calculates the precise distance between structural peaks or troughs and scores the setup using Hayden’s time-based parameters:
* 🚀 *100% Strength (Ultra Condensed):* \le 4 bars between pivots. Highly explosive immediate velocity.
* 📈 *75% Strength (Standard Strong):* 5 to 8 bars between pivots. Highly reliable trend-joiner.
* ⚖️ *50% Strength (Moderate):* 9 to 12 bars between pivots. Average momentum reliability.
* ❌ *0% Strength (Decayed/Filtered):* > 16 bars between pivots. The setup is completely ignored and filtered off your chart to prevent slow, sideways chops.
How to Trade This Script
1. *Scan the Regime Background:* Look for a faint green chart overlay to confirm you are inside a valid Hayden Bull Regime.
2. *Locate the Footprint:* Wait for the indicator to map an *MDRP Hidden Bull* or *Normal Bull* label.
3. *Verify the Strength %:* Prioritize signals showcasing *75% to 100% Strength*. This ensures you are striking right at the inflection point of structural trend acceleration.
4. *Invalidation:* If the macro RSI breaks out of its trend bounds (e.g., dropping below the 40-floor buffer in a bull market), the regime shifts to neutral, and current long-bias expectations are discarded.
Features
*Pure Price & Momentum Geometry:* Zero volume filters are utilized, making this script ideal for clean execution across both highly liquid indexes and choppy small-cap resource scripts.
*Dynamic Chart Labels:* Eliminates chart confusion by printing the exact divergence type alongside its dynamic strength rating directly on the key pivot bar.
Wskaźnik

ATOM RSI Indicator [3Commas]ATOM RSI Indicator
🔷 What it does:
This is a signal-only indicator that mirrors a long-only DCA workflow on ATOM / USDT. It tracks a single virtual position: a base entry opens when 4h RSI(14) drops below 28; if price keeps falling, five averaging orders add to the virtual position at fixed deviations from the base entry, each larger than the last; the position is then closed at a fixed take-profit above the blended average entry. The indicator computes running average entry, deployed capital, open PnL, and lifetime realized PnL from honest fill-by-fill bookkeeping, and emits a webhook-ready JSON alert payload on the base order, every safety order, and the close.
- Single entry filter: 4h RSI(14) below 28 (deep oversold).
- Five averaging orders at fixed deviations (−2%, −5%, −9.5%, −16%, −25%) with 1.8× size scaling per rung.
- Fixed take-profit on the blended average entry; no trailing, no stop loss.
- Honest virtual bookkeeping: avg entry, deployed capital, Open PnL, and cumulative realized PnL displayed live on the chart.
🔷 Who is it for:
- Swing traders accumulating ATOM on deep RSI flushes who want a chart-driven signal source.
- Bot operators who want base / safety-order / close webhook JSON ready to drive a DCA Bot.
- Traders comfortable with martingale-style averaging who size their capital to the worst-case ladder fill.
- Traders who want strategy-tester-equivalent insight (live realized / unrealized PnL) without running a backtest engine.
🔷 How does it work:
Base Entry: On each closed 4h bar the indicator reads RSI(14). When RSI falls below 28 and there is no open virtual position, it marks a virtual base order at the close price and dispatches the entry webhook.
Averaging Orders: Once in a virtual position, the indicator watches price relative to the original base entry. The five safety orders are armed at fixed deviations from that base entry — not cumulatively — at −2%, −5%, −9.5%, −16%, and −25%. As each threshold is crossed on bar close, the corresponding safety order is recorded and its webhook fires. Order sizes scale 1.8× per rung ($900 → $1,620 → $2,916 → $5,249 → $9,448 from a $500 base), pulling the blended average entry down toward the latest fill.
Honest Virtual Bookkeeping: Total cost and qty are updated incrementally on every event, so the avg entry, deployed capital, and Open PnL displayed in the status table reflect the actual broker-equivalent position state — no shortcut, no synthetic averaging.
Take Profit & Lifetime PnL: When price closes at or above the take-profit level (a fixed percentage above the average entry), the virtual position is closed, its round-trip profit is added to a persistent realized-PnL counter, and the close webhook fires. The status table displays both Open PnL (current unrealized state) and cumulative realized PnL, so live performance is visible directly on the chart.
Capital Bounds: Total virtual deployed capital cannot exceed the base order plus the five safety orders. Once all five are filled, no further adds occur — the position simply waits for the take-profit.
🔷 Why it's unique:
- Deep-Oversold-Only Entries: A single, strict RSI(14) < 28 filter on 4h keeps the signal quiet in normal conditions and only fires after a meaningful flush.
- Fixed-Deviation Martingale Ladder: Safety orders are placed at fixed percentages from the base entry with deliberate 1.8× size scaling — a transparent, fully-specified averaging schedule rather than an opaque adaptive grid.
- Full Webhook Chain: Base order, each safety order, and the close all emit dedicated JSON payloads. One TradingView alert with "Any alert() function call" drives a 3Commas DCA Bot end-to-end.
- Live PnL Tracking: Open PnL and cumulative realized PnL are displayed live on the chart — the indicator gives strategy-tester-equivalent insight without running a backtest.
🔷 Considerations Before Using the Indicator:
Martingale Tail Risk: Order sizes scale 1.8× per rung, so the deepest fills are by far the largest. If ATOM trends hard below the −25% AO5 level without recovering to take-profit, the virtual position sits fully loaded with no further adds and no stop — Open PnL can grow deeply negative until price reverts.
No Stop Loss: There is no exit signal on adverse moves. Risk is bounded only by the fixed ladder allocation (base + five AOs ≈ $20,633 at default sizing). If a hard exchange-side stop is required, configure it on the bot directly.
Match Sizing to Your Bot: The avg-entry and PnL display becomes meaningful only when the indicator's base/AO sizing matches your real DCA Bot configuration.
Cross Detection Granularity: Base, safety-order, and take-profit events are evaluated on bar close. A bar that spikes through a level and returns within the same bar may be missed by design — this matches realistic polling behavior and avoids over-signaling on intra-bar wicks.
Live vs Historical State: The virtual position is rebuilt from chart history each time the indicator is recompiled. If the indicator is added mid-deployment or the live bot diverges from the signal stream (manual interventions, partial fills), the indicator state may not match the live bot. Toggle the indicator off and on to reset.
Backtesting Note: This is an indicator, not a strategy. There is no built-in P&L tester — but the live realized-PnL counter in the status table gives a running approximation. For full metrics over the reference ~30-month sample (84 closed trades, 70.24% win rate, 4.57% max drawdown, profit factor 3.417, +4.74% net return over January 1, 2024 – June 24, 2026), use the companion strategy version on identical parameters. Note the 84-trade sample is below the ~100-trade floor for statistical confidence — treat those metrics as indicative.
🔷 How to Use It:
🔸 Add the indicator to a 4h ATOM / USDT chart.
🔸 Confirm the RSI level (28), the five AO deviations and sizes, and the take-profit percentage match your bot's configuration. Match the base/AO sizing so the avg-entry and PnL display stays meaningful.
🔸 In the DCA Bot Webhook group, paste the Bot ID, Email Token, and Pair (QUOTE_BASE format, e.g., USDT_ATOM).
🔸 Create an alert on the indicator with "Any alert() function call". Paste the DCA Bot's webhook URL into the alert's Webhook field. The base order, each safety order, and the close will each emit a dedicated JSON payload formatted for direct DCA Bot consumption.
🔷 INDICATOR SETTINGS
Base Order Size: Virtual capital committed on the first (base) entry.
AO Deviations: Fixed percentage distances from the base entry where each safety order fires.
AO Sizes: Virtual capital per safety order (1.8× scaling by default).
RSI Timeframe / Length / Level: Oversold filter for the base entry (default 4h, 14, below 28).
Take Profit (%): Distance above average entry where the full position closes.
DCA Bot Webhook: Bot ID, Email Token, and Pair fields injected into every alert payload.
Visualization: Toggle the AO ladder, fill labels, avg/TP lines, and status table (shows status, AOs filled, base/avg entry, TP target, deployed capital, open PnL, RSI, and cumulative realized PnL).
Brand Watermark: Configurable text, position, size, and transparency.
👨🏻💻💭 We hope this tool helps enhance your trading. Your feedback is invaluable, so feel free to share any suggestions for improvements or new features you'd like to see implemented.
__
The information and publications within the 3Commas TradingView account are not meant to be and do not constitute financial, investment, trading, or other types of advice or recommendations supplied or endorsed by 3Commas and any of the parties acting on behalf of 3Commas, including its employees, contractors, ambassadors, etc. Wskaźnik

ATOM RSI Strategy [3Commas]ATOM RSI Long Strategy
🔷 What it does:
This is a long-only DCA (Dollar-Cost Averaging) strategy for ATOM / USDT that opens a position only in deep-oversold conditions and then averages down on a fixed safety-order ladder. A base order fires when 4h RSI(14) drops below 28; if price keeps falling, five averaging orders add to the position at fixed deviations from the base entry, each larger than the last. The full position is closed at a fixed take-profit above the blended average entry. There is no trailing exit and no stop loss — the position is structurally bounded by the five-order ladder.
- Single entry filter: 4h RSI(14) below 28 (deep oversold).
- Five averaging orders at fixed deviations (−2%, −5%, −9.5%, −16%, −25%) with 1.8× size scaling per rung.
- Fixed take-profit on the blended average entry; no trailing, no stop loss.
- Every fill and close emits a webhook-ready JSON alert payload for a DCA Bot.
🔷 Who is it for:
- Swing traders accumulating ATOM on deep RSI flushes rather than chasing momentum.
- Bot operators who want a chart-driven signal source with base / safety-order / close webhook JSON ready to drive a DCA Bot.
- Traders comfortable with martingale-style averaging who size their capital to the worst-case ladder fill.
- Range / mean-reversion traders who prefer mechanical oversold entries over discretionary timing.
🔷 How does it work:
Entry (Base Order): On each closed 4h bar the strategy reads RSI(14). When RSI falls below 28 and there is no open position, it opens the base order at market (or limit, optionally) and dispatches the entry webhook.
Averaging Orders: Once in a position, the strategy watches price relative to the original base entry. The five safety orders are armed at fixed deviations from that base entry — not cumulatively — at −2%, −5%, −9.5%, −16%, and −25%. As each threshold is crossed on bar close, the corresponding averaging order fires. Order sizes scale 1.8× per rung ($900 → $1,620 → $2,916 → $5,249 → $9,448 from a $500 base), pulling the blended average entry down toward the latest fill.
Exit (Take Profit): While in a position, the strategy computes a take-profit price a fixed percentage above the current average entry. When price closes at or above that level, the entire position is closed at market and the close webhook fires. There is no trailing and no stop loss.
Capital Bounds: Total deployed capital cannot exceed the base order plus the five safety orders. Once all five averaging orders are filled, no further adds occur — the position simply waits for the take-profit. This ladder cap is the strategy's primary risk control.
🔷 Why it's unique:
- Deep-Oversold-Only Entries: A single, strict RSI(14) < 28 filter on 4h keeps the strategy out of the market in normal conditions and only commits capital after a meaningful flush.
- Fixed-Deviation Martingale Ladder: Safety orders are placed at fixed percentages from the base entry with deliberate 1.8× size scaling, so each rung has progressively more influence on the average — a transparent, fully-specified averaging schedule rather than an opaque adaptive grid.
- Full Webhook Chain: Base order, each safety order, and the close all emit dedicated JSON payloads. The strategy can drive a 3Commas DCA Bot end-to-end with no glue layer.
- On-Chart Transparency: The AO ladder, average entry, and take-profit target are plotted live, and the status table reports RSI, AOs filled, base/average entry, TP target, and max deployable capital — so the position state is always visible.
🔷 Considerations Before Using the Strategy:
Trade Volume — Below the Statistical Floor: The reference backtest produced 84 closed trades over ~30 months. This is below the ~100-trade threshold often used as a floor for statistical relevance, so treat the win rate and profit factor as indicative rather than conclusive. The strict RSI < 28 filter is what keeps the trade count low.
Martingale Tail Risk: Order sizes scale 1.8× per rung, so the deepest fills are by far the largest. If ATOM trends hard below the −25% AO5 level without recovering to take-profit, the position sits fully loaded with no further adds and no stop — unrealized loss can grow until price reverts. The 1.8× scaling amplifies both the recovery speed and the downside.
No Stop Loss Justification: There is no exit on adverse moves. Per-order risk is bounded by the fixed ladder allocation; aggregate exposure is capped at base + five AOs (≈ $20,633 on the default $100k account, ~20.6% of equity). Size the base/AO inputs down to match the worst-case exposure you are willing to hold.
Capital Deployment & Drawdown: The reference backtest reached a 4.57% maximum equity drawdown at default sizing — but that depends on the configured ladder fitting within ATOM's observed swings. A deeper or more prolonged decline than the test sample would produce a larger drawdown.
Fees: The default commission (0.06% per trade) should be matched to your exchange's actual taker fees. With a fixed 3% take-profit the per-trade edge is modest, so a fee mismatch matters.
Demo Testing: Always demo-test before going live. Past results do not guarantee future performance, particularly for martingale-style averaging strategies whose risk profile is dominated by rare deep drawdowns.
🔷 STRATEGY PROPERTIES
Symbol: BYBIT:ATOMUSDT.P (Perpetual) — strategy is portable to any ATOM / USDT pair.
Timeframe: 4H (RSI sampled on 4h).
Test Period: January 1, 2024 — June 24, 2026 (~30 months).
Initial Capital: 100,000 USDT.
Base Order Size: 500 USDT.
Averaging Orders: 5, at −2% / −5% / −9.5% / −16% / −25% from base entry.
AO Sizing: 1.8× per rung — 900 / 1,620 / 2,916 / 5,249 / 9,448 USDT.
Max Deployed Capital: ≈ 20,633 USDT (~20.6% of equity, all AOs filled).
Commission: 0.06% per trade.
Slippage: 3 ticks.
Entry Filter: 4h RSI(14) below 28.
Take Profit: 3% above average entry.
Stop Loss: None — ladder allocation is the structural risk cap.
Trailing: None.
Strategy: Long Only.
🔷 STRATEGY RESULTS
⚠️ Remember, past results do not guarantee future performance.
Net Profit: +4,739.50 USDT (+4.74%)
Max Equity Drawdown: 4,608.66 USDT (4.57%)
Total Closed Trades: 84
Percent Profitable: 70.24% (59 / 84)
Profit Factor: 3.417
🔷 How to Use It:
🔸 Adjust Settings: Open the strategy inputs and confirm the RSI level (28), the five AO deviations and sizes, and the take-profit percentage match your risk profile. Scale the base/AO sizes down for lower exposure.
🔸 Results Review: Run a full-period backtest and confirm Max Drawdown stays within your personal risk band — note this configuration reached 4.57%. Keep in mind the 84-trade sample is below the ~100-trade floor for statistical confidence.
🔸 Create alerts to trigger the DCA Bot: Add one alert on the strategy using "Any alert() function call". Paste your DCA Bot's webhook URL into the alert's Webhook field, and fill the Bot ID, Email Token, and Pair inputs on the script. The base order, each safety order, and the close will each emit a dedicated JSON payload.
🔷 INDICATOR SETTINGS
Base Order Size: Capital committed on the first (base) entry.
AO Deviations: Fixed percentage distances from the base entry where each safety order fires.
AO Sizes: Capital per safety order (1.8× scaling by default).
RSI Timeframe / Length / Level: Oversold filter for the base entry (default 4h, 14, below 28).
Take Profit (%): Distance above average entry where the full position closes.
Bot ID / Email Token / Pair: Webhook fields injected into every alert payload.
Visualization: Toggle the AO ladder, fill labels, avg/TP lines, and status table.
Brand Watermark: Configurable text, position, size, and transparency.
👨🏻💻💭 We hope this tool helps enhance your trading. Your feedback is invaluable, so feel free to share any suggestions for improvements or new features you'd like to see implemented.
__
The information and publications within the 3Commas TradingView account are not meant to be and do not constitute financial, investment, trading, or other types of advice or recommendations supplied or endorsed by 3Commas and any of the parties acting on behalf of 3Commas, including its employees, contractors, ambassadors, etc. Strategia

Adaptive RSI Supertrend [MarkitTick]💡 A highly advanced, multi-dimensional momentum and volatility tracking ecosystem designed for professional market analysis. Rather than relying on traditional price-based trailing stops, this indicator projects a volatility-banded Supertrend directly onto an Adaptive Relative Strength Index (ARSI). This creates an incredibly responsive momentum oscillator that dynamically adjusts its own thresholds based on underlying market kinematics. By integrating high-order digital signal processing filters, higher timeframe confirmations, and volume-weighted validation, this tool provides a comprehensive, terminal-style perspective on market regime, momentum acceleration, and localized price extremes without succumbing to the noise typical of standard oscillators.
✨ Originality and Utility
The standard Relative Strength Index is frequently plagued by false signals, erratic whipsaws during consolidation, and a failure to contextualize momentum within broader structural trends. This script resolves these systemic inefficiencies through a deliberate and mathematically sound synthesis of disparate analytical domains. The combination of an ARSI with a localized Supertrend is not an arbitrary pairing; it solves the problem of static overbought/oversold boundaries. By mapping average true range (ATR) bands onto the RSI itself, the indicator creates dynamic, breathing support and resistance levels for momentum. Furthermore, the integration of advanced smoothing algorithms (Kalman and LLAMA) strips out high-frequency noise, ensuring that crossovers between the ARSI and the Supertrend-derived Merged Line represent statistically significant momentum shifts rather than fleeting market anomalies. This unified framework replaces the need for an overlapping array of disparate indicators, offering a singular, high-contrast dashboard for absolute market clarity.
🔬 Methodology and Concepts
The internal architecture of this tool is built upon several synchronized analytical layers, heavily optimized to protect the integrity of the underlying logic while delivering seamless visual output.
● Adaptive Momentum Core
At the heart of the script is the ARSI, which abandons traditional static lookbacks in favor of a responsive differential tracking model. It evaluates the absolute range of price action against directional movement, feeding these differences through a recursive smoothing engine. This results in an oscillator that remains highly sensitive to genuine trend initiation while heavily penalizing sideways chop.
● Digital Signal Processing (DSP) Filters
The raw momentum data is processed through user-selectable DSP algorithms to extract the true signal from market noise. The Kalman Filter dynamically estimates the true state of momentum by balancing process noise against measurement noise, adapting instantly to volatility spikes. Alternatively, the LLAMA filter applies an efficiency-ratio-driven alpha scaling model, tightening its smoothing factor during periods of low efficiency and relaxing it during strong directional bursts.
● Oscillator-Bound Supertrend
Instead of applying a Supertrend to price, the script calculates a specialized ATR based on the frame-to-frame variance of the ARSI. It then projects upper and lower deviation bands around the ARSI, maintaining a directional bias based on trailing breakouts. The resulting baseline is then averaged with the DSP-filtered signal to create the "Merged Line," serving as the ultimate zero-lag trailing threshold for momentum.
● Multi-Factor Regime Scoring
The script continuously evaluates the broader market context by scoring four distinct components: the absolute level of the ARSI, the trigonometric angle of the ARSI trajectory, the state of the oscillator Supertrend, and the relationship of price to a macroeconomic baseline moving average. These factors are normalized and aggregated into a 0-100 Regime Score, offering a unified metric of trend health.
🎨 Visual Guide
The visual presentation is engineered for high-contrast, dark-mode optimized aesthetics, providing immediate, terminal-style data processing without chart clutter.
● Chart Elements
Color-Matched Candles: Price candles are painted based on the kinetic relationship between the ARSI and its signal line. Neon Cyan indicates strong bullish momentum, Dark Teal indicates weak bullish momentum, Deep Crimson indicates strong bearish momentum, and Maroon denotes weak bearish pressure. Slate Gray represents a neutral momentum state.
Dynamic Support/Resistance Boxes: Translucent, neon-bordered zones (Cyan for Support, Crimson for Resistance) highlight localized structural extremes, providing immediate context for price breakouts.
Trade Projection Labels: When crossover signals fire, dashed projection lines emerge, extending forward to display precisely calculated Entry (Slate), Stop Loss (Crimson), and multi-tiered Take Profit (Neon Green) levels based on dynamic risk-to-reward parameters.
Chart Angle Label: A floating text label displays the exact trigonometric angle and classification of the current trend (e.g., "Strong Uptrend / 45.2°").
● Oscillator Pane Elements
Adaptive RSI Line: Plotted with a dynamic gradient that transitions from Deep Crimson (extreme weakness) to Neon Cyan (extreme strength), instantly conveying momentum depth.
Merged Signal Line: A distinct Neon Purple to Deep Pink gradient line acting as the trailing support/resistance for the ARSI.
Divergence Histogram: Translucent Cyan and Red histogram bars plot the delta between the ARSI and the Merged Line, visualizing the acceleration or deceleration of momentum crosses.
Background Shading: The oscillator pane background shifts to a deep blue/purple tone during overbought (above 80) and oversold (below 20) extremes. A striking Electric Gold background illuminates periods where momentum enters a highly compressed "Squeeze" state.
Signal Markers: Crisp "BULL" (Cyan) and "BEAR" (Red) text labels appear on the oscillator when fully validated crossovers occur.
● The Analytics Dashboard
A fixed, dark-background HUD presents granular telemetry using segmented block bars and color-coded text for rapid scannability:
ARSI Level: Percentage reading of the current momentum state.
Signal Strength: Block visualization of the DSP-filtered baseline.
Angle Momentum & Acceleration: Metrics tracking the velocity and delta-velocity of the trend trajectory.
Supertrend & Market Bias: Text readouts indicating the dominant structural direction.
HTF Trend & Volume: Validation checks displaying the alignment of higher timeframes and localized volume surges.
Volatility ATR & Last Cross: Precise numerical readouts of market expansion and the duration since the last major signal.
Regime Score: The composite 0-100 metric, color-coded from Crimson (Bear) to Neon Magenta (Transition) to Cyan (Bull).
📖 How to Use
Identify Momentum Regime: Monitor the Dashboard's Regime Score. A score above 70 combined with a Neon Cyan ARSI line indicates an environment where long positions are statistically favored.
Trade the Crossover: Wait for the ARSI to cross the Merged Line. Validated crosses will generate a distinct "BULL" or "BEAR" label. Check the Dashboard to ensure the Volume Filter and HTF Trend are aligned (marked with a green checkmark).
Navigate Squeezes: When the oscillator background turns Electric Gold, the market is experiencing a severe volatility contraction. Avoid initiating new positions during the squeeze. Wait for the background color to clear, accompanied by an Alert indicating a Squeeze Breakout, before trading the subsequent expansion.
Manage Risk via Trade Labels: Upon a valid signal, utilize the automatically projected Entry, SL, and TP lines on the main chart to structure your position sizing according to the script's ATR-derived risk mechanics.
⚙️ Inputs and Settings
ARSI & Signal Lengths: Controls the primary lookback periods for the oscillator and its baseline.
Signal Filter Type: Select between RMA, Kalman Filter, or LLAMA to dictate the specific mathematical model used for noise reduction.
Supertrend ATR Length & Factor: Adjusts the sensitivity and width of the volatility bands applied to the oscillator.
Volume Filter Multiplier: Determines the threshold required for volume validation (e.g., 1.5 requires volume to be 50% above its moving average).
HTF Timeframe: Defines the higher timeframe used for macro-trend alignment (defaults to Daily).
Squeeze Angle Threshold: The maximum absolute angle permitted to trigger a volatility contraction state.
Trade Labels (Risk:Reward): Allows fine-tuning of the Stop Loss padding and the precise ratios for TP1, TP2, and TP3 targets.
🔍 Deconstruction of the Underlying Scientific and Academic Framework
This indicator relies on a robust foundation of applied mathematics and digital signal processing. The core methodology employs non-linear dynamic state estimation. Unlike standard moving averages that suffer from inherent group delay, the integration of algorithms akin to the Kalman filter allows the script to recursively project the next state of momentum and update that projection based on incoming price data. This minimizes lag while aggressively smoothing standard deviation anomalies.
Furthermore, the application of volatility banding (ATR) directly to an bounded oscillator (RSI) represents a shift from price-domain analysis to momentum-domain analysis. By calculating the variance of the momentum itself, the script acknowledges that momentum has its own distinct volatility profile, independent of price action. The kinematics of the trend are evaluated using trigonometric functions to derive the slope (velocity) and the rate of change of the slope (acceleration). This multidimensional approach ensures that signals are not generated merely by price crossing a threshold, but by a mathematically validated shift in the kinetic energy of the market.
⚠️ Disclaimer
All provided scripts and indicators are strictly for educational exploration and must not be interpreted as financial advice or a recommendation to execute trades. We expressly disclaim all liability for any financial losses or damages that may result, directly or indirectly, from the reliance on or application of these tools. Market participation carries inherent risk where past performance never guarantees future returns, leaving all investment decisions and due diligence solely at your own discretion. Wskaźnik

RX: Dual RSI Fusion 14/50 Compression Framework## RX: Dual RSI Fusion 14/50 Compression Framework
Is an advanced momentum framework designed to identify potential market exhaustion, compression phases, and high-probability reversal conditions by combining two Relative Strength Index structures into a single analytical model.
Unlike traditional RSI indicators that rely on a single momentum source, this framework integrates both a fast RSI (14-period by default) and a slow RSI (50-period by default) to provide a multi-layer view of market behavior.
### Core Concepts
• **Fast RSI (14):** Captures immediate momentum shifts, short-term exhaustion, and early divergence signals.
• **Slow RSI (50):** Represents the underlying market structure and helps identify broader momentum regimes.
• **Dynamic Compression Engine:** Measures the convergence between moving averages applied to the fast RSI, highlighting periods where momentum becomes increasingly compressed and potentially preparing for expansion.
• **Exhaustion Detection:** The indicator is specifically designed to monitor the sequence of events frequently observed near market turning points, including divergence development, momentum contraction, and structural breakout.
### Features
✔ Dual RSI architecture (Fast + Slow)
✔ Configurable moving averages applied directly to RSI values
✔ Compression detection between fast RSI moving averages
✔ Divergence memory engine with customizable validity period
✔ Momentum Delta histogram (Fast RSI - Slow RSI)
✔ Structural breakout detection from RSI compression zones
✔ Background state visualization for market context
✔ Alert conditions for potential exhaustion breakouts
### Interpretation
The framework is based on the premise that important market reversals are rarely caused by a single event. Instead, reversals often emerge from a succession of conditions:
1. Momentum divergence appears.
2. RSI structure begins to compress.
3. Market enters an exhaustion phase.
4. Fast momentum escapes the compression structure.
5. Expansion begins.
The indicator seeks to visualize this process and provide objective confirmation of potential exhaustion scenarios.
### Notes
This tool should not be interpreted as a standalone buy or sell system. It is intended to be used as a market structure and momentum exhaustion framework, ideally combined with price action, liquidity analysis, volume, or higher timeframe context.
Developed as part of the SXA analytical ecosystem by @Peter_n_n
Wskaźnik

Regression-Slope Divergence with Reliability ScoringRegression-Slope Divergence with Reliability Scoring
Most divergence tools tell you a divergence exists. This one tells you whether that divergence has historically mattered on the symbol and timeframe you're actually looking at — and states the conclusion in plain words on the chart.
What it plots
A normalised momentum oscillator with stretch bands and divergence markers, plus a verdict panel that scores those divergences in real time. By default the chart stays minimal — just the oscillator and the verdict panel — with an optional key-info table and a per-direction track-record grid you can switch on in settings.
Why these components are combined, and how they work together
Three classical pieces are fused into a single pipeline — not stacked as independent signals:
Linear-regression slope of price — the direction price is genuinely trending.
RSI-based momentum, z-score normalised — the direction momentum is trending.
A binomial-proportion confidence test — whether the disagreement between the two has preceded a favourable move often enough to beat a same-zone baseline.
Components 1 and 2 only become a signal where they disagree — that disagreement is the divergence. Component 3 is the layer that makes this original: it records every past divergence on the current instrument, measures how often the expected move actually followed within a fixed look-ahead, compares that to what a random entry from the same stretched zone would have achieved, and wraps a confidence interval around the result. The parts are interdependent — remove any one and the script can no longer answer its core question, "is this divergence worth trading here?"
How to read it
The verdict panel translates the statistics into four states:
GREEN — edge confirmed: these divergences have beaten a same-spot baseline here. Worth acting on.
RED — no edge here: they've lost to a coin-flip from the same spot. Skip them, or try a higher timeframe (counter-trend divergence often fails on fast timeframes).
AMBER — unproven: edge not statistically established yet; treat as low-confidence.
GREY — learning: still collecting completed samples.
It also shows whether a signal is live right now and a reward-vs-risk figure — the average best move vs the average worst move after a signal, in ATR. Below 1:1 means signals have hurt more than they've helped. The optional grid breaks the record down into Bullish / Bearish with hit-rate, baseline, edge and reward:risk.
A divergence itself is simply price making a higher high / lower low while the momentum line does the opposite.
What's original
Off-the-shelf divergence indicators fire and leave you to guess. This one keeps a self-updating, confidence-scored track record against a same-zone baseline and tells you, in words, whether the current setup has earned your attention on this specific market.
Universal across markets
It reads only the chart's own price (the source is configurable in settings), so it runs on any symbol, any timeframe, in any market with no external data. Defaults are tuned for NIFTY futures; change the source and lengths for other instruments.
Outputs for other scripts
Generic EXP_* values — oscillator, signal, probability, edge, edge lower-bound, sample count, regime, trend strength and verdict tier — are published to the Data Window so other indicators can read them via input.source().
Concept credits
Relative-strength momentum and average true range — J. W. Wilder. Binomial score confidence interval — E. B. Wilson. Trend-efficiency regime measure — P. Kaufman. Least-squares regression — classical statistics.
Disclaimer
For research and education only. This is not financial advice, not a recommendation to buy or sell, and not a guarantee of future results. All performance shown is in-sample and past-only. Markets carry risk — do your own research and manage your own risk. Wskaźnik