
DJI CMP 33876
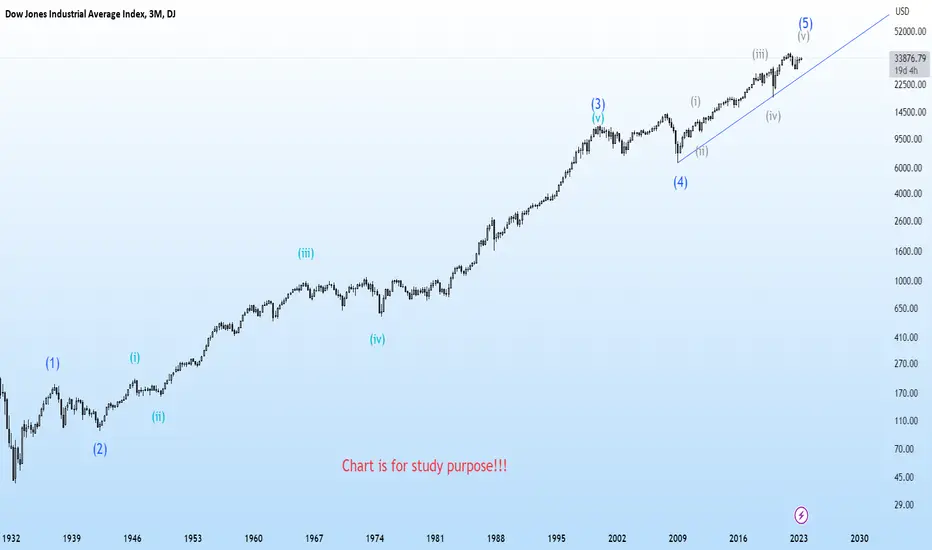
This is Quarterly chart of DJI,
There is Wave counts right from the Great Depression low
looking at the charts ,
one can see that we are in wave 5 (blue)
the internal counts (grey) shows subwave
whenever this superwave gets completed....
one can expect markets to correct for next few yrs...
Just a View!!
Vedang :)
Chart is for study purpose only!!!

Отказ от ответственности
Информация и публикации не предназначены для предоставления и не являются финансовыми, инвестиционными, торговыми или другими видами советов или рекомендаций, предоставленных или одобренных TradingView. Подробнее читайте в Условиях использования.
Отказ от ответственности
Информация и публикации не предназначены для предоставления и не являются финансовыми, инвестиционными, торговыми или другими видами советов или рекомендаций, предоставленных или одобренных TradingView. Подробнее читайте в Условиях использования.