
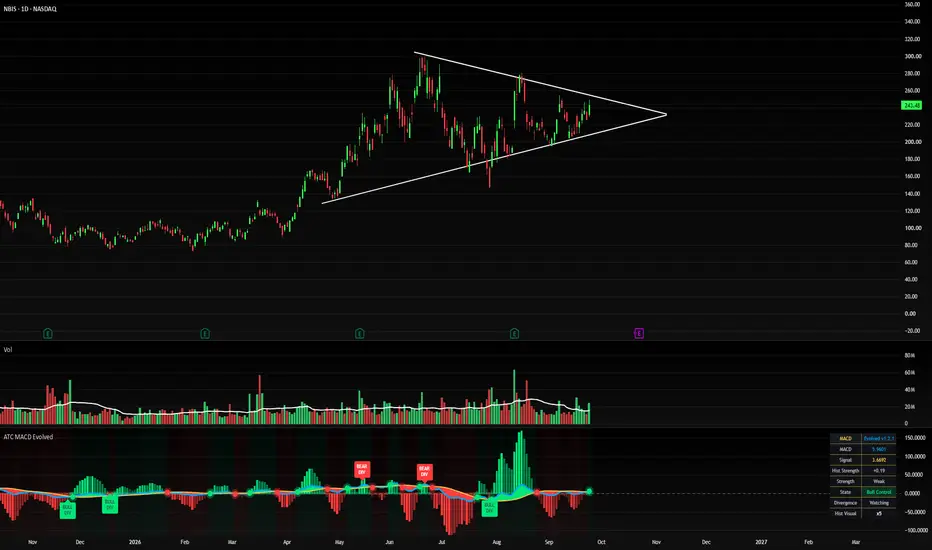
📊 NBIS Daily Chart — Compression Before Expansion?
Nebius Group (NBIS) is developing a large symmetrical triangle on the daily chart after its major advance earlier in the year. This type of structure represents a period of price compression—buyers continue stepping in at progressively higher prices while sellers are defending progressively lower highs.
The important takeaway: the triangle itself is neutral until price confirms a breakout.
🔺 Upper trendline / resistance: NBIS is now pressing into the descending resistance line around the $240–$250 area. A decisive daily close above this structure would be the first technical indication that buyers may be gaining control.
🔻 Rising support: Higher swing lows continue to define the lower boundary of the pattern. That tells us buyers have repeatedly been willing to step in sooner during pullbacks. A breakdown through that rising support would invalidate the constructive compression structure.
📊 Volume is an important part of the setup. Notice how volume expanded during several of the larger directional moves, while more recent trading activity has generally moderated as price moves toward the triangle's apex. That contraction in both price range and volume is common during consolidation as supply and demand move closer to equilibrium.
What we haven't seen yet is equally important: clear breakout-volume confirmation.
For a higher-quality bullish breakout, I would want to see:
• Price close convincingly above the descending trendline
• Volume expand materially above recent average
• The breakout level hold on a retest rather than immediately falling back inside the triangle
The lower CVD panel is also worth watching. Cumulative volume delta has been recovering while price consolidates, suggesting buying pressure has improved beneath the surface. That doesn't guarantee an upside break, but continued CVD strength alongside an eventual price breakout would provide additional confirmation.
⚠️ The closer a symmetrical triangle gets to its apex, the more traders should be alert for false breakouts and volatility expansion in either direction. The pattern isn't the signal—the breakout, volume response, and follow-through are.
NBIS is approaching a technically important decision point.
Educational purposes only. Not financial advice.
Nebius Group (NBIS) is developing a large symmetrical triangle on the daily chart after its major advance earlier in the year. This type of structure represents a period of price compression—buyers continue stepping in at progressively higher prices while sellers are defending progressively lower highs.
The important takeaway: the triangle itself is neutral until price confirms a breakout.
🔺 Upper trendline / resistance: NBIS is now pressing into the descending resistance line around the $240–$250 area. A decisive daily close above this structure would be the first technical indication that buyers may be gaining control.
🔻 Rising support: Higher swing lows continue to define the lower boundary of the pattern. That tells us buyers have repeatedly been willing to step in sooner during pullbacks. A breakdown through that rising support would invalidate the constructive compression structure.
📊 Volume is an important part of the setup. Notice how volume expanded during several of the larger directional moves, while more recent trading activity has generally moderated as price moves toward the triangle's apex. That contraction in both price range and volume is common during consolidation as supply and demand move closer to equilibrium.
What we haven't seen yet is equally important: clear breakout-volume confirmation.
For a higher-quality bullish breakout, I would want to see:
• Price close convincingly above the descending trendline
• Volume expand materially above recent average
• The breakout level hold on a retest rather than immediately falling back inside the triangle
The lower CVD panel is also worth watching. Cumulative volume delta has been recovering while price consolidates, suggesting buying pressure has improved beneath the surface. That doesn't guarantee an upside break, but continued CVD strength alongside an eventual price breakout would provide additional confirmation.
⚠️ The closer a symmetrical triangle gets to its apex, the more traders should be alert for false breakouts and volatility expansion in either direction. The pattern isn't the signal—the breakout, volume response, and follow-through are.
NBIS is approaching a technically important decision point.
Educational purposes only. Not financial advice.
Заметка
Correction to the above: removed the CVD indicator from the chart image. 
Visit AscendTradingConcepts.com for extensive trading education, FREE daily and weekly market briefs, and access to our Premium Exclusive Indicators and Portfolio Lab.
Отказ от ответственности
Информация и публикации не предназначены для предоставления и не являются финансовыми, инвестиционными, торговыми или другими видами советов или рекомендаций, предоставленных или одобренных TradingView. Подробнее читайте в Условиях использования.
Visit AscendTradingConcepts.com for extensive trading education, FREE daily and weekly market briefs, and access to our Premium Exclusive Indicators and Portfolio Lab.
Отказ от ответственности
Информация и публикации не предназначены для предоставления и не являются финансовыми, инвестиционными, торговыми или другими видами советов или рекомендаций, предоставленных или одобренных TradingView. Подробнее читайте в Условиях использования.