
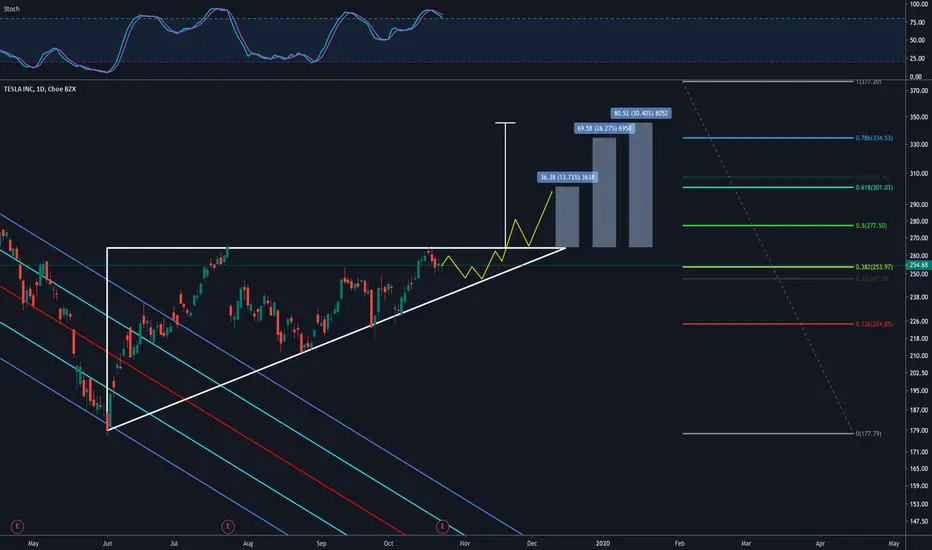
TSLA seems to have formed a very large ascending triangle after breaking out of the downsloping channel earlier this year in June.
There is a higher likelihood of it to break to the upside, especially after breaking from a long downtrend. There is a 75% chance of it being a continuation pattern, meaning, it is a lot more likely for this to break upwards.
Targets can be if it breaks upwards: - $300. -$335. - $345.
Obviously, if the bottom diagonal line breaks then this pattern is invalid.
Long term it looks more bullish than not.
What are your thoughts?
Сделка активна
Still active, but pull back might be near
Отказ от ответственности
Информация и публикации не предназначены для предоставления и не являются финансовыми, инвестиционными, торговыми или другими видами советов или рекомендаций, предоставленных или одобренных TradingView. Подробнее читайте в Условиях использования.
Отказ от ответственности
Информация и публикации не предназначены для предоставления и не являются финансовыми, инвестиционными, торговыми или другими видами советов или рекомендаций, предоставленных или одобренных TradingView. Подробнее читайте в Условиях использования.