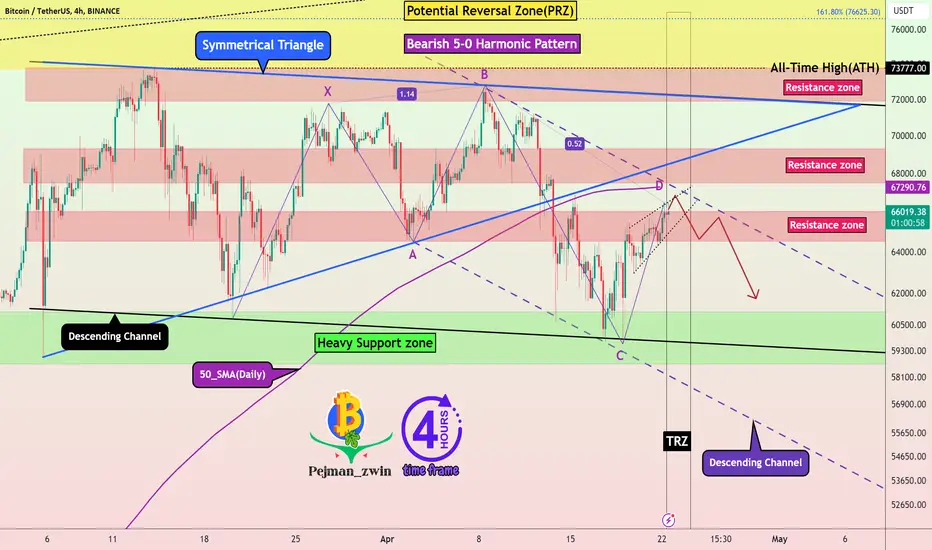
⚠️Bitcoin Analysis (Mix of Patterns)⚠️👋Hi, everyone. First of all, I apologize for the chart being busy, but I think all the lines and zones are needed to better understand it.
🏃♂️Bitcoin is moving in two descending channels : a ⚫️Black Descending Channel⚫️ and a 🟣Purple Descending Channel🟣 . Also, it is currently moving in the 🔴 Resistance zone($66,050-$64,520) 🔴and near the Upper line of the descending channel and 50_SMA(Daily) and Time Reversal Zone(TRZ) .
📈If we want to look at the chart from the point of view
5-0 Pattern
SPX500USD: Bullish 5-0 at 0.618 RetraceThe SPX is trading within a Broadening Top near the Demand Line of the pattern, aligning with the 0.618 Retrace after developing a Bullish 5-0 Harmonic Wave Structure. If it plays out we should get a Higher High within the range, which could take us to the Fibonacci Extensions above the current highs.
Buying Opportunity on NZDUSDThis week, I'm eyeing a potential buying opportunity on NZDUSD, and here's my trade plan:
1. Bullish 5-0 Pattern on Weekly Chart: The NZDUSD is currently in the zone of the Bullish 5-0 Pattern on the Weekly Chart, signaling a potential buying opportunity.
2. 4-hourly Chart Setup: The 4-hourly chart presents a candlestick confirmation at the Potential Reversal Zone (PRZ), indicating a possible entry point for long positions.
3. Confirmation with 3-Bar Reversal: Despite the candlestick co
Bullish Flag Breakout and 5-0 Pattern Combo TradeI'm closely monitoring AUDCAD, and here's why:
1. Bullish Flag Channel Breakout on 4-hourly chart:
- AUDCAD has recently broken out of a Bullish Flag Channel on the 4-hourly chart.
- This breakout suggests a potential bullish move in the market.
2. 5-0 Pattern on 1-hourly chart at 0.8829:
- Waiting for a retracement, I'm eyeing the completion of a 5-0 Pattern at 0.8829 on the 1-hourly chart for a potential long opportunity.
- Utilizing a combo trade strategy to manage risk and enhance retu
Bullish 5-0 vs. Type2 Bearish Shark PatternIf you're navigating conflicting biases, here are two potential setups:
1. Bullish 5-0 Pattern at 149.96: Long Opportunity
- Engage in a long position based on the completion of the Bullish 5-0 pattern at 149.96.
- This pattern signals a bullish bias, providing an opportunity for traders expecting an upward move.
2. Type2 Bearish Shark Pattern at 150.67: Shorting Opportunity
- Consider a short position if the Type2 Bearish Shark Pattern completes at 150.67.
- This approach factors in the p
NVDA Is Forming 0-5 Pattern .the detail is shown in the above Idea.
I made this Idea based on Candlestick Analysis and Harmonic pattern.
Bullish 5-0 pattern should be formed, not necessarily mandatory, in the downtrend so it can have a much higher success rate.
Bullish 5-0 is drawn as Shark pattern, but with additional C-D leg. That means you can first have the Shark pattern on the chart and then wait until C-D retracement happens.
B-C leg has two Fibonnaci rules so you can watch two bullish scenarios. The final differenc
ATOMUSD: Holding 21-week SMA After Completion of Bullish SharkATOMUSD has Double Bottomed on the weekly timeframe at the PCZ of a Bullish Shark and is now holding above the 21-week SMA. If it holds, we could see ATOM breakout of the range and rise all the way up to a 61.8% retrace. From there it may then turn into a Bearish 5-0 but for now I'm just focused on the potential Bullish move upwards.
The Shark pattern here is admittedly controversial given the fact the C leg is an equal high to the A leg rather than being a higher high, but I think it is somet
A Promising Bearish SetupI'm keeping a keen eye on what I consider a golden trading opportunity - the retest of a Bearish Shark Pattern coinciding with a higher timeframe Type2 Bearish 5-0 Pattern on the Daily Chart.
My plan is to wait for a retest around 184.15, aiming for a shorting opportunity.
What's your take on GBPJPY? Any strategies or thoughts you'd like to share?
Shorting Caution and Planning for Long-Term Opportunities!GBPUSD exhibits a stronger bullish trend compared to EURUSD, despite a Weaker Bull Trading setup. I'm eyeing a buying opportunity for a longer-term trade strategy.
However, this doesn't deter me from considering a Bearish Shark Trading setup on the 1-hourly chart as a potential shorter-term play. Simultaneously, I'm patiently awaiting the formation of a Bullish 5-0 Pattern, which could serve as an entry point for a longer-term buying opportunity.
What's your take or strategy on GBPUSD? Share y
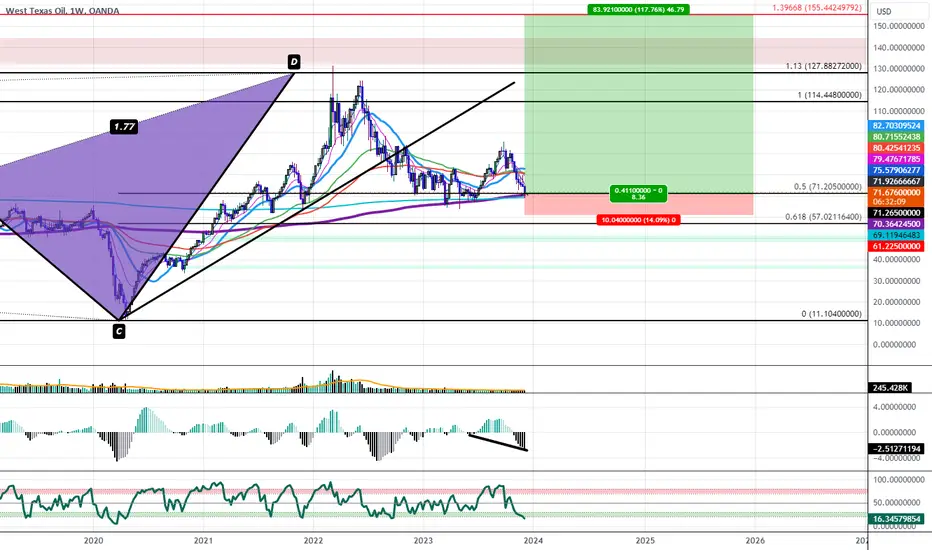
WTICOUSD: Ranging at the 200-Week SMAMy overall sentiment for Oil remains Bearish, though my midterm sentiment has been Bullish, as I think WTICOUSD needs to come back up to revisit some of the highs above 100 and face one last rejection from those levels before I will be fully convinced of oil making significantly lower lows.
For the time being, Oil has dumped below last week's range but is now sitting at the 200-week SMA and at the old 50% retrace which could be where this Bearish Shark starts to act as a Bullish 5-0 which would
Navigating Contrasting Trends for Optimal Trading StrategiesThe 4-hourly chart showcases a compelling Bullish 5-0 Pattern retest accompanied by an RSI Divergence.
While direct engagement in the trade is an option, I'm personally inclined towards waiting for a Bullish Gartley Pattern retest around 186.39.
This approach significantly mitigates risk while still allowing for favorable profit potential—a strategy centered on lower risk for higher returns.
What are your thoughts or trade plans on this opportunity?
Feel free to share below!
IT'S A SIMPLE. EFFECTIVE. STRATEGY -FOR BITCOIN[ ]
The "Potential Reversal Zone", or PRZ
-is between the 50% fibonacci retracement level at $32.66K
and
the 66% retracement level at $41.51K.
-----THE WHY---------
[ ]
((the primary tool in all of my technical anaylsis is the use of the "golden ratio" in forecasting 'pivots" as the 61.8% retracement level is the primary guide.
The 50% and 66% fibonnaci retracement levels are simply the most favorable deviations from the 61.8% level that accurately reflect market volatility]]
Synonyms
ARB(ARBUSDT): BUYING OPPORTUNITY ↪️ARB is engaged in Elliott wave surge following the formation of a twin base pattern on a daily timeframe. Analyzing from a 4H TF I spotted a bearish flag which suggest further downward move to the daily horizontal support.
Following a prolonged 5-wave surge, the ABC adjustment has commenced. Currently, the motion is in wave 3, and I anticipate its conclusion in wave 4. It is in this range that I will acquire extended positions...Tarde safely 👍✅
Potential Bearish Moves Amidst Bullish SignalsNZDJPY presents an intriguing trading setup despite being a counter-trend trade.
The observation of a Bearish Shark Pattern checkback on the Weekly Chart , along with RSI Divergence , adds weight to this potential trade opportunity.
I'm waiting for a shorting opportunity on lower timeframes and, specifically, looking for a 1-1 trading setup , intending to initiate a short position at 91.99 on the Daily Chart.
Trade plans can vary among traders based on their analysis and risk manage
Navigating Contrasting Trading OpportunitiesGBPUSD is currently indicating a Weaker Bull Trend . Here are potential strategies for different trading approaches:
Trend Traders :
Waiting for a Bullish 5-0 Pattern on the 4-hourly chart at 1.2334 might align with your strategy as it complements the ongoing bullish trend.
Counter-Trend Traders :
For those seeking a counter-trend opportunity, a shorting opportunity off the Bearish Shark Pattern retest at 1.2453 or the completion of a Bearish Gartley Pattern on the 1-hourly chart at 1.2478
ZARJPY: Massive Head and Shoulders with Bearish DivergenceIn addition to the Bearish 5-0 I pointed out before on a previous chart, the ZARJPY has also formed a Potential Bearish Head and Shoulders that is visible on timeframes even as high as the monthly with Bearish Divergence on the MACD and RSI. If The Carry Trade truly is to be dissolved, the ZARJPY should be among the currency pairs that are most severely affected, as it has the highest interest rate differential and therefore generates the highest yield for the time being.
WTICO: Potential Bullish 5-0 Looking to Take USOIL Up to $105.30USOIL has recently retraced to the 0.382 from the PCZ of a Bearish Shark, but now it's looking to try and hold the 200 SMA and the 38.2-0.50% zone with Hidden Bullish PPO Divergence and an impending PPO Bullish Confirmation. If it does hold here, it could confirm a Potential Bullish 5-0 and if this 5-0 plays out, I think it could take USOIL above $100 and likely up to $105.30, as that would be the 61.8% retrace from high to low.