DFMREI : Is Downtrend Over ?DFM:DFMREI (Dubai Financial Markets Real Estate Index)
📉 Is the Downtrend Over? Reverse Fibonacci Suggests Another Leg Lower ⚠️
After rejecting from the 16.8k trendline resistance, the market continues to respect its broader bearish structure.
Here's what the chart is telling us:
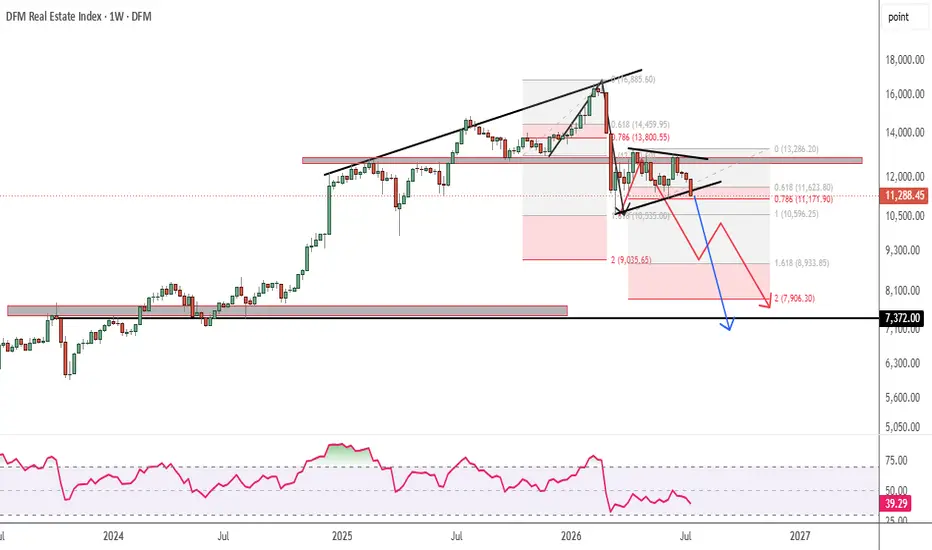
🔹 The previous impulse moved from a 13k swing low to a 16.8k swing high, which also aligned perfectly with a major descending trendline resistance. Applying a Reverse Fibonacci Extension projected the 10.6k zone as the first major downside objective—and price respected it almost precisely during the sharp selloff triggered by the Middle East geopolitical conflict (highlighted by the black arrow).
🔹 The subsequent dead cat bounce stalled near 12.8k, a level that has repeatedly acted as both historical support and resistance, confirming it as a significant supply zone where sellers regained control.
What's Next?
Using the latest price structure:
Swing Low: 10.6k
Swing High: 12.8k
The prevailing trend remains bearish, with lower highs and lower lows still intact.
Projecting another Reverse Fibonacci 1.618 Extension identifies the 9k–8k demand zone as the next high-probability downside target (illustrated by the red path).
Adding further weight to the bearish outlook, the chart is also developing a Bearish Pennant / Bear Flag continuation pattern. If this structure confirms with a downside breakout, the measured move projects a final target around the 7.3k–7k region ( blue arrow marked )
Key Technical Confluences
✅ Reverse Fibonacci Extensions
✅ Bearish Pennant / Bear Flag Pattern
✅ Trendline Resistance Rejection
✅ Lower High–Lower Low Market Structure
✅ Historical Support & Resistance Flip
✅ Momentum Continuation Setup
My View
As long as price remains below 12.8k, rallies may continue to be selling opportunities rather than signs of a trend reversal.
A confirmed break below 10.6k could accelerate downside momentum toward the 9k–8k zone, while a completed bear flag projection opens the possibility of testing the 7k area.
What do you think? Is this simply another correction, or are we preparing for the next major leg down? Share your analysis below.
#TechnicalAnalysis #TradingView #PriceAction #ReverseFibonacci #FibonacciExtension #BearFlag #BearishPennant #ChartPattern #SupportAndResistance #TrendAnalysis #SwingTrading #MarketStructure #StockMarket #Crypto #Investing #Trading #Momentum #Breakdown #TrendFollowing #SmartMoney #VolumeAnalysis #ChartOfTheDay #TradeIdeas #MarketOutlook #Bearish
Btw, i had already shared the dead cat bounce scenario, proof below
Educational content only. Not financial advice.
 Short
Short
 Short
Short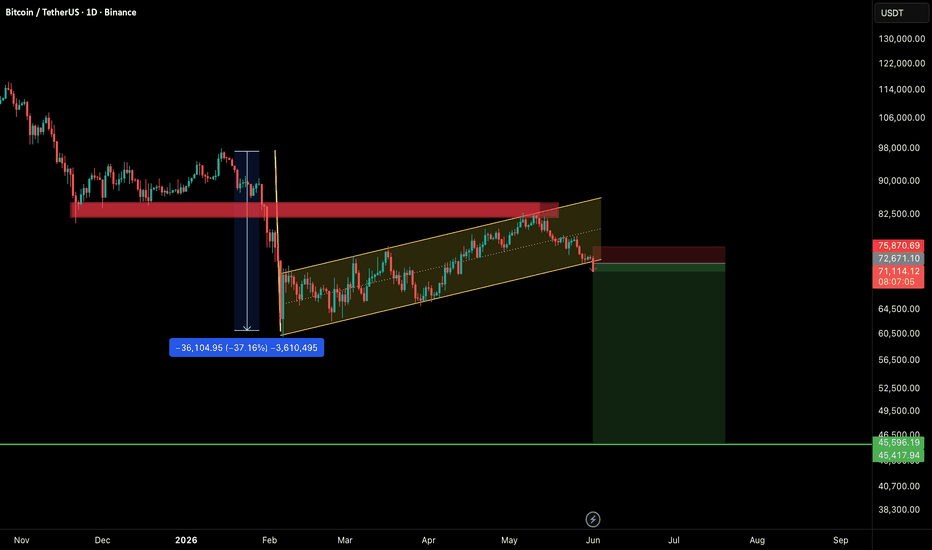
 Short
Short
Short 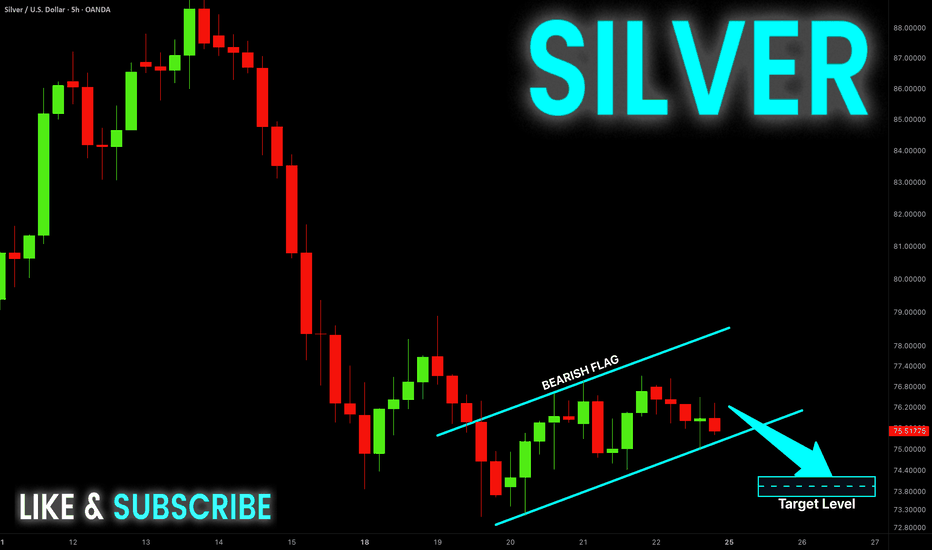
Short 
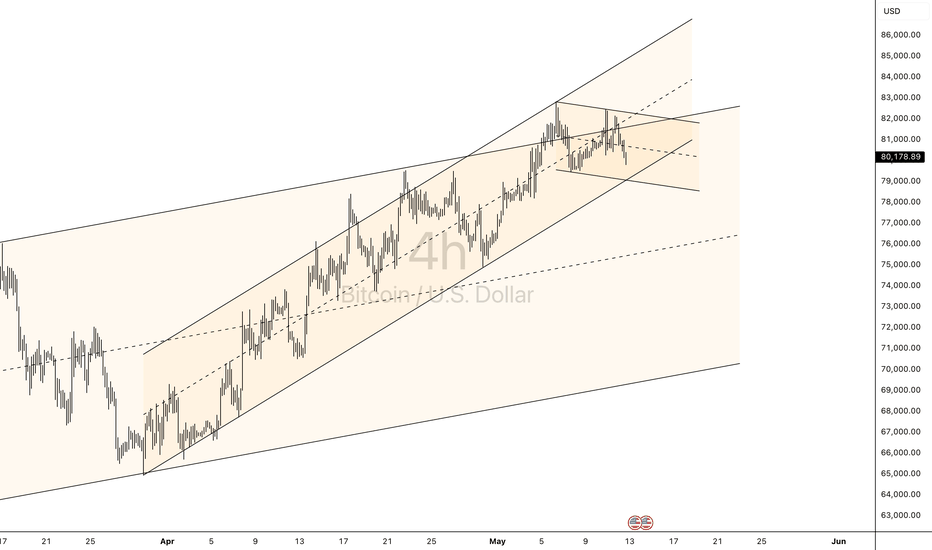
Short 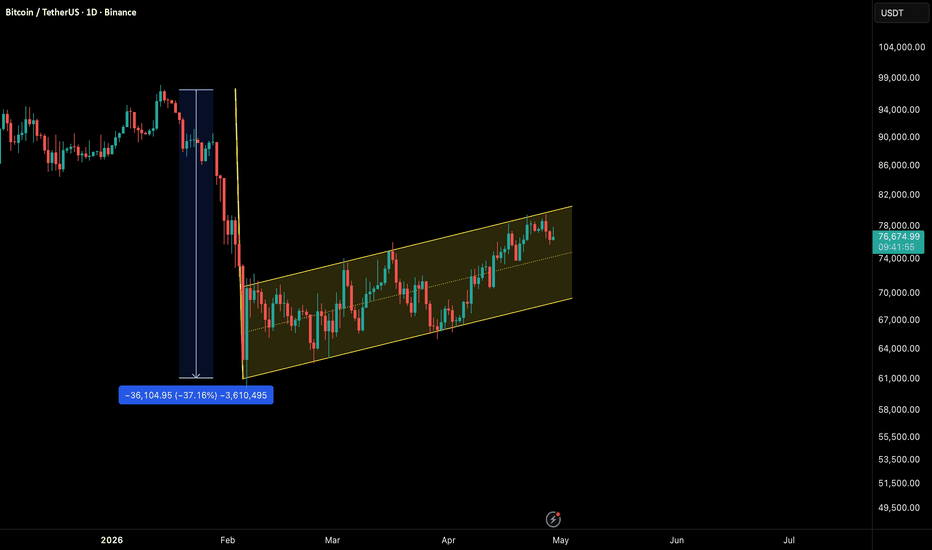
The Silent Signal: How Open Interest May Shape the Next MoveIntroduction — The Signal Beneath Price
Price is what most traders see. Participation is what most traders miss.
In futures markets, open interest (OI) offers a unique lens into market behavior — not by telling us where price is, but by revealing how committed market participants are to the move. When combined with structural tools and quantitative overlays, OI can act as a “silent signal,” highlighting shifts in conviction that price alone may conceal.
The current environment presents a compelling case. While price has been largely moving sideways in recent months, the underlying participation dynamics suggest that something more subtle — and potentially more meaningful — is unfolding beneath the surface.
Open Interest Regimes — Tracking Market Intent
At its core, open interest measures the number of outstanding contracts in the market. But more importantly, it reflects whether traders are entering or exiting positions.
Increasing OI → New positions entering the market (expanding participation)
Decreasing OI → Positions being closed (contracting participation)
This distinction becomes powerful when observed over time.
Looking at the chart provided, a clear pattern emerges:
Periods of increasing open interest tend to align with upward price movements
Periods of decreasing open interest tend to align with downward price movements
This relationship is not coincidental. It reflects the underlying commitment behind price trends.
More recently, however, the balance has shifted.
Despite price moving sideways — and even slightly upward at times — the dominant regime has increasingly been one of declining open interest. This creates a subtle divergence:
👉 Price appears stable
👉 Participation is quietly weakening
And in futures markets, weakening participation often precedes structural transitions.
Regression Analysis — Quantifying Directional Bias
To better visualize these dynamics, regression lines have been applied across different phases of open interest behavior.
Rather than focusing on every price fluctuation, regression analysis helps to:
Smooth out short-term noise
Highlight the underlying directional bias during each OI phase
The result is striking:
During rising OI phases, regression lines slope upward, confirming constructive participation
During falling OI phases, regression lines slope downward, reinforcing weakening structure
This alignment between participation and directional bias strengthens the interpretation that OI is not just confirming price — it is contextualizing it.
In the current phase, multiple sequences of decreasing OI have appeared, with regression slopes reflecting downward pressure building beneath a relatively flat price structure.
This is how transitions may begin — quietly.
The Role of the Weekly Open Gap — A Structural Ceiling
Beyond participation, structure plays a critical role in shaping market behavior.
One of the most notable features on the chart is the presence of a weekly open gap, formed during a market reopening. In futures markets, such gaps represent temporary imbalances between buyers and sellers, often acting as key reaction zones.
The gap in focus spans approximately:
Upper boundary: 2,641.0
Lower boundary: 2,405.5
When price recently entered this zone, the reaction was immediate and decisive:
👉 Strong rejection from within the gap
👉 Price pushed back downward
👉 Simultaneous decline in open interest
This confluence suggests that the gap is acting as a structural ceiling, where supply re-engages and participation fails to support higher prices.
In other words, the market attempted to move higher — but conviction did not follow.
Market Structure — Is This a Bearish Flag?
When stepping back and observing the broader structure, another layer of context emerges.
The price action since approximately February can be characterized as:
Sideways
Slightly upward-sloping
Occurring after a prior downtrend
From a structural perspective, this configuration resembles what is commonly referred to as a bearish flag — a consolidation phase that occurs within a broader downward move.
Key elements include:
A prior impulsive decline
A consolidation phase with limited upward follow-through
Weakening participation during the consolidation
While no pattern guarantees an outcome, this framework provides a logical narrative:
👉 The market may be consolidating before attempting continuation
The declining open interest during this phase further supports the idea that the consolidation lacks strong conviction.
Forward-Looking Trade Scenario (Illustrative Case Study)
The following scenarios are presented strictly for educational purposes, illustrating how one might structure a trade using the concepts discussed.
Scenario 1 — Gap Rejection Entry (Conservative Approach)
Entry: Within the gap zone upon signs of rejection
Stop: Above the upper boundary of the gap
Target: Lower structural support (~1,663.5)
This approach focuses on fading strength into resistance, aligning with both structural and participation signals.
Scenario 2 — Breakdown Confirmation (Momentum Approach)
Entry: Break below prior low (~2,253.0)
Confirmation: Formation of a lower low in market structure
Stop: Above recent structure or based on risk parameters
Target: ~1,663.5 (identified support linked to prior unfilled orders)
This approach prioritizes confirmation over anticipation, waiting for structure to validate the move.
Risk-to-Reward Framework
In both scenarios, a reward-to-risk ratio of approximately 3:1 may serve as a reference point for structuring the trade.
However, it is essential to emphasize:
These are hypothetical case studies
Execution, timing, and risk management remain critical variables
Understanding the Instruments
Understanding contract specifications is essential for translating analysis into practical risk management.
Ether Futures (Standard Contract)
Tick size: $0.50 per ether = $25.00 per contract
Notional exposure: Substantial, requiring careful capital allocation
Margin requirement: ~$37,500 per contract
Micro Ether Futures
Tick size: $0.50 per ether = $0.05 per contract
Designed for greater flexibility and precision in position sizing
Margin requirement: ~$75 per contract
Margin requirements vary over time based on volatility and clearing conditions, but generally:
Standard contracts require significantly higher initial margin
Micro contracts offer a lower capital threshold, enabling more granular risk control
The choice between contract types depends on:
Account size
Risk tolerance
Position sizing strategy
Risk Management — The Non-Negotiable Layer
No analytical edge can compensate for poor risk management.
Key principles include:
Defining risk before entering a position
Using stop-loss levels aligned with structure
Avoiding overexposure relative to account size
Importantly, open interest should be viewed as:
👉 A contextual tool, not a standalone trigger
Markets can behave unpredictably, and participation signals — while informative — do not eliminate uncertainty.
Key Takeaways — Listening to the Silent Signal
Open interest provides insight into market participation and conviction
Divergences between price and OI can reveal hidden weaknesses or strengths
Structural elements such as gaps and consolidation patterns enhance interpretation
The current environment reflects declining participation within a consolidating structure
Risk management remains the foundation of any trading approach
Data Consideration
When charting futures, the data provided could be delayed. Traders working with the ticker symbols discussed in this idea may prefer to use CME Group real-time data plan on TradingView: www.tradingview.com - This consideration is particularly important for shorter-term traders, whereas it may be less critical for those focused on longer-term trading strategies.
General Disclaimer
The trade ideas presented herein are solely for illustrative purposes forming a part of a case study intended to demonstrate key principles in risk management within the context of the specific market scenarios discussed. These ideas are not to be interpreted as investment recommendations or financial advice. They do not endorse or promote any specific trading strategies, financial products, or services. The information provided is based on data believed to be reliable; however, its accuracy or completeness cannot be guaranteed. Trading in financial markets involves risks, including the potential loss of principal. Each individual should conduct their own research and consult with professional financial advisors before making any investment decisions. The author or publisher of this content bears no responsibility for any actions taken based on the information provided or for any resultant financial or other losses.  Education
 Short
Short
Short 
 Long
Long
Long