Bitcoin – the bottom target revealed!Hello, everyone!
Yesterday I told you that the boring downside move is going to happen. I think it has started yet. Bitcoin still did not break down the key support. In case of breakdown we can point out the global bottom target.
On the 1D timeframe of the BTCUSDT chart we can build the Fibonacci levels. The price hit exactly the 0.5 level and got a rejection. In case of trend continuation according to Fib Div strategy the zone 27 is the last target. Now it is located at $13-15k. To finish the
Bill Williams Indicators
Bitcoin – liquidity collection will cause the crashHello, everyone!
Yesterday’s the most probable scenario, on which I put my money is playing out right now. The price showed another one local leg up to the upside, after that we saw the bearish reaction. Today Bitcoin is confirming my concerns about the potential price dump.
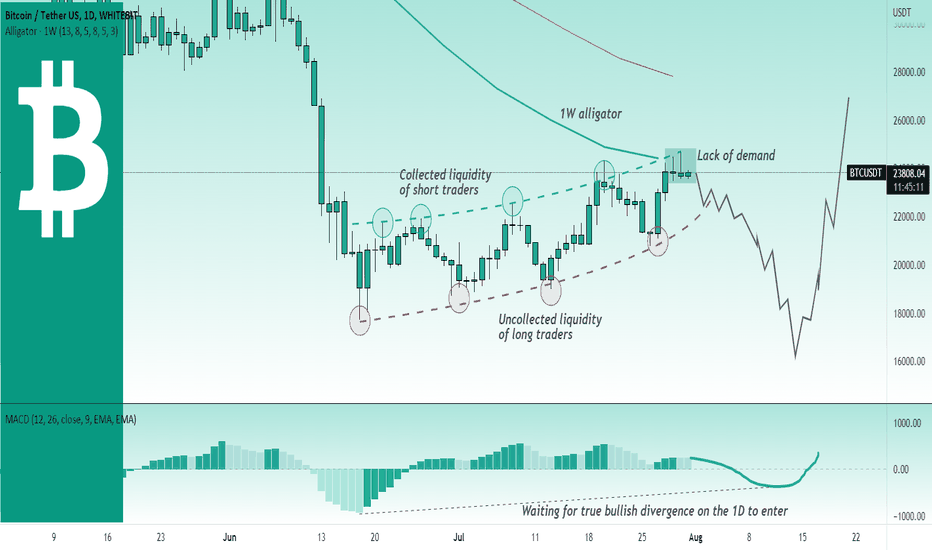
Let’s take a look at the 1D timeframe of the BTCUSDT chart of the WhiteBit exchange. The price reached the lips of the weekly Williams Alligator indicator. If my assumption about the last wave 5 is true we have to see the
Bitcoin – crash after short squeeze Hello, everyone!
Bitcoin continues to show the weakness of the current uptrend, but I can see that a lot of shorts have been executed. I suppose we have to see another one final local pump to liquidate all these positions. Moreover the Elliott waves analysis approach tells us the exact target for the potential short trade.
Let’s take a look at the 4h timeframe of the BTCUSDT chart on the WhiteBit exchange. The local parabolic growth is the my favorite formation because it is the 100% sign of t
Bitcoin – time to dump!Hello, everyone!
Yesterday I sold half of my Bitcoins. Now I have only 10% of the deposit in BTC according to my tradevesting approach. I think that we will see lower prices, let’s try to explain why.
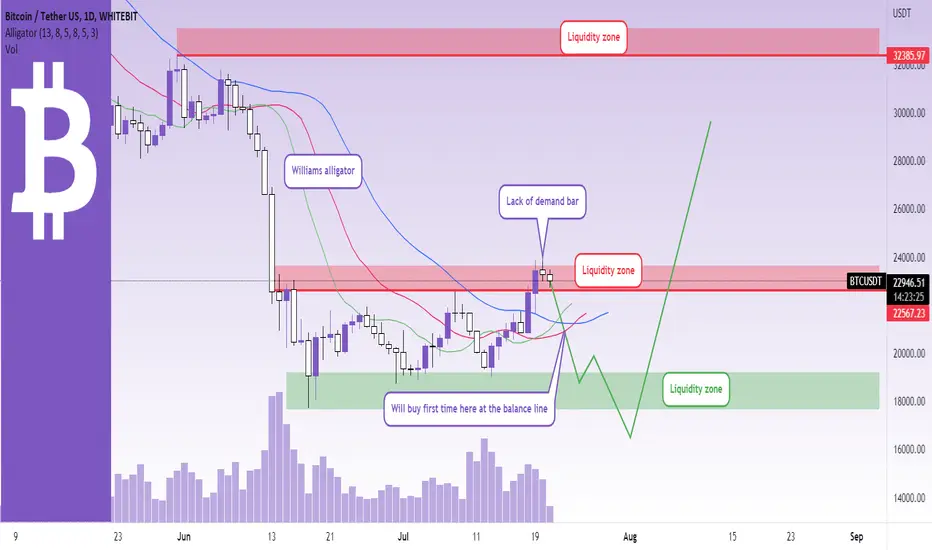
Let’s take a look at the BTCUSDT chart of the WhiteBit exchange. I marked the liquidity zones with the red and green color. We can see that last couple of days the Bitcoin have been collecting liquidity above the daily fractal level. Now there are no reasons anymore to grow. If we will see the mo
BNB/BTCHi investors and traders,
BNB/BTC setup looking good for an ATH.
To support this idea check my previous BTC/USD which is shows the bottom was in. At least for short term.
Oscillators looking good.
Forming a bullish pattern with good probability to break out.
Price action above 21 EMA on 2 weeks which is so powerful.
Correlated with BTC dominance price, DXY chart, BTC chart and ETH/BTC will follow, it seems that the markets want a bounce (maybe a bear market rally) until the end of year.
ADA/USD - 1 day chart analysisHere is a closer look at this ADA/USD 1 day chart:
ADA is in a Ichimoku P Wave (the 2 converging Blue Trend-lines on Chart) on this daily timeframe. This P Wave is potentially Bearish because it is an inverted P. Note that the bottom trend-line of the P Wave is near the 38.20% ($0.430) Fib Retracement level.
The Ichimoku Cloud Conversion Line (Tenkan Sen) is indicating that the Mid-Point of the Short-Term Momentum is upwards at the moment. Note that the Conversion Line (Tenkan Sen) is still u
Bullish Sign ?Yo Guyzzz..
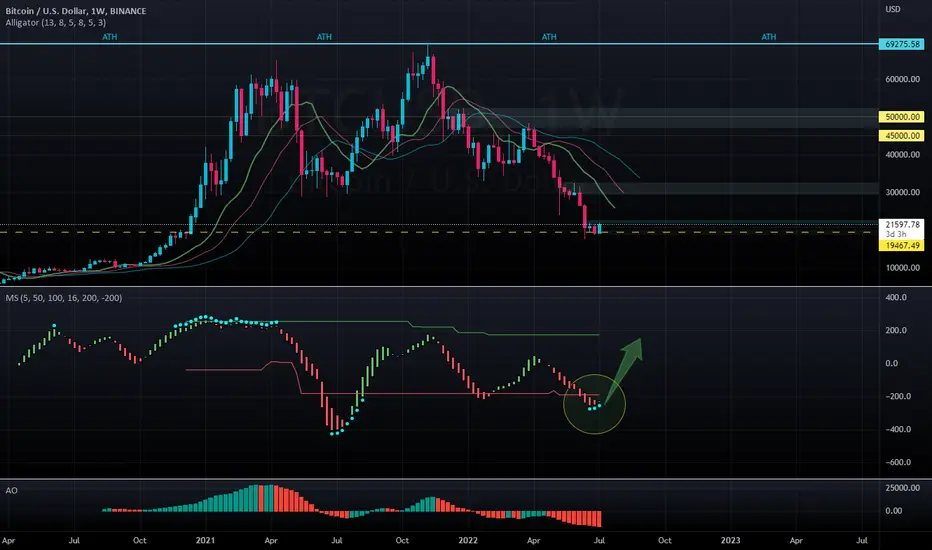
think this Matrx oscillator is tellng us something !!
In my opinion, this could be a sign of an upswing, wt do u think ??
I think this is a valuable sign even though this is the weekly chart..
It would be great to write me your opinion about BTC coming weeks stats....
Disclaimer – Signal Centre. Please be reminded – you alone are responsible for your trading – both gains and losses. There is a very high degree of risk involved in trading. The technical analysis , like all indica
CAD/CHF: Long position, break outCandian Dollar/Swiss Franc formed a bearish channel in H4 timeframe and made this break out and pull back in the H4 timeframe
This it's the Daily timeframe and we supported the zone of $0.7400 CHD like key support strong in Daily chart as bull continue climb the price.
But now, in H1 we pass the pull back confirmed and I think that CAD/CHF will go bulish now.
I entry right now in the price of $0.7471 CHF, Stop Loss to $0.7445 CHF (24 pips) and target to $0.7552 CHF (83 pips)
I hope that
Bitcoin – eyes on this key level!Hello, everyone!
Bitcoin continues sideways with the multiple short squeezes. Will it finally go to the downside to $15k or we will see the bounce? Let’s look in details!
Let’s take a look at the BTCUSDT chart of the WhiteBIT exchange. I applied the Williams fractals indicator to the chart and marked the key fractal. This fractal defends the downtrend on the 4h timeframe. it’s breakout (with the obligatory candle close) will lead to local trend change to the uptrend. In case of successful brea
EURUSD UpdateI mentioned earlier that I missed my entry this morning, but this is how my trade would be progressing. This is the "trend mode" setup to my automated strategy I'm working on, I rely on the alligator as well as a slow and fast ma with dynamic profit targets (in pips) projected below the fast average. Entry comes when price is within 20 pips of the jaw line. In short positions take profit automatically if price closes the above the fast ma or if price touches the lowest profit target. This looks
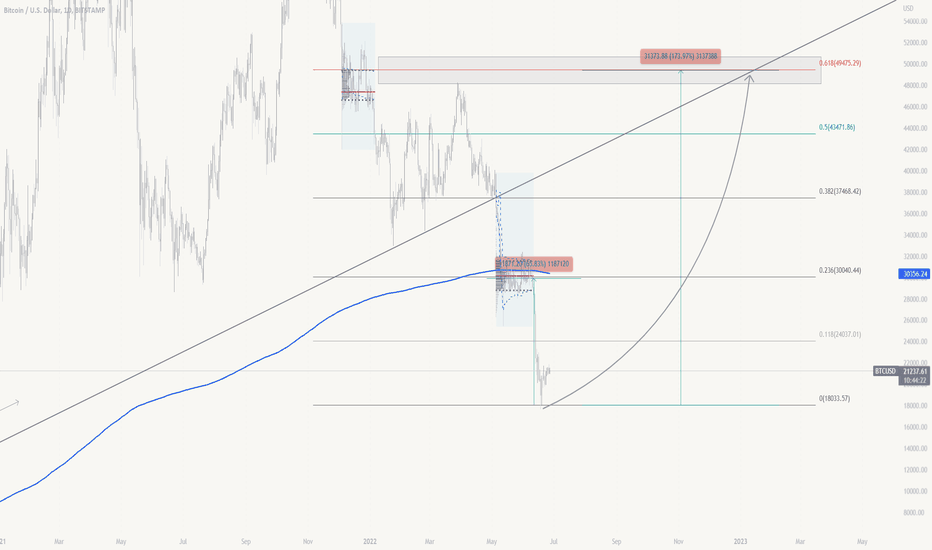
BTCUSD and 3 year EMAThe history of maximum movements under the EMA. The purpose of the study is to study the maximum values of the decline from the 3-year moving average. As you can see, the asset three times in its history had a deviation from the 3-year EMA of more than 20% and each time made a correction to the 0.618 fibo zone.
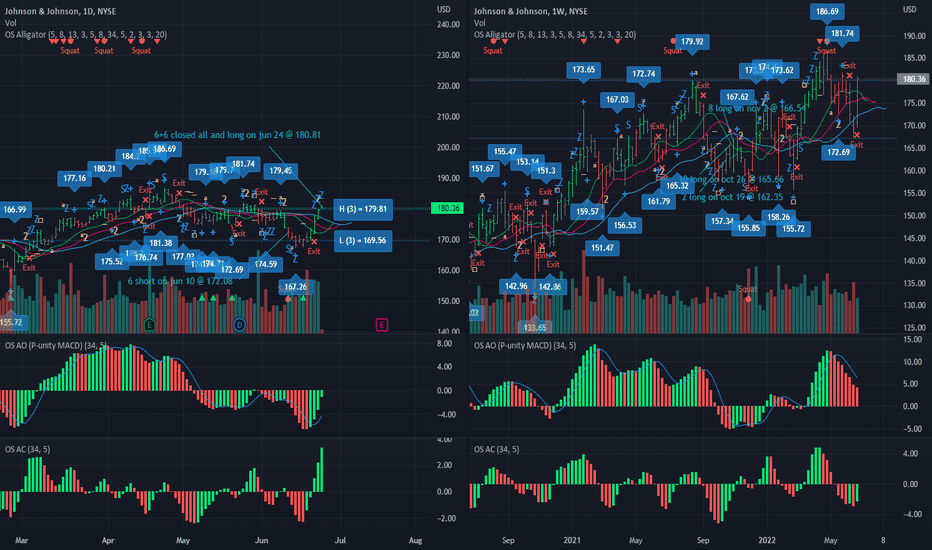
Long JNJ @ 180.81: Fractal breakoutThis was initially a short position. Both daily and weekly alligators have been asleep and wandering aroung the balance line for some time.
The short position was closed and reversed today to the long side @ 180.81 after breaching the last upside fractal of 179.45.
Adding on if price reaches the weekly fractal of 181.74.
Both stop loss and target is whenever price closes below the daily BL.
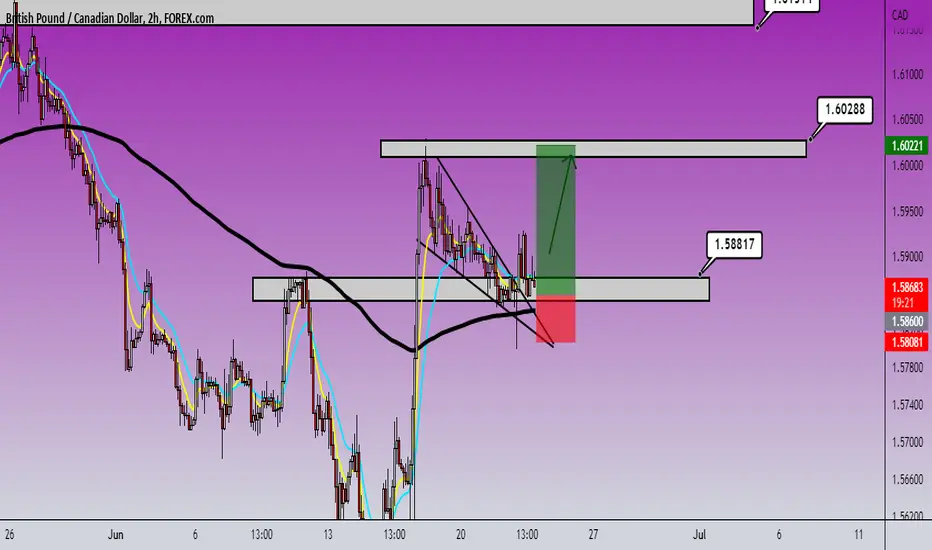
GBP/CAD: Sterling Pound in the bought zoneGreat Britain Pound/Canadian Dollar it's in the bought zone and I see a long position to entry.
This it's the H4 and I identify that GBP/CAD it's in the key support zone that I watch now. The EMA 200 work as support in the price action.
I put a buy order limit to $1.5860 CAD and Stop Loss to $1.5808 CAD and target to $1.6022 CAD
Good luck!!!
SPX: Being SQUEEZED! Strategies for a BREAKOUT!Hello traders and investors! Let’s see how the SPX is doing today!
First, in the 1h chart, we see that it is still below the key point at 3,810 (purple line), while the 21 ema keeps going up, squeezing the price more and more against the purple line, as time passes.
If the index loses its 21 ema, the gap at 3,694 would attract the price, and it could go even lower, maybe to the 3,636 again (green line). On the other hand, if we break the 3,810 it is easy to see the index filling the upper gap
VET/USDThis is a longterm analysis of a possible 3 year outlook for VET/USD using the 1 week chart.
Here is a closer look at this VET/USD 1 week Chart.
On this 1 week timeframe, VET has been back above its Least Squares Moving Average (LSMA) since the week of 7th March 2022. Note that a weekly close ABOVE the LSMA is considered a BUY SIGNAL for this indicator.
VET is also back ABOVE its Bollinger Bands Middle Band Basis 20 Period SMA for this 1 week timeframe. Note that the Upper and Lower Bands a
V
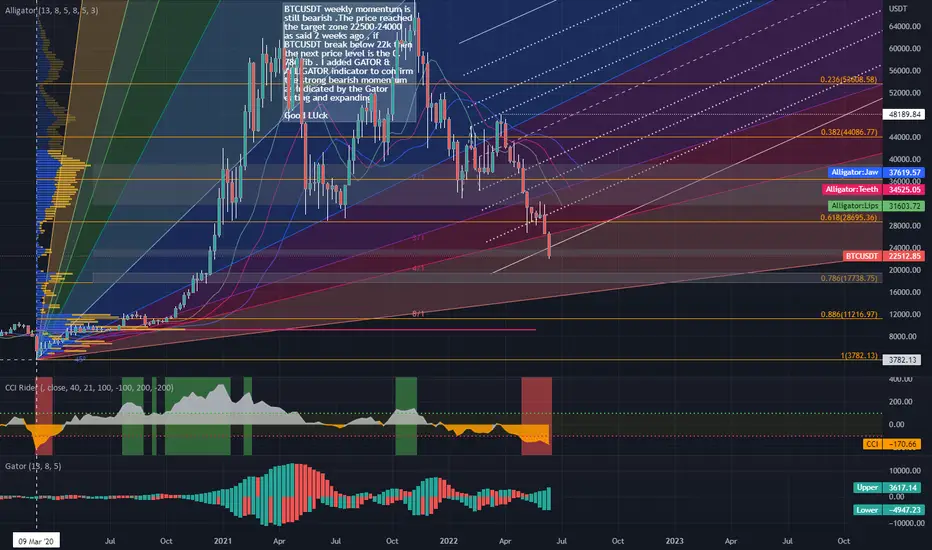
BTCUSDT STRONG BEARISH MOMENTUN UPDATE BTCUSDT weekly momentum is still bearish .The price reached the target zone 22500-24000 as said 2 weeks ago , if BTCUSDT break below 22k then the next price level is the 0.786 fib . I added GATOR & ALLIGATOR indicator to confirm the strong bearish momentum (the Gator is eating and expanding).Weekly still bearish until the Gator in sated phase
Invalid if price breaks 34243
Good LUck
NVDA: Doing as we planned! How to proceed from here?Hello traders and investors! Since my last update, NVDA is doing exactly as expected. Let’s see what to expect from here.
First, in the 1h chart, NVDA broke our line at $ 182.90, and it kept going up, as the momentum was clearly bullish. Since then, it seems NVDA lost its strength, but as long as we stay above the $ 182, it won’t reverse and turn bearish again.
The 21 ema is flat, and this means congestion. In my view, this is a sideways correction, before it resumes the next bullish leg, but
#EURUSD it's possible to buy#EURUSD waiting for retracement and Price trading in nearby 4hr support area and waiting for bullish candlesticks formed it will take entry for above the bullish candlestick and it will go for the next level of resistance
Why we like it:
Price is trading in nearby 4hr support area
Waiting for bullish candlesticks formed
possible to move the next resistance area
waiting for retracement
1st support:
1.03361
Next Zone area & horizontal swing Low support
1st Resistance
1.08609
Zone area & hori