Long
Long
Long 
 Short
Short
 Long
Long
 Long
Long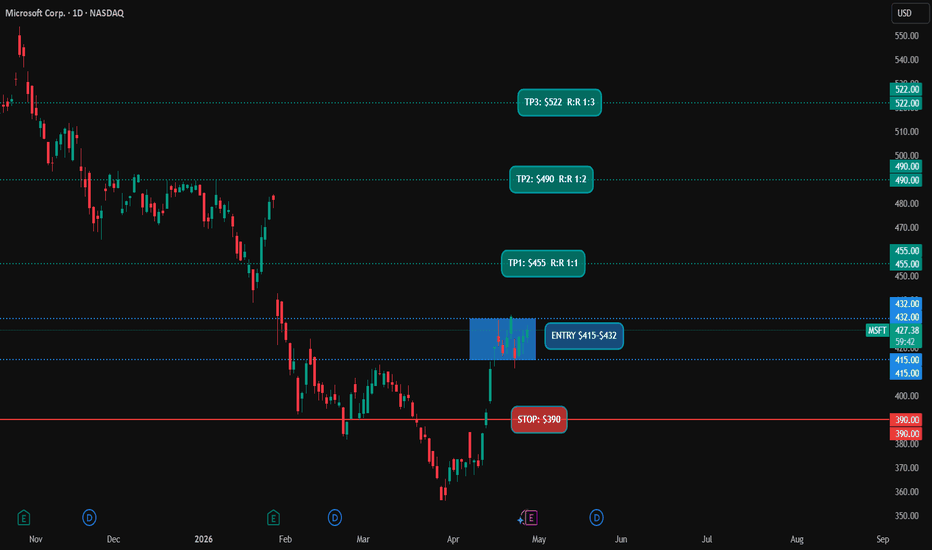
Descending Trendline Breakout – Bullish Targets Ahead Price has decisively broken above a strong descending trendline that had been acting as dynamic resistance for an extended period, indicating a clear shift in market structure. This breakout suggests that sellers are losing control while buyers are stepping in with increased momentum.
Before the breakout, price was consolidating near a well-defined demand zone, showing signs of accumulation. The move above the trendline confirms bullish intent, especially as price is now attempting to hold above this level—potentially turning previous resistance into new support.
If this structure holds, the market is likely to continue its upward move toward the next key resistance levels marked as targets at 187.311 and 187.707. These zones represent areas where price may face reactions, but a strong bullish push could lead to continuation beyond them.
Overall, as long as price maintains support above the broken trendline and continues forming higher lows, the bullish outlook remains valid. Any rejection or breakdown below the trendline, however, could signal a false breakout and shift the market back into consolidation or bearish pressure.  Long
Long
EUR/USD — Weekly Outlook | Multi-Timeframe Analysis Macro Bias: 📅 Monthly Timeframe
Price has decisively rejected from a well-defined monthly supply zone, compounded by confluence with a significant Fair Value Gap (FVG) and a major psychological round number. The most recent monthly candle closed below its predecessor, confirming that the macro structure remains bearish. The current price movement should be read as a corrective retracement within a broader downtrend, not a reversal.
📅 Weekly Timeframe
On the weekly chart, price swept the liquidity resting above the prior range and promptly rejected from a weekly supply zone aligned with the 1.18500 round number — a level that carries significant institutional weight. This rejection followed a prior Break of Structure (BOS), which validates the corrective nature of the recent rally.
With the monthly and weekly biases aligned to the downside, two scenarios are now in play:
Scenario A (Higher Probability): Price revisits the high of the latest weekly candle's upper wick — a standard liquidity target — before sellers reassert control. This is supported by the fact that the candle closed above the previous candle's wick, suggesting a near-term wick-fill is likely.
Scenario B: Direct bearish continuation without a wick revisit, contingent on daily confirmation.
The weekly close will be the deciding factor.
📅 Daily Timeframe
The daily chart clarifies the picture. Price rejected simultaneously from both the weekly and daily supply zones, and the most recent daily candle swept the liquidity from the prior candle's low — a bearish confirmation signal. A round number rejection adds further weight to the downside case.
Expected path: Price declines into the lower daily FVG, where a temporary reaction may develop. From there, a corrective bounce toward the weekly wick high is possible. Should price reach that level and show bearish rejection, the higher-timeframe downtrend is expected to resume toward lower structural targets.
⏱ H4 Timeframe
The H4 structure supports the roadmap above. The preferred approach is to monitor for intraday FVG formations on the H1 chart as potential entry triggers, targeting the lower daily FVG. If price closes above that daily FVG rather than rejecting it, the corrective bounce toward weekly liquidity becomes the primary scenario.
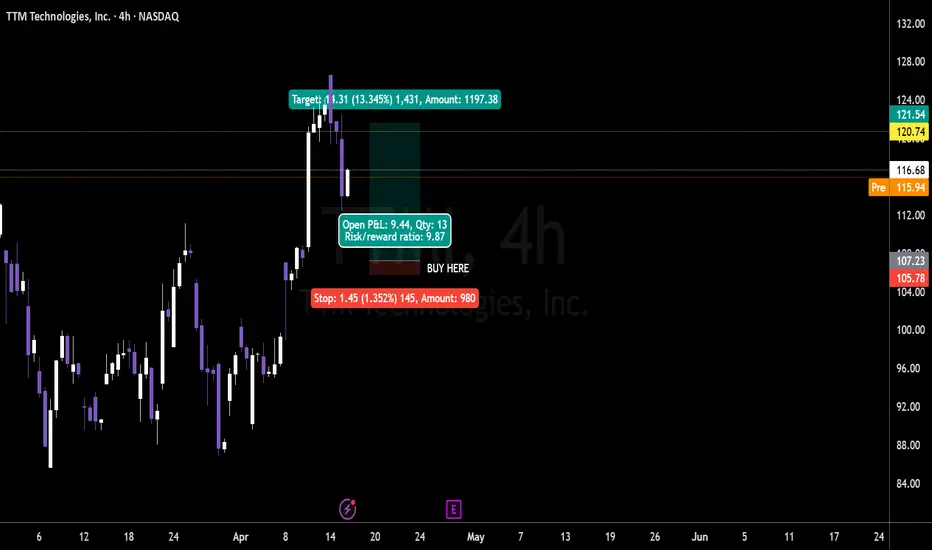
As long as price trades below the higher-timeframe supply cluster, rallies remain corrective in nature and should not be mistaken for trend reversals. TTMI High‑Conviction Pullback Into 4H Demand With 10R Upside PotTTM Technologies is showing a clean higher-timeframe setup after a strong move, with price pulling back into a defined weekly demand area near the 4h structure on your chart.
The business backdrop is constructive as well: FY2025 net sales came in at $2.906 billion, non-GAAP EPS reached $2.46, and Q4 2025 revenue was $774.3 million with A&D backlog at $1.61 billion.
The stock is currently trading around the $116 area on your chart, after tagging the recent highs and then retracing into a technically important zone. TTM’s FY2025 results also showed improving profitability and leverage, with non-GAAP operating margin at 11.7% and net debt/EBITDA down to 0.9x, which supports the case for institutional accumulation on weakness.
Analyst sentiment is supportive, with Public showing a Strong Buy consensus as of mid-April 2026, and the company has a Q1 2026 conference call scheduled for April 29, 2026.
🟢 Buy Zone 1 ($107.23 area)
Top of the blue demand shelf on your chart and the first area where buyers have already defended price.
Stop: $105.78
Position risk: $980
Qty: 13
Risk/Reward Ratio: 9.87
Target: $121.54
🟢 Buy Zone 2 ($96.00 area)
Deeper weekly support and a cleaner value area if the first zone fails.
Stop: $92.00
Position risk: $980
Qty: 13
Risk/Reward Ratio: 13+
Target: $124.00
Key Levels:
🔑 Current Price: $116.60
🔑 Buy Zone 1: $107.23 | Stop: $105.78
🔑 Buy Zone 2: $96.00 | Stop: $92.00
🔑 Recent High: $121.54
🔑 FY2025 Revenue: $2.906B
🔑 FY2025 Non-GAAP EPS: $2.46
🔑 FY2025 Net Debt/EBITDA: 0.9x
🔑 FY2025 A&D Backlog: $1.61B
🔑 Strong Buy Consensus: 100% on Public
🎯 Target 1: $121.54
🎯 Target 2: $124.00
TTM is not a story stock, it is a cash-generative industrial technology name with improving margins, lower leverage, and a strong defense/data-center mix. The setup is simple: if the weekly demand holds, the pullback looks like a normal continuation entry rather than a trend break.  Long
Long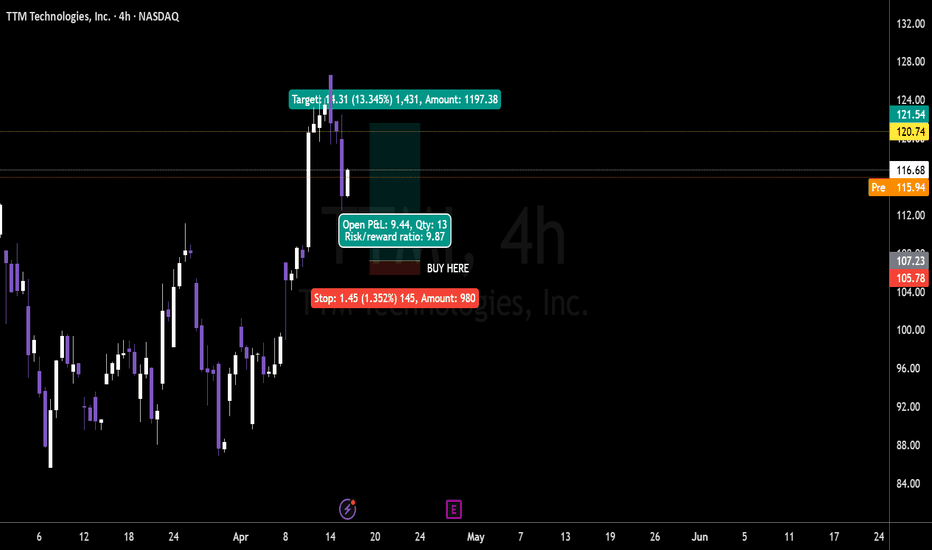
JUP: coiled spring or breakout? key levels to watch this weekJUP
Who’s still watching this thing chop around while the rest of the market rotates into new hype coins? Recently, according to industry sources, JUP has stayed on traders’ radars after the airdrop buzz and ongoing ecosystem talk, but price hasn’t followed with any explosive move yet. That combo of fading headlines and tight range is usually where the next decent swing hides.
On the 4H chart, price is sitting right in the mid green demand zone around 0.16 with RSI glued near 50, so we’re clearly in “coiled spring” mode. I’m slightly leaning bullish: repeated defenses of this support plus visible volume build in the same area tell me smart money is quietly accumulating, aiming for a run back into the red supply band above 0.17. I might be wrong, but as long as buyers hold this green box, I treat every dip into it as a potential reload, not panic fuel.
My base plan: ✅ look for a long setup between 0.158–0.162 with a target into 0.17–0.172 where the last sharp rejections came from. If this green zone fails and we get a clean 4H close below 0.158, I’m flipping the script and watching for a slide toward the next big demand area near 0.15 and even 0.14. I’m flat for now, just stalking the range breakout and ready to trade whichever side finally wins. BONK: coiled spring or fading meme? key levels for todayBONK
Anyone else watching this meme dog try to break its leash again? According to market chatter, Solana meme coins are back on the radar after fresh inflows into the ecosystem, and BONK is one of the usual suspects whenever liquidity rotates into the “degen” pocket. Today we saw buyers step in again right around the same demand zone that held last week.
On the 4H chart, price is ping‑ponging inside that orange mid‑range, sitting just above the green support band. RSI is mid‑50s, so not overbought yet, and the last dip into demand was bought up quickly with decent volume. My base view here is upside from this range, targeting the first red supply block above where we’ve seen repeated rejection wicks.
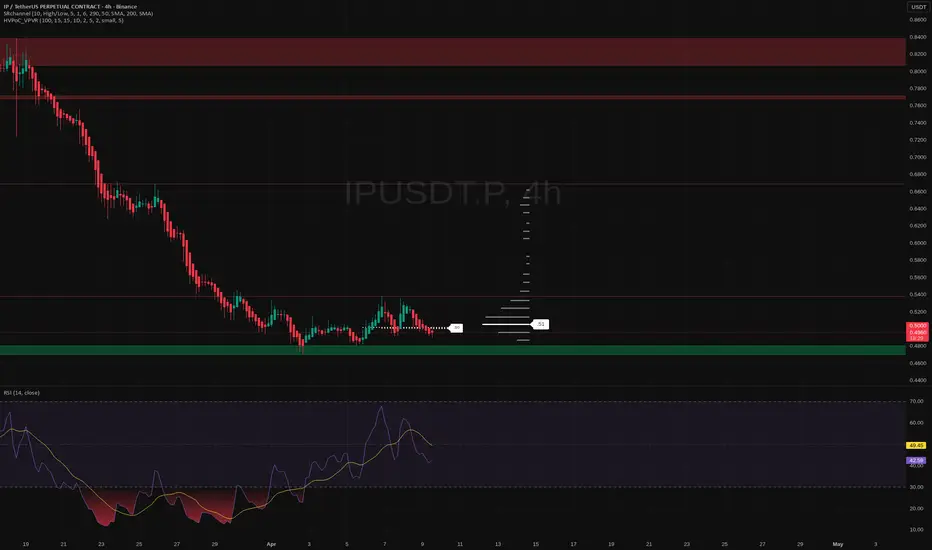
Game plan: I’m interested in longs while price holds above the green zone, with potential targets at the lower and mid red bands. If we lose that green support and start closing 4H candles below it, I’ll flip the script and look for a fade down to the next volume pocket. I might be wrong, but for now BONK still looks more like a coiled spring than a dead meme. ✅ IP: waiting for a move? key levels and targets to watchIP – bored watching it crab at the lows and wondering if it’s loading for a move? After the latest pullback across alts, this one has been quietly holding a chunky demand zone around 0.46 while funding and hype cooled off. According to market chatter, liquidity is rotating back into smaller caps again, so anything that survived the flush without breaking support stays on my radar.
On the 4H chart, price is sitting right on that green demand block with RSI curling up from the low 40s – classic “either bounce or die” spot. I’m leaning bullish from here, expecting a squeeze toward the 0.51 first liquidity pocket and potentially laddering higher if buyers step in. Horizonal volume thins out above, so if it starts running, empty air can get filled fast.
My game plan: ✅ look for a clean 4H close back above 0.50 with rising volume, then I like longs toward 0.51 and beyond. If we lose the green zone with a strong 4H close below ~0.46, idea’s invalid and I’d rather sit out and wait for a deeper discount. I might be wrong, but this looks like one of those spots where smart money quietly accumulates while everyone else has notifications off. I

Sei: ready for a breakout? key levels to watch this weekSei
Who else is watching this little L1 try to wake up again? According to the market, Sei keeps popping up in narratives around faster trading infra, and we just had a small sentiment boost after fresh ecosystem updates and volume coming back on majors. Price reacted with a sharp push into that red supply band, and now we’re cooling off right under it.
On the 4H, price is stuck between a local resistance zone around 0.056–0.058 and a chunky demand block sitting just above 0.05 where the volume profile spikes. RSI is mid-range with no major divergence, so I’m treating this as a healthy pause after an impulse, leaning slightly bullish as long as that green zone holds. If buyers step back in near 0.05, I expect another attempt to squeeze through the overhead red zone.
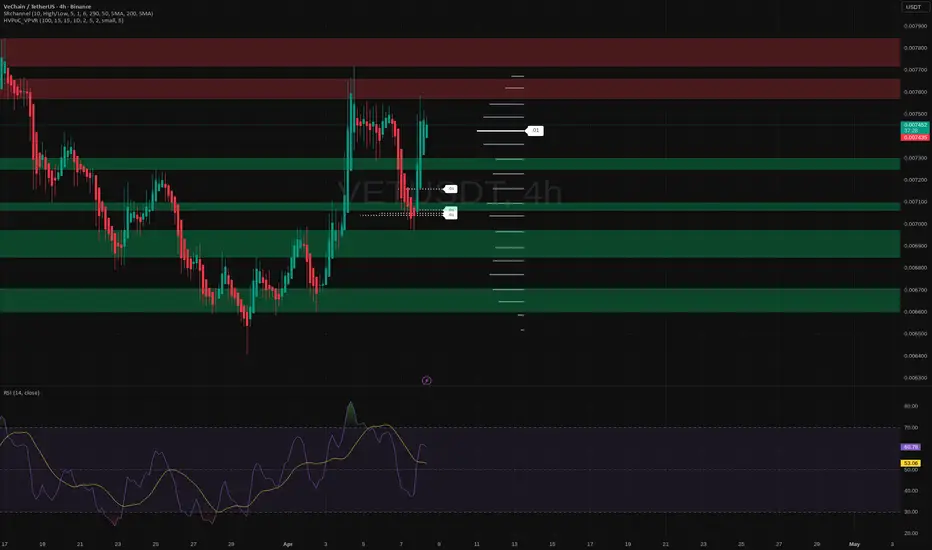
My plan: I like staggered bids around 0.052–0.05 with a tight invalidation below the lower green support. ✅ Base case for me is a grind back toward 0.06 and, if that breaks with volume, extension into the higher red supply area above. If 0.05 snaps clean, then I step aside and let it bleed lower – I might be wrong, but I don’t argue with broken support. VeChain: is this the dip to buy? key levels for todayVeChain. Who else is watching this dip after the recent pop in altcoins? While majors cool off after the latest macro jitters and mixed risk‑on sentiment, VET is quietly parking inside a chunky demand zone according to market chatter, with ecosystem news still supportive of the long‑term story. Volatility is back on the 4H and that’s usually when VET likes to move hard.
On the 4H chart we just bounced off that green demand block around 0.0069 with RSI curling up from near oversold, right where the high‑volume node sits. For me that tilts the odds to the upside, targeting the mid green zone first, then the red supply area above if buyers really step in. Structure still looks like a corrective pullback after the impulse up, not a full trend reversal... yet.
My base plan: as long as price holds above the 0.0068‑0.0069 support, I treat dips into that zone as potential longs, with a first take‑profit near the middle green band and stretch targets into the red zone. If we lose that support with strong volume, I stand aside and let it bleed toward the lower demand area before thinking “buy the blood” again. I might be wrong, but ignoring clear levels usually costs more than missing one trade ✅ Cosmos: is ATOM ready to surprise? key levels for todayCosmos
Who’s still watching ATOM while everyone chases the shiny new narratives? Lately the ecosystem has been under pressure as funding and governance talks keep popping up, and according to industry sources sentiment is still pretty cautious. Today price is stuck in a boring range, but ranges are where the next big asymmetric move usually loads.
On the 4H chart, ATOMUSDT is sitting just above that green demand box around 1.63‑1.66 with RSI hovering near neutral, so sellers are slowing but buyers aren’t in full control yet. VPVR shows the main volume node right around 1.70, and we keep getting rejected from the red supply zone overhead, so I’m leaning short term long from support back into that 1.72‑1.78 pocket. If fresh positive headlines hit the sector, this tight base can turn into a squeeze pretty fast.
My game plan: ✅ Look for a dip into the green zone to build a starter long, targeting the 1.75‑1.85 resistance band. Invalidated for me if we close below 1.60, which opens the door to a deeper flush. I might be wrong, but as long as price respects this demand, I’m treating ATOM as a quiet accumulation play while everyone else sleeps on it. Arbitrum: key targets and levels as demand zone holds strongArbitrum
Who’s watching this L2 while everyone chases memecoins? According to market chatter, Arbitrum keeps getting dev attention and ecosystem grants, but short term the token has been lagging majors. Today price dipped back into a key demand area while BTC volatility cooled, which is often where rotation plays quietly start.
On the 4H chart, ARB is sitting right on that green demand block around 0.90 where the volume profile shows a fat node of past activity. RSI has cooled off from overbought and is hovering midrange, which for me is a “reload, not panic” signal. I’m leaning long from this zone, looking for a bounce toward the upper red supply area near recent highs as sidelined buyers step back in.
My game plan: accumulate inside the green zone with invalidation below the lower demand band. Base case, we rotate up toward the local resistance cluster above, then reassess. If price breaks and holds below demand, I flip the script and look for a deeper sweep of liquidity before touching longs again. I might be wrong, but ignoring levels like this is how traders end up buying the top instead of the dip. Skycoin: hidden gem or fading star? key levels for todaySkycoin. Still alive and grinding or just another ghost chart? While majors are stealing the headlines, this small cap has been quietly consolidating as liquidity slowly comes back into alts, according to industry sources. Lately, sentiment around older infrastructure projects has improved and you can see it in these little pops on forgotten pairs.
On the 4H chart, price is bouncing out of the green demand zone around 0.070 with RSI pushing up from mid levels, showing fresh buyers stepping in. I’m leaning bullish as long as we hold above that demand, looking for a drift back into the red supply band near 0.078 where the last big wick got slapped down. Volume is still modest, so any sudden spike could fuel a quick face-ripper move instead of a slow grind.
My base plan: accumulate only on dips into 0.071‑0.072 and trail it toward 0.078‑0.080, where I’ll look to de‑risk. If 0.070 gives way on a 4H close, I treat it as a failed setup and expect a slide back to the lower green box around 0.066. I might be wrong, but for now this looks like one of those quiet charts that move just when everyone stops watching. ✅

 Long
Long