Short
Short
Gold Futures Update: Price Action Squeezed Inside Tight TriangleGold Futures ( COMEX:GC1! - COMEX) is displaying a classic volatility compression framework on the Daily (1D) chart, with price action tightly coiled inside a prominent symmetrical triangle.
As highlighted by the yellow circle, the precious metal is undergoing a massive liquidity build-up, indicating that a major directional expansion is approaching.
### Key Structural Clusters:
* **The Symmetrical Squeeze:** The asset is currently bound between a descending line of resistance (LTB) and a rising line of short-term support (LTA), leading the price directly toward the pattern's apex.
* **The Institutional Demand Floor (4,381 - 4,408):** The lower boundary of this triangle features exceptional technical confluence. It rests immediately on top of the critical horizontal support wall at **4,408.3** and is heavily backed by the long-term **200-period Exponential Moving Average (EMA 200 - purple line at 4,381.3)**.
* **Macro Overhead Targets:** Should buyers validate a clean structural breakout above the triangle, the primary macro resistance targets remain firmly established at the horizontal red zones of **4,787.3** and **4,901.3**.
### Tactical Outlook & Execution Strategy:
Trading inside the absolute apex of a symmetrical triangle carries a low probability for directional swing-trading due to choppy, mean-reverting behavior. The professional approach mandates waiting for a confirmed breakout:
1. **The Bullish Expansion Scenario:** A daily candle close with strong volume above the descending LTB will signal a continuation of the primary macro uptrend, offering high-odds setups to target the upper horizontal levels.
2. **The Bearish Test Scenario:** If selling pressure breaks the lower trendline, a swift flush into the 4,408 - 4,381 block is expected, where institutional order absorption will likely offer a major long defensive setup.
Patience is our edge. We will let the market break the boundaries of the apex before establishing fresh swing positions.
---
📊 **ProData Chart** | By Rogerio Zaglia
*Technical Analysis, Price Action & Global Macro Strategy.*
⚠️ **Disclaimer:** For educational and informational purposes only. This study does not constitute investment advice or trading recommendations. NVDA: Higher Highs, Higher Lows, Higher ProbabilityNVDA - CURRENT PRICE : 224.36
HIGHER HIGHS CONFIRM THE TREND. HIGHER LOWS CREATE THE OPPORTUNITY.
This is NVIDIA's year-to-date daily chart, and the price action continues to paint a bullish picture. Since establishing its late-March low, NVDA has developed a well-defined sequence of higher highs and higher lows, which is one of the clearest characteristics of a healthy uptrend. Rather than showing signs of weakness, the stock continues to attract buyers during pullbacks, allowing the bullish structure to remain intact.
What makes the current setup particularly attractive is that the latest rebound emerged from another higher-low area. Instead of chasing price near the highs, buyers stepped in during a controlled retracement, suggesting continued confidence in the broader uptrend.
Momentum also supports the bullish narrative. During both recent pullbacks, the RSI successfully found support around the 50 level before turning higher again. In strong uptrends, RSI often treats the 50 zone as a dynamic support level, and repeated rebounds from this area indicate that bullish momentum remains healthy rather than fading.
The combination of a higher-high, higher-low market structure and RSI support near 50 creates a favorable buy-the-dip environment. As long as NVDA continues to respect these higher lows, the probability favors trend continuation rather than trend reversal.
Strong trends rarely move in a straight line. They advance, pull back, find support, and then continue higher. For trend-following traders, those pullbacks often provide the best opportunities to participate in the next leg of the move.
ENTRY PRICE : 220.00 - 224.36
FIRST TARGET : 240.00
SECOND TARGET : 256.00
SUPPORT : 208.00  Long
Long
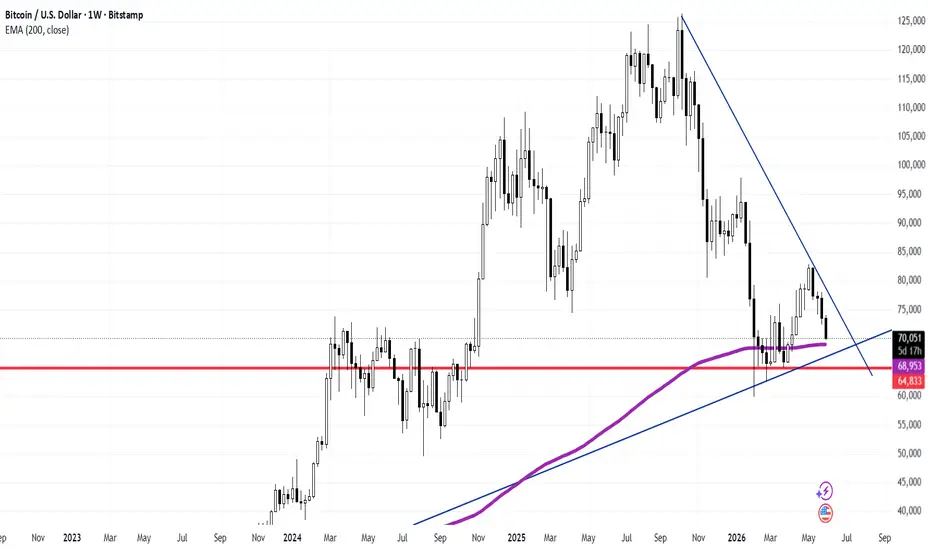
Bitcoin Weekly: BTC Tests Critical Major Confluence at the WeeklBitcoin ( BITSTAMP:BTCUSD - Bitstamp) is presenting an incredibly significant macro structural test on the Weekly (1W) chart. As long-term technical analysts, this is the exact type of high-probability confluence block we monitor for primary trend definitions.
Following a prolonged corrective cycle from its macro peaks, price action has compressed into a critical multi-layered demand territory.
### Key Macro Technical Factors:
* **The Weekly 200 EMA Baseline (68,953):** The dynamic purple baseline represents the 200-period Exponential Moving Average on the weekly timeframe, currently tracking at **68,953**. Historically, the Weekly 200 EMA serves as one of the most respected institutional floors in Bitcoin's history, acting as a definitive boundary between macro regimes.
* **The Horizontal Support Floor (64,833):** Directly beneath the dynamic average lies the vital structural support wall marked by the horizontal red line at **64,833**. This area represents a major historical liquidity pocket where long-term buyers have historically defended aggressive distribution.
* **The Trendline Compression Squeeze:** Price action is entering the final apex of a massive structural triangle, squeezed between the dominant descending macro trendline (upper blue LTB) and the primary ascending trendline (lower blue LTA).
### Strategic Outlook & Market Implications:
The intersection of the Weekly 200 EMA, the horizontal demand wall at 64,833, and the multi-month trendlines creates an exceptionally strong technical cluster.
* **The Bullish Defense Setup:** Because this zone represents deep institutional value, a clean weekly close showing deceleration (such as long lower rejection wicks or a bullish engulfing pattern) will confirm that the smart money is absorbing the supply, establishing a solid launchpad for the next macro expansion leg.
* **Risk Management Caution:** Conversely, any decisive weekly candle acceptance below the 64,833 support floor would invalidate this immediate accumulation thesis, opening the path for a deeper structural correction.
### Professional Execution Plan:
Chasing short positions directly into a rising weekly 200 EMA and historical horizontal support carries a highly unfavourable risk-to-reward ratio. The professional playbook requires monitoring lower timeframe structures (Daily or H4) inside this current high-value cluster, waiting for verified accumulation patterns or structural shifts (CHoCH) to position alongside primary institutional order flow.
---
📊 **ProData Chart** | By Rogerio Zaglia
*Macro Technical Analysis & Global Asset Research.*
⚠️ **Disclaimer:** For educational and informational purposes only. This study does not constitute financial advice or an investment recommendation. Past performance is not indicative of future results.  Long
Long
PATH - Hits Previous Targets, Fresh Buy Signal ActivatedPATH - CURRENT PRICE : 13.10
My previous PATH buy call has successfully achieved both upside targets. For those interested in reviewing the earlier analysis and setup, the previous report link has been shared for reference.
Following the recent price action, PATH has generated another bullish technical setup. The stock has decisively broken above its sideway consolidation resistance, signaling renewed buying interest after several months of accumulation. More importantly, the breakout occurred together with a move above the EMA200, which often indicates a potential shift from a bearish trend to a bullish trend.
Momentum indicators are also supporting the bullish outlook. The MACD has crossed higher and continues to expand positively, suggesting strengthening upside momentum. In addition, the breakout was accompanied by increased volume, indicating participation from buyers rather than a low-conviction move.
As long as PATH remains above the support level at USD11.20, the bullish bias remains intact. The first upside target is USD15.00, while the second target is USD17.00, representing the next major resistance zones on the chart.
Overall, the successful breakout above both the sideway resistance and EMA200, combined with improving MACD momentum, suggests PATH may be entering a new medium-term uptrend phase. Traders may consider maintaining a bullish stance while the stock holds above the USD11.20 support level.
ENTRY PRICE : 12.80 - 13.10
FIRST TARGET : 15.00
SECOND TARGET : 17.00
SUPPORT : 11.20  Long
Long
USDJPY Daily: Educational Case Study on the Power of the 200 EMAIn this technical analysis case study, we analyze the U.S. Dollar / Japanese Yen ( FX:USDJPY ) on the Daily Chart to visually demonstrate the immense structural power of the 200-period Exponential Moving Average (EMA 200) when combined with a major Ascending Trendline (LTA).
As technical analysts and institutional traders, we must always respect these critical macro intersections. The market's memory at these specific zones offers some of the highest-probability setups in professional trading.
### The Anatomy of Institutional Defense (Red Circles):
The two red highlights on the chart show a repeating, textbook behavior of how smart money utilizes dynamic value layers:
1. **The First Confluence Test (Jan/Feb):** Following a steep corrective phase, USDJPY drifted lower into the apex where the rising green LTA converged with the purple EMA 200 line. Notice the immediate reaction: robust bullish rejection wicks followed by strong, institutional size green candles, signaling heavy demand absorption.
2. **The Second Confluence Test (May):** History repeated itself with absolute mathematical precision. A sharp liquidation drop swept lower-timeframe stops, checking into the exact same structural confluence zone. Once again, long lower wicks and aggressive expansion buyers stepped in right after the touch, driving the exchange rate all the way back to the major **160.635** horizontal resistance ceiling.
### Professional Takeaways:
* **The 200 EMA as an Institutional Baseline:** The 200 EMA close (purple line) is not just a lagging indicator; it acts as a macro line in the sand for funds and commercial banks to reposition within a dominant trend.
* **Confirmation via Price Action:** Watching the moving average is only half the battle. The true validation comes from the *immediate candle response after the touch*. Strong daily bullish closes following a retest confirm that the dominant buyers are actively defending their territory.
### Trading Application:
Never short blindly into a rising 200 EMA conflux, and never chase a rally when it is overextended from it. The professional edge lies in identifying these structural clusters, waiting for the dynamic retest, and executing orders alongside institutional order flow once bullish momentum is verified.
---
📊 **ProData Chart** | By Rogerio Zaglia
*Technical Analysis, Price Action & Global Macro Strategy.*
⚠️ **Disclaimer:** For educational and informational purposes only. This study does not constitute investment advice or trading recommendations.  Long
Long
S&P 500 Daily: Overextended Trends Encounter Channels & HistoricThe S&P 500 Index ( SP:SPX / $SPCFD) continues its powerful bullish expansion on the Daily Chart, but vital structural metrics suggest technical exhaustion is quietly building up under the hood.
### The Technical Framework:
* **The Ascending Regression Channel:** Since the major dynamic bottom established in April, price action has been strictly respecting a rising green parallel channel.
* **Short-Term Trajectory:** After successfully defending the lower boundary of the channel in late May, the index is attempting a localized bounce toward the upper boundary (indicated by the blue arrow). However, severe resistance looms near the channel's ceiling.
* **The 200 EMA Extension Metric:** The 200-period Exponential Moving Average (purple line) is currently floating near **6,796**. At current market prices, the S&P 500 is trading at a significant **10% premium (overextension)** above its long-term baseline.
### Historical Context & Macro Caution:
From an analytical and realistic perspective, while the immediate momentum appears bulletproof, chasing new long positions here presents a highly unfavorable risk-to-reward ratio.
Historically, during major fundamental catalysts (such as past policy and tariff announcements), we observed this extension stretch up to a maximum threshold of **15%** before trigger-heavy capitulations or sharp mean-reversion corrections occurred. At a 10% extension today, the margin for safety is rapidly shrinking.
### Strategic Execution Plan (The Rotational Sequences):
The red arrows on the chart illustrate the impending technical threat:
1. **The Tactical Drive (Blue Arrow):** A final, lower-volume liquidity sweep targeting the upper channel boundary.
2. **The Dynamic Rejection (Red Arrows):** As the price approaches the upper parallel resistance, institutional profit-taking is highly expected to trigger a rotational phase back toward the channel floor or launch a broader, overdue corrective drive back down to test the **EMA 200 support**.
### Professional Takeaway:
Patience is the defining edge right now. The smart money approach mandates caution on fresh long entries at these elevated heights. The optimal technical play is to wait for a verified structural daily correction toward the moving averages to look for sustainable demand absorption.
---
📊 **ProData Chart** | By Rogerio Zaglia
*12+ years of daily global market technical analysis.*
⚠️ **Disclaimer:** This analysis is for educational and informational purposes only. It does not constitute financial advice or an investment recommendation. Past performance is not indicative of future results. Euro Stoxx 50 Daily: Price Nears Key Confluence of Ascending TreThe Euro Stoxx 50 Index ( TVC:SX5E / FOREXCOM:EU50 ) is presenting a clean technical corrective structure on the Daily Chart, drifting lower toward a well-defined confluence zone where buyers are expected to re-emerge.
Following a strong bullish expansion, the index is experiencing a healthy mean-reversion phase, offering a highly readable environment for swing traders tracking European benchmarks.
### Key Technical Factors:
* **The Aggressive Ascending Trendline (LTA):** A steep green support line is climbing rapidly, acting as the immediate dynamic floor for the medium-term bullish momentum.
* **The Fibonacci Retraction Framework:** Drawn from the recent structural swing, the price is currently battling near the **0.236 Fibonacci level (6,047.0)**. A minor extension lower points directly to a test of the **0.382 level (5,986.3)**, which perfectly intersects with the rising LTA.
* **The Macro Support & EMA 200:** Should the corrective phase accelerate, a massive structural floor is located lower at the **1.0 Fibonacci level (5,729.0)**. This static level aligns seamlessly with the long-term **200-period Exponential Moving Average (EMA 200 - purple line at 5,739.3)**.
* **Overhead Target Wall (6,194.4):** The historical macro resistance remains firmly established at the **6,194.4** horizontal red line.
### Strategic Scenario & Execution Plan:
The dashed trajectory line on the chart illustrates a classic technical retest sequence:
1. **The Downside Drift:** Short-term selling pressure is leading the price to interact with the intersection of the green LTA and the internal Fibonacci retracements (between 6,047 and 5,986).
2. **The Bullish Reaction:** Because this area represents a structural cluster, it is a high-probability zone for buyer absorption. A clean hold here opens the path to target a retest of the major 6,194.4 overhead resistance wall.
We will monitor lower timeframes (such as H4 or H1) as the price enters this confluence zone, looking for deceleration signs or a structural shift (CHoCH) to define a tight, low-risk long entry.
---
📊 **ProData Chart** | By Rogerio Zaglia
*12+ years of daily global market technical analysis.*
⚠️ **Disclaimer:** This analysis is for educational and informational purposes only. It does not constitute financial advice or an investment recommendation. Past performance is not indicative of future results.  Short
Short
 Short
Short
 Short
Short
XAUUSD 15M — Aligned Bearish Deepens, $4,484 Below EMA200May 20 Cross-Asset SMC Read
Gold's bearish alignment continues to deepen. Since flipping to aligned SHORT on May 4, Gold has not looked back — dropping from $4,562 through $4,666 (May 11) and now to $4,484. That is nearly $80 of additional downside in nine days.
Price remains firmly below the EMA200 ($4,520), and the 15M structure shows a clean series of bearish BoS labels. The most recent session saw a drop to the $4,440 area before a modest bounce into London. No bullish structural shift in sight.
Signal: Below EMA200 + Bearish Structure = Aligned SHORT
Key Levels:
• Resistance: $4,520 (EMA200), $4,540–$4,550 (prior consolidation)
• Support: $4,460 (session low zone), $4,440 (swing low)
Context: Gold has maintained aligned SHORT status for three consecutive readings now — the longest sustained alignment this asset has shown in our 7+ week tracking window. The trend is clear until structure flips.  Short
Short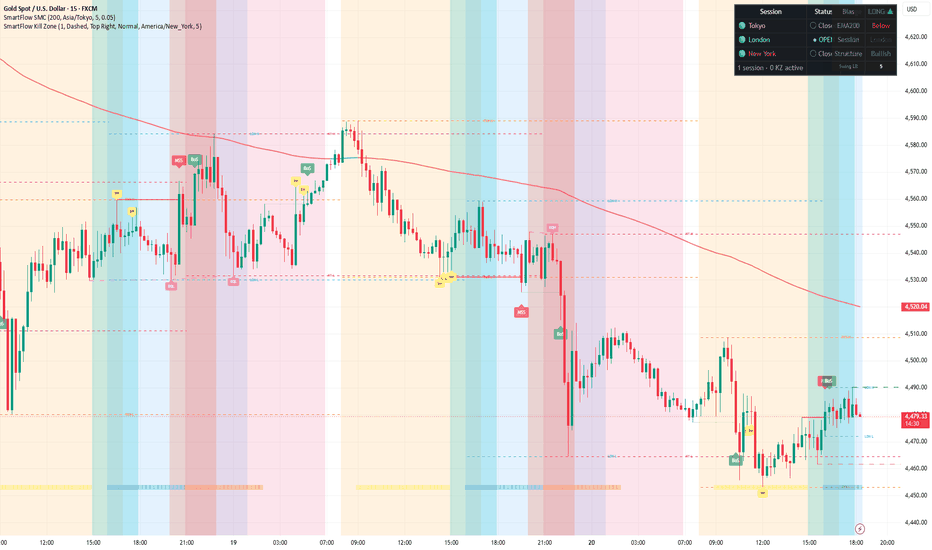
 Long
Long
 Long
Long