Exponential Moving Average (EMA)
GOLD SELL SETUP | 1H TIME FRAMEGOLD SELL SETUP | 1H TIME FRAME
Gold has broken below the key support level and is now approaching a potential retest of the resistance zone around 4035. If price rejects this area, it may present a selling opportunity in line with the current market structure.
Adding to the bearish outlook, the EMA 9 is crossing below the EMA 20, confirming weakening bullish momentum and supporting the bearish bias.
Sell Zone: 4035 (Resistance Retest)
Technical Targets:
- Target 1: 4025
- Target 2: 3991
-
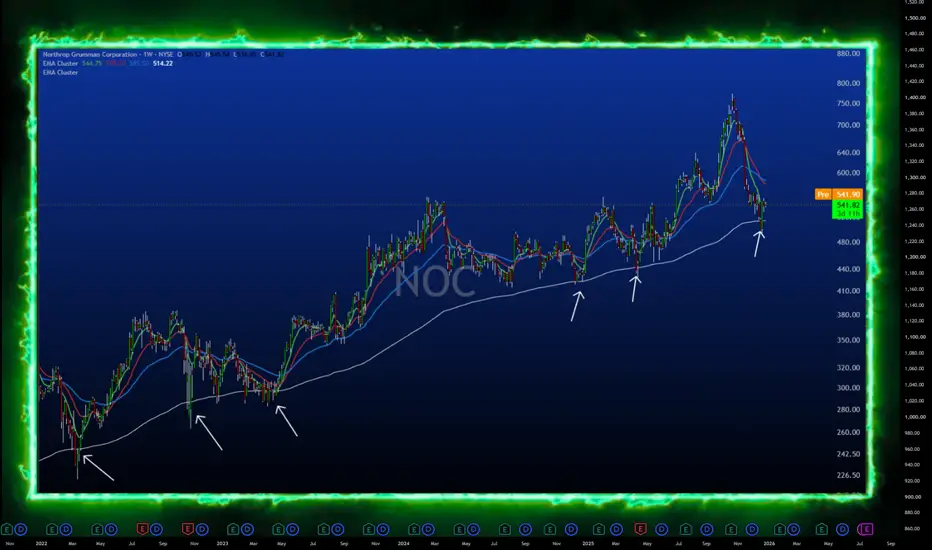
NOC trades at $541.82, sitting 0.8x weekly ATR from its 200-weekNOC trades at $541.82, sitting 0.8x weekly ATR from its 200-week EMA. That distance places it inside the defined buy zone (≤1x ATR from the 200W EMA), well short of extended (≤4x). The 200-week EMA is up 21% over the last two years and still rising.
Gate 1, trend A rising 200W EMA with price pulled back to touch it, not through it, is the structural definition of an intact long-term uptrend resting at support rather than breaking down. That's the first gate, and it's confirmed here.
Gate 2, mo
Euro / US Dollar ($EURUSD) Daily: Near-Term Relief Pullback Euro / US Dollar ( OANDA:EURUSD ) Daily: Near-Term Relief Pullback Toward 200-EMA Prior to Macro Fibonacci Expansion Leg
### 🇪🇺🇺🇸 Euro / U.S. Dollar ( OANDA:EURUSD ) Daily Technical Matrix (Ref: EURUSD_2026-07-08_09-41-20.jpg)
We are releasing a dual-horizon tactical brief on the EURUSD currency cross on the Daily (1D) interval. While the high-timeframe structural regime remains heavily anchored in a bearish markdown model, the pair is currently signaling near-term internal deceleration, creati
British Pound / US Dollar ($GBPUSD) Daily: Cable Sits at Major 2British Pound / US Dollar ( OANDA:GBPUSD ) Daily: Cable Sits at Major 200-EMA & Trendline Junction – Mapping the Two-Way Breakout Matrix
### 🇬🇧🇺🇸 British Pound / U.S. Dollar ( OANDA:GBPUSD ) Daily Technical Update (Ref: GBPUSD_2026-07-07_08-35-38.png)
We are deploying a high-stakes structural study on the GBPUSD currency pair on the Daily (1D) time matrix. The "Cable" has arrived at an absolute technical decision point, consolidating directly inside an institutional moving average cluster and
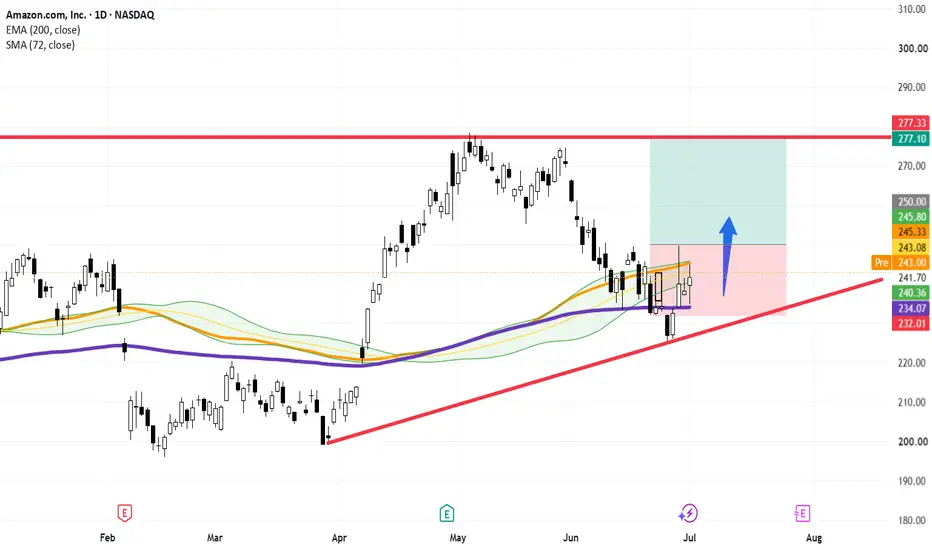
Amazon ($AMZN) Daily: Clean Rebound Off 200-EMAAmazon ( NASDAQ:AMZN ) Daily: Clean Rebound Off 200-EMA Sets Up High-Asymmetry Breakout Play Above $250
### 🇺🇸 Amazon.com, Inc. ( NASDAQ:AMZN - NASDAQ) Daily Technical Study (Ref: AMZN_2026-07-02_09-05-08.png)
We are analyzing a high-probability trend-continuation setup on Amazon ( NASDAQ:AMZN ) on the Daily (1D) chart. The asset has successfully completed a healthy multi-week mean reversion phase, presenting a highly asymmetric risk-to-reward matrix for systematic trend followers.
---
###
NVIDIA ($NVDA) Daily: Price Approaches Institutional 200 EMANVIDIA ( NASDAQ:NVDA ) Daily: Price Approaches Institutional 200 EMA – Monitoring Golden Ratio Pocket for High-Asymmetry Bullish Pivot
### 🇺🇸 NVIDIA Corporation ( NASDAQ:NVDA - NASDAQ) Daily Technical Study (Ref: NVDA_2026-06-29_11-57-58.png)
We are deploying a comprehensive macro-structural analysis on NVIDIA Corporation ( NASDAQ:NVDA ) on the Daily (1D) matrix. As the broader technology sector undergoes a healthy liquidity reset, NVDA is rotating into a highly significant long-term institut
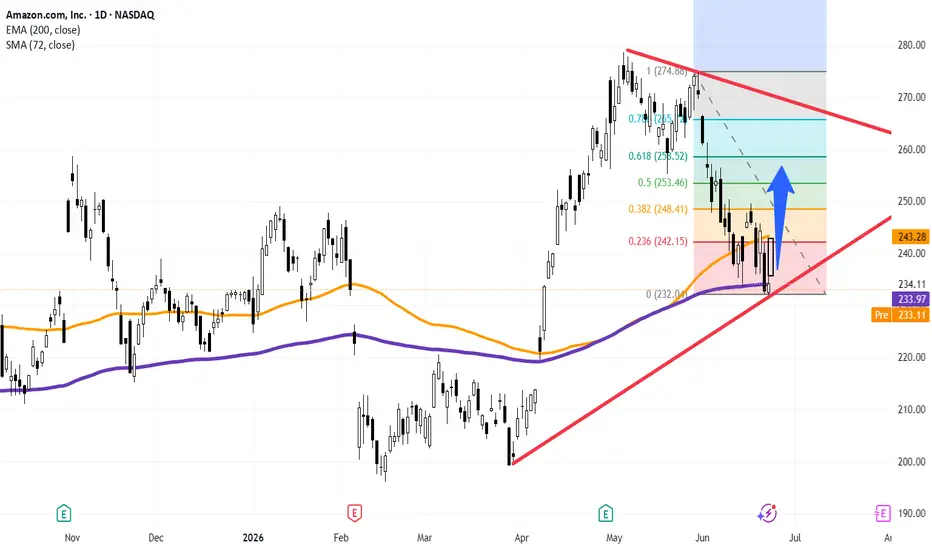
Amazon ($AMZN) Daily: Testing Institutional 200 EMA FloorAmazon ( NASDAQ:AMZN ) Daily: Testing Institutional 200 EMA Floor – Waiting for Volume Confirmation to Trigger Fib Recovery
### 📦 Amazon.com, Inc. ( NASDAQ:AMZN ) Daily Technical Analysis (Ref: AMZN_2026-06-24_09-10-41.png)
We are releasing a high-confluence structural update on Amazon.com, Inc. ( NASDAQ:AMZN - NASDAQ) on the Daily (1D) timeframe. The tech giant has completed a deep corrective phase and is currently sitting at a vital long-term institutional junction that could define its mac
is TelAviv Stock Market going to touch daily ema200TASE:TASE has broken the trendline and making higher lows after clear bearish divergence on daily timeframe since the start of Mar26.
Breaking the neckline and trading below it will push the index towards 13k mark and possibly towards ema200 which is 2k points further below.
Gold (GC1!) Daily: Historic 200 EMA Breakdown Signals Major MacrWe are publishing a macro technical study on Gold Futures ( COMEX:GC1! - COMEX) on the Daily (1D) chart, highlighting a major structural shift. The asset has just triggered a rare technical event that hasn't been observed in over two and a half years.
### Part 1: The Structural Breakdown (Ref: GC1!_2026-06-07_22-05-24.png)
* **The Historic 200 EMA Cross:** As highlighted inside the orange circle on our first chart, Gold has closed decisively below its **200-period Exponential Moving Average (D
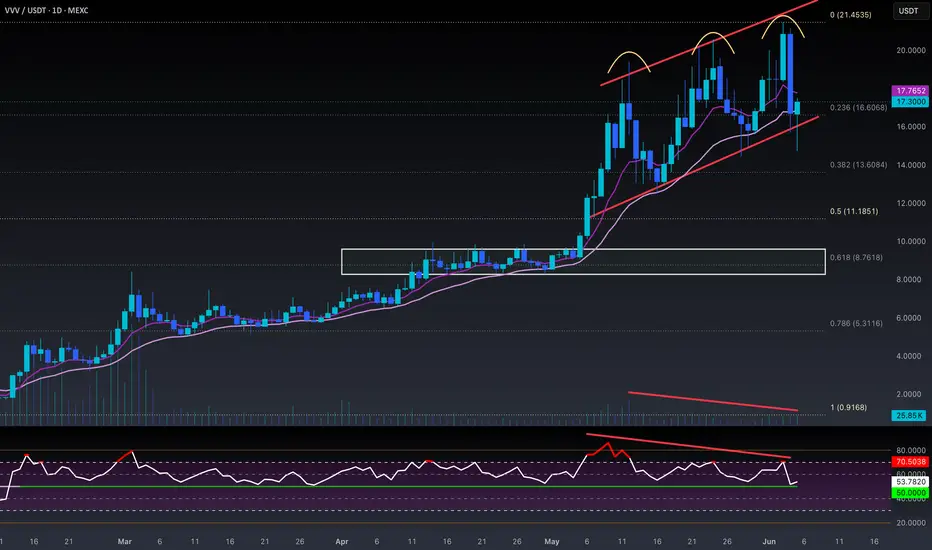
$VVV Top Confirmed with Bearish Engulfing + H&SNYSE:VVV TOP IS IN 💯
NASTY BEARISH ENGULFING Daily Close confirms Head & Shoulders reversal pattern (w/ a fake-out from upthrust).
PA responds with a dead-cat bounce into the bull flag (one last trap).
This will take a lot of time for the market to digest.
Should see a proper retest of the 50% gann level to decide next move.
Doubt that will hold with current macro market conditions coming online.
Would steer clear til ~$8-9 which is around the .618 Fib.
Better value buy sits ~$5 at the .
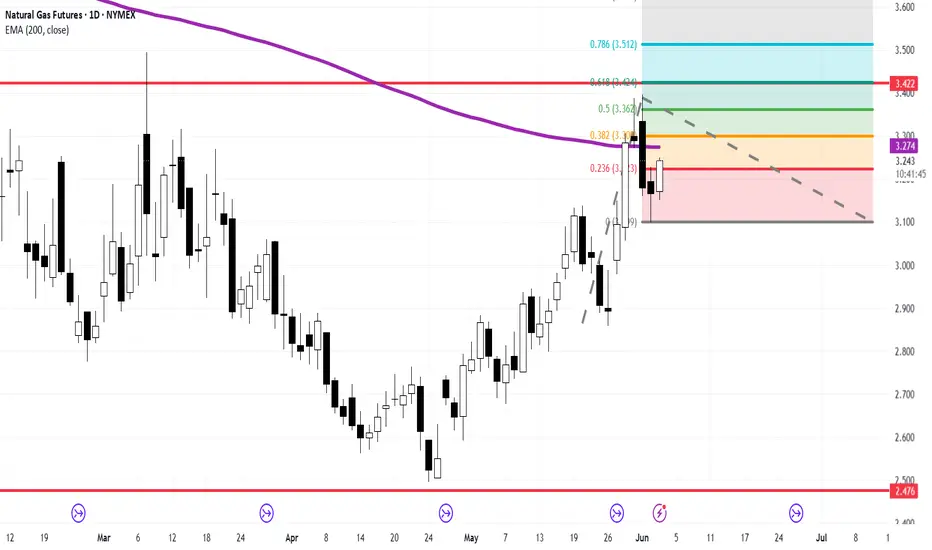
Natural Gas Daily: Fibonacci Targets Encounter Major 200 EMA & HNatural Gas Futures ( NYMEX:NG1! - NYMEX) is displaying an aggressive recovery structure on the Daily (1D) chart. While the medium-term Fibonacci projections point toward higher targets, the asset is fast approaching a multi-layered institutional supply wall that demands strict technical caution.
### The Technical Framework:
* **The Bullish Structural Pivot:** After successfully defending the macro horizontal demand floor at **2.476** in late April, the asset established a sequence of higher l
Gold Futures Update: Price Action Squeezed Inside Tight TriangleGold Futures ( COMEX:GC1! - COMEX) is displaying a classic volatility compression framework on the Daily (1D) chart, with price action tightly coiled inside a prominent symmetrical triangle.
As highlighted by the yellow circle, the precious metal is undergoing a massive liquidity build-up, indicating that a major directional expansion is approaching.
### Key Structural Clusters:
* **The Symmetrical Squeeze:** The asset is currently bound between a descending line of resistance (LTB) and a ris
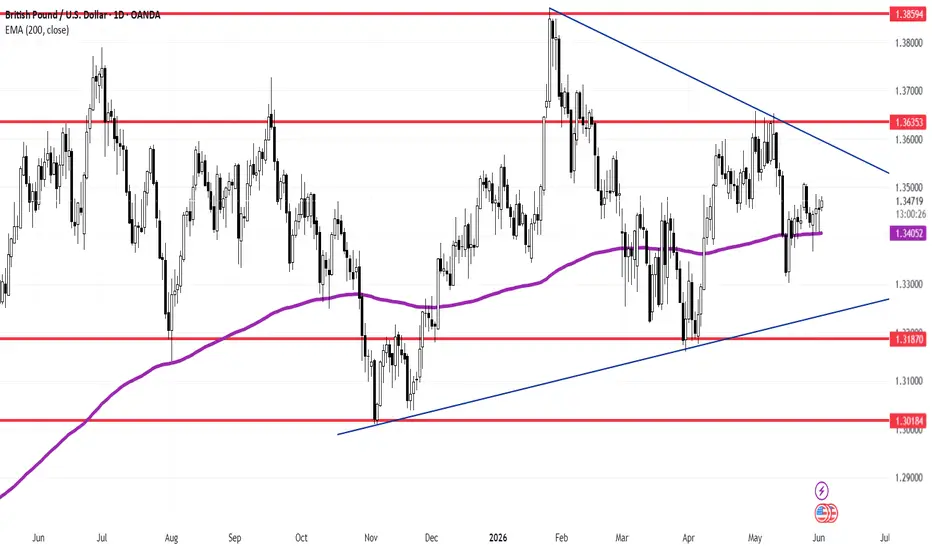
GBPUSD Daily: 200 EMA Defense Sparks Bullish MomentumThe British Pound / U.S. Dollar ( OANDA:GBPUSD ) pair is displaying a highly defined range-bound structure on the Daily (1D) chart, flashing a high-probability mean-reversion bounce after an institutional baseline test.
### Structural Framework & Key Levels:
* **The Macro Rectangle:** Price action remains boxed within a clear horizontal range. Heavy overhead supply is firmly established at the **1.36353** resistance line, while a rock-solid demand floor sits lower at the **1.32062** support clu
NVDA: Higher Highs, Higher Lows, Higher ProbabilityNVDA - CURRENT PRICE : 224.36
HIGHER HIGHS CONFIRM THE TREND. HIGHER LOWS CREATE THE OPPORTUNITY.
This is NVIDIA's year-to-date daily chart, and the price action continues to paint a bullish picture. Since establishing its late-March low, NVDA has developed a well-defined sequence of higher highs and higher lows, which is one of the clearest characteristics of a healthy uptrend. Rather than showing signs of weakness, the stock continues to attract buyers during pullbacks, allowing the bulli
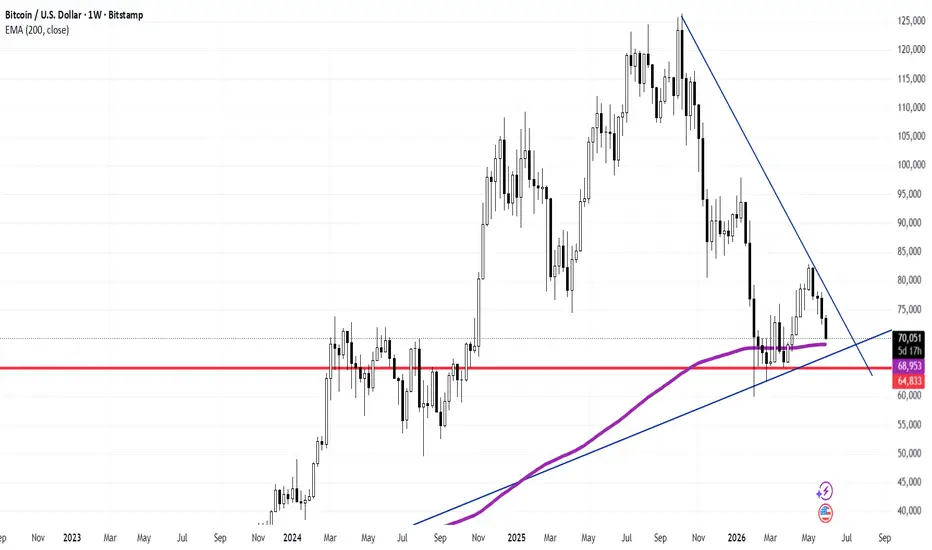
Bitcoin Weekly: BTC Tests Critical Major Confluence at the WeeklBitcoin ( BITSTAMP:BTCUSD - Bitstamp) is presenting an incredibly significant macro structural test on the Weekly (1W) chart. As long-term technical analysts, this is the exact type of high-probability confluence block we monitor for primary trend definitions.
Following a prolonged corrective cycle from its macro peaks, price action has compressed into a critical multi-layered demand territory.
### Key Macro Technical Factors:
* **The Weekly 200 EMA Baseline (68,953):** The dynamic purple bas
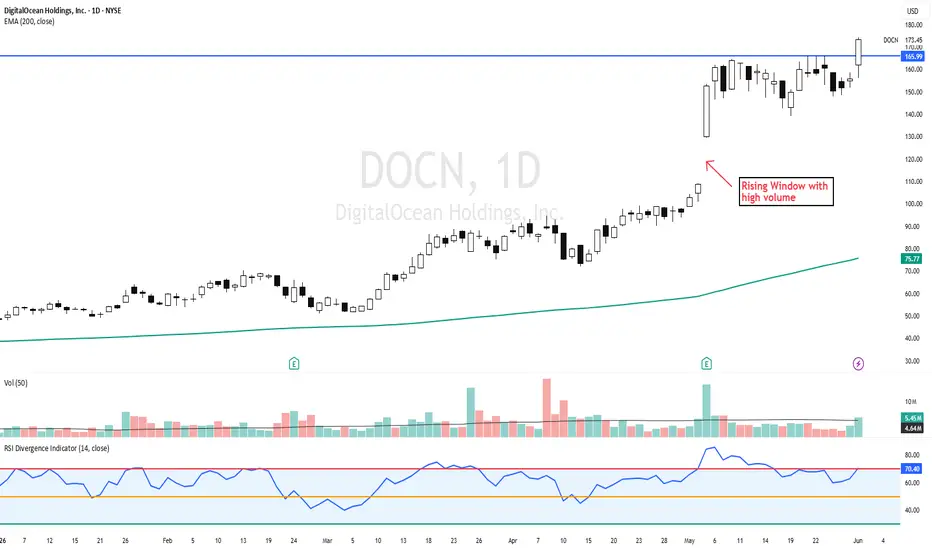
DOCN - When Volume Confirms the BreakoutDOCN - CURRENT PRICE : 173.45
DigitalOcean Holdings (DOCN) has delivered a strong bullish breakout by closing above its previous all-time high resistance near $166. The breakout is supported by rising volume, suggesting strong buying interest and increased participation from market participants. A notable bullish catalyst was the earlier rising window (gap-up) accompanied by heavy volume, which signaled aggressive accumulation and helped establish a new uptrend.
From a trend perspective, the
PATH - Hits Previous Targets, Fresh Buy Signal ActivatedPATH - CURRENT PRICE : 13.10
My previous PATH buy call has successfully achieved both upside targets. For those interested in reviewing the earlier analysis and setup, the previous report link has been shared for reference.
Following the recent price action, PATH has generated another bullish technical setup. The stock has decisively broken above its sideway consolidation resistance, signaling renewed buying interest after several months of accumulation. More importantly, the breakout occurre
MRAM - Healthy Retracement at Fibo Golden RatioMRAM - CURRENT PRICE : 27.00 - 29.20
MRAM is showing signs of maintaining a bullish structure after a strong breakout move. The recent pullback has retraced toward the 61.8% Fibonacci Golden Ratio retracement level, which is often viewed as a key support zone during healthy corrections.
In addition, the stock remains above the 50-day EMA, suggesting that the medium-term uptrend remains intact. The pullback appears constructive rather than a complete trend reversal, as buyers continue to defen
USDJPY Daily: Educational Case Study on the Power of the 200 EMAIn this technical analysis case study, we analyze the U.S. Dollar / Japanese Yen ( FX:USDJPY ) on the Daily Chart to visually demonstrate the immense structural power of the 200-period Exponential Moving Average (EMA 200) when combined with a major Ascending Trendline (LTA).
As technical analysts and institutional traders, we must always respect these critical macro intersections. The market's memory at these specific zones offers some of the highest-probability setups in professional trading.
Tesla H4 Update: Price Hits Target Trajectory Toward Confluence Tesla ( NASDAQ:TSLA ) is executing the anticipated corrective swing on the 4-Hour (H4) chart with high precision, moving strictly within our projected technical pathways.
### Key Lower Timeframe Mechanics:
* **The Descent Momentum:** Following the decisive rejection at the macro horizontal resistance wall (**452.87**) and the overhead descending trendline, the short-term order flow has shifted to the sell-side, leading the asset directly down into the apex squeeze.
* **The Imminent Confluence Z
S&P 500 Daily: Overextended Trends Encounter Channels & HistoricThe S&P 500 Index ( SP:SPX / $SPCFD) continues its powerful bullish expansion on the Daily Chart, but vital structural metrics suggest technical exhaustion is quietly building up under the hood.
### The Technical Framework:
* **The Ascending Regression Channel:** Since the major dynamic bottom established in April, price action has been strictly respecting a rising green parallel channel.
* **Short-Term Trajectory:** After successfully defending the lower boundary of the channel in late May,
Euro Stoxx 50 Daily: Price Nears Key Confluence of Ascending TreThe Euro Stoxx 50 Index ( TVC:SX5E / FOREXCOM:EU50 ) is presenting a clean technical corrective structure on the Daily Chart, drifting lower toward a well-defined confluence zone where buyers are expected to re-emerge.
Following a strong bullish expansion, the index is experiencing a healthy mean-reversion phase, offering a highly readable environment for swing traders tracking European benchmarks.
### Key Technical Factors:
* **The Aggressive Ascending Trendline (LTA):** A steep green suppo
Coffee C Futures Daily: Technical Bounce Targets Strong 300 - 31Coffee C Futures ( ICEUS:KC1! - ICEUS) has printed a clear local bottom formation on the Daily Chart, opening the gates for a tactical counter-trend recovery before encountering major macro overhead supply.
The soft commodity market relies heavily on structural technical baselines, and current price action is respecting historical key areas with great precision.
### Key Technical Factors:
* **The Demand Floor (263.25):** The market successfully found buyers and absorbed selling pressure exact