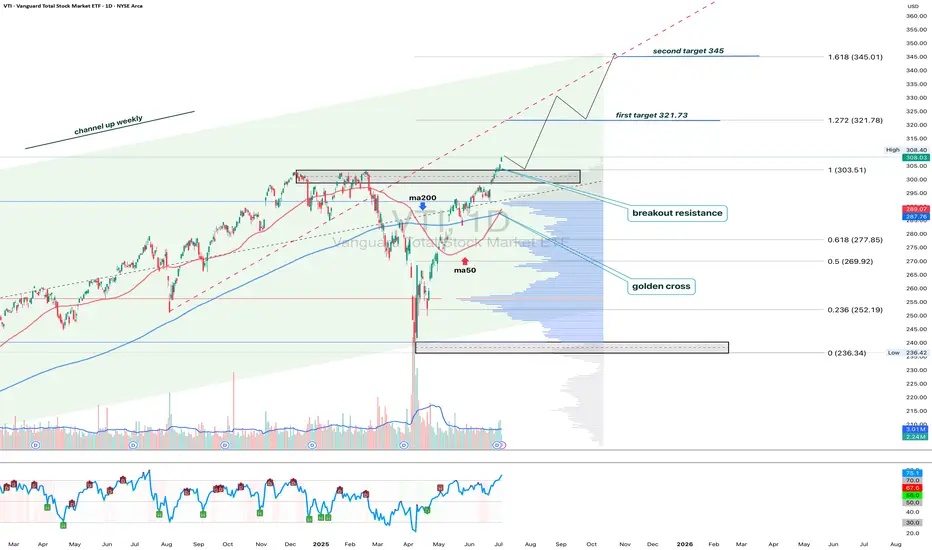
VTI 1D: breakout on the daily within a long-term weekly uptrend On the daily chart, VTI (Vanguard Total Stock Market ETF) has broken through the key $303.5 resistance level with strong volume. This breakout occurs within a larger weekly uptrend channel, highlighting a continuation of the long-term bullish structure.
Volume profile shows a clear path ahead: $321.7 (1.272 Fibo) and $345 (1.618 Fibo). The golden cross (MA50 crossing MA200 from below) further supports the bullish case.
Fundamentally, VTI represents the entire U.S. equity market - large to smal
ETF
BTC Tactical Plan: buy retests, validate breakouts__________________________________________________________________________________
Market Overview
__________________________________________________________________________________
BTC is pinned beneath the 115.8k–116.8k supply after a clean rebound off 107.8k, with dense HTF supports just below. Intraday momentum is constructive but capped by overhead supply and a mild risk‑off backdrop.
Momentum: Bullish 📈 but capped under 116k–117k; 6H/4H trend is up while daily stalls at supply.
K
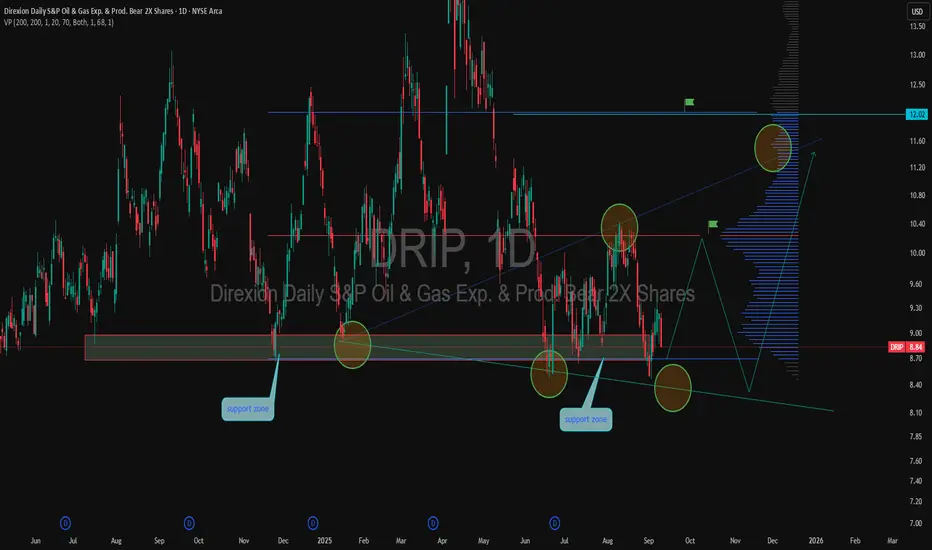
DRIP potential rebound from support zoneDRIP is consolidating near the key support area of 8.40–8.60. Over the past few months, this level has been tested multiple times, creating a strong base for a possible rebound. If local resistance around 9.50–10.00 is broken, the price may extend toward 11.20 and 12.00. However, a breakdown below support could trigger a move toward 8.00.
From a fundamental perspective, DRIP reflects the dynamics of the oil and gas sector, where pressure on producers remains high. In the current market environme
Gold’s $200 Surge Defies the DollarOver the past week, gold prices exploded by more than $200 per ounce, shattering the $3,500/oz threshold to new all-time highs . Silver joined the surge, breaching $40/oz for the first time since 2011 . This explosive precious metals rally is striking not only for its magnitude, but because it occurred in tandem with a strengthening U.S. dollar – a sharp break from the usual inverse correlation between gold and the greenback. Typically, “gold’s appeal reflects an inverse relationship with the
Bitcoin range: 110k defended, 111.9–114k caps the upside__________________________________________________________________________________
Market Overview
__________________________________________________________________________________
BTC is consolidating above 108.7–109.0k after the pullback from ATH, capped under 111.9–114.0k. Short-term momentum is improving while 6H/12H remain corrective.
Momentum: 📈 Neutral-to-slightly bullish above 110k, but capped by 111.9–113.5k; 6H/12H still in a corrective trend.
Key levels:
- Resistances (H
BTC MTF down, LTF volatile: Plan A short, Plan B reclaim__________________________________________________________________________________
Market Overview
__________________________________________________________________________________
BTC is consolidating at the range lows after the 120k–124k rejection, pressing the 108.8k pivot with a dominant bearish bias and sold rallies.
Momentum: Bearish 📉 — lower highs/lows with price pinned at 108.8k (12H/1D pivot).
Key levels:
• Resistances (4H–1D) : 110.9k–111.0k; 111,956 (W Pivot High); 113.
BTC – Fakeout Before the Big Breakout!Bitcoin has been repeating a familiar pattern:
- Fakeouts below key support zones, trapping early sellers.
- Breakouts back above structure, followed by strong impulsive moves.
We’ve already seen this sequence twice in the past months, and BTC might be setting up for it once again. Price faked out below support, reclaimed it, and is now eyeing a breakout from the falling channel.
🔁If history rhymes, the next leg could trigger a powerful impulse toward new highs. Traders should keep an eye
SBET vs DFDV: Which Crypto Treasury Horse Will Run Fastest?SharpLink Gaming (SBET) and DeFi Development Corp. (DFDV) are prime examples of the MicroStrategy model applied to different digital assets, Ethereum and Solana, respectively.
SharpLink Gaming, formerly an online gaming company, has made a dramatic and public pivot to become one of the world's largest corporate holders of Ether (ETH). Its strategy is to act as a direct and transparent vehicle for investors to gain exposure to the Ethereum ecosystem. The company actively raises significant capit
BTC Between 112.6k and 117k: Trade the Pivot, Not the Ego__________________________________________________________________________________
Market Overview
__________________________________________________________________________________
BTC is consolidating below 117k after a clean rejection, pressing a major HTF support around 112.6k. The pullback is orderly, with intraday downside inside a still constructive 1D/1W trend. ⚖️
Momentum: 📉 Tactically bearish — intradays trend down while 1D/1W remains broadly bullish.
Key levels:
- Resistan
S&P 500 ETF & Index– Technicals Hint at a Possible Correction📉📊 S&P 500 ETF & Index at Resistance – Technicals Hint at a Possible Correction 🔍⚠️
Everything here is pure technicals— but sometimes, the market whispers loud and clear if you know how to listen. 🧠📐
The VOO ETF, which tracks the S&P 500 , has now reached the upper boundary of a long-term ascending channel, once again brushing against resistance near 590.85. This zone has consistently led to major pullbacks in the past.
On the right panel, the US500 Index mirrors this move—pushing to
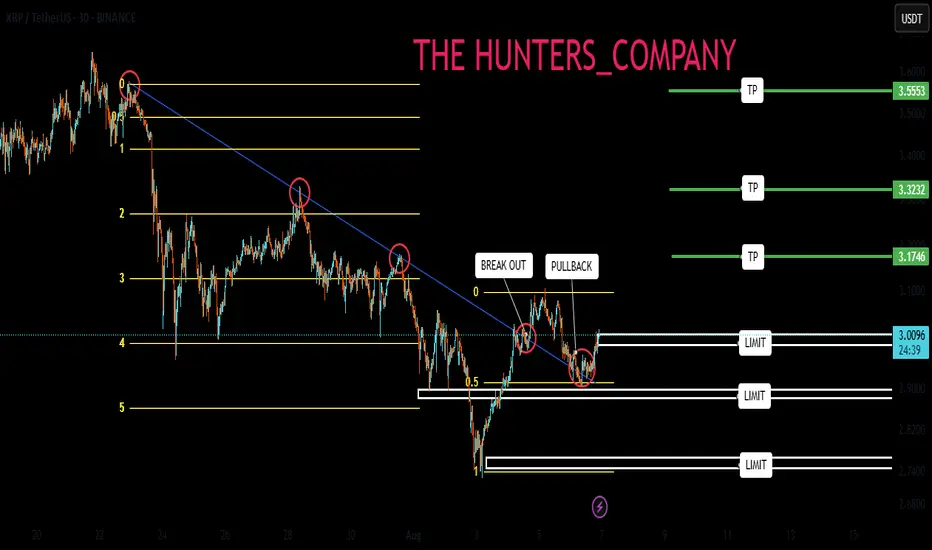
XRP : Will Ripple be pumped?Hello friends🙌
✅ considering the decline we had and the entire market, Ripple has also fallen like other currencies.
✅You can see that the price has hit resistance several times but failed to break it. Finally, in the last hit, which we also identified on the chart, the powerful price broke through the resistance.
✅Now, in the support area we identified on the chart, you can see that the price is supported by buyers and higher lows have been recorded.
✅Now that the price has pulled back and
ETH: LIVE TRADEHello friends🙌
✅Given the good rise we had, we had a small correction that was a buying opportunity and there is another support area where we can buy the second step in case of further correction.
We have also specified targets for you, be careful and do not act emotionally and observe capital and risk management.
🔥Follow us for more signals🔥
*Trade safely with us*
Bitcoin Uptrend Intact, Pullback First? 120.0k–119.8k is Key!__________________________________________________________________________________
Market Overview
__________________________________________________________________________________
BTC is hovering near 120.6k after a clean reclaim above the 119.8k pivot, now pressing into the 121k–122.3k daily supply cluster. Trend is bullish, but we’re trading into resistance.
Momentum: 📈 Bullish, multi-timeframe HH/HL, yet approaching a dense 121k–122.3k supply.
Key levels:
- Resistances (4H/1D)
BTC 1H Analysis – Key Triggers Ahead | Day 9💀 Hey , how's it going ? Come over here — Satoshi got something for you !
⏰ We’re analyzing BTC on the 1-hour timeframe after today’s CPI release .
👀 Following the CPI news, Bitcoin broke through key areas — including the descending channel and the $117,000 resistance — and moved higher. It then faced rejection from the previous high, pulling back to around $118,000, which aligns with a multi-timeframe 4H SMA25 bounce. After that, it broke the $119,000 level and is now heading toward its key
DRIP: the bear in an oilskin ready to huntDRIP: the bear in an oilskin ready to hunt
Technical analysis:
DRIP has built a solid support zone between 8.60–9.00, showing volume accumulation and smart money activity. After a recent bounce, the price broke above the 10.00 level and is holding above 10.15. The next resistance is at 10.88, followed by 12.81 and the strategic target of 14.89.
EMA and MA have turned upward, confirming a short-term trend change. MACD is moving toward the positive zone, while RSI remains neutral with room to ris
BTC Support Tested, Mixed Cross-TF Signals, Tactical Caution__________________________________________________________________________________
Technical Overview – Summary Points
__________________________________________________________________________________
Momentum & context: Bullish bias confirmed on higher timeframes (1D/4H), but bearish divergences appearing from 2H downward.
Major support/resistance: 114,600–115,000 and 114,667 hold as the critical zone. Key resistance: 116,900–117,000 must break for a bullish trigger.
Volume: Normal
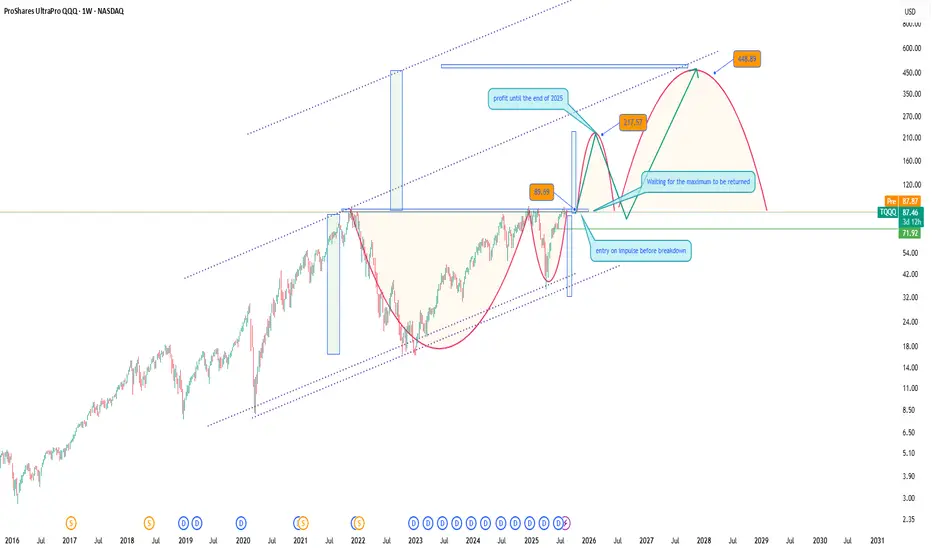
ProShares UltraPro QQQ (TQQQ) LONGThe Technology Sector Continues to Break Records
The tech sector keeps setting new highs, and alongside individual stocks, it's a great idea to consider investing in an ETF that mirrors the profits of the NASDAQ 100 index. One of the most attractive options is TQQQ - it’s more affordable than the index itself, yet offers similar growth potential aligned with the entire tech sector.
I expect continued growth through the end of the year, assuming the geopolitical landscape remains relatively sta
Bitcoin - Will Bitcoin reach its previous ATH?!Bitcoin is below the EMA50 and EMA200 on the four-hour timeframe and is in its short-term descending channel. In case of an upward correction, Bitcoin can be sold from the specified supply zone, which is also at the intersection of the ceiling of the descending channel.
It should be noted that there is a possibility of heavy fluctuations and shadows due to the movement of whales in the market and compliance with capital management in the cryptocurrency market will be more important. If the downw
S&P 500 ETF & Index Hit Resistance – A Technical Warning Shot 📉⚠️ S&P 500 ETF & Index Hit Resistance – A Technical Warning Shot 🔍🧠
Following up on the video I just posted , I had to share this updated chart of the VOO ETF (Vanguard S&P 500) and US500 Index , now that both are testing key resistance levels.
On the left: AMEX:VOO has reached the very top of a multi-year ascending channel—a zone that has historically triggered sharp corrections. The level at 590.85 marks a major resistance zone.
On the right: The US500 Index is showing a similar tec
ETH - BTC ETF News: What It Means for the Market+ China Rumors 🚨 ETH - BTC ETF News: What It Means for the Market + China Rumors 💥🌐
July just ended with a crypto bombshell 💣 — and the market is barely reacting.
Let’s break it down:
🧠 One part hard news.
🌀 One part geopolitical smoke.
🎯 All parts worth watching if you care about macro market shifts.
🏛️ SEC Approves Real BTC & ETH for ETF Flows (July 29)
Say goodbye to the cash-only ETF model.
The SEC now allows direct in-kind creation/redemption of Bitcoin and Ethereum in ETFs.
That means providers
CRO (Crypto.com) $3 Target! Don't Miss This Move🪙 Ticker: OKX:CROUSDT
🕰 Chart: 1D (Heikin Ashi)
🔧 Tools Used: Fibonacci Extension, Fundamental News (ETF Filing)
🔍 Chart Analysis: Fibonacci Extension Targeting $3+
The Fibonacci Extension tool has been applied to the major CRO impulse wave from its peak near $0.90 (late 2021) to the 2022–2023 bottom at $0.0484, confirming a multi-year retracement and consolidation period.
Let’s break down the major Fib levels:
Extension Level Price Target
0.236 $0.2495
0.382 $0.3741
0.618 $0.5745
1.0 $0.90
LITCOIN BUY OR SELL !!!Hello friends🙌
🔊According to the price drop, you can see that the price has been below the specified resistance for a while and when it was able to break the resistance, it shows us the power of the buyers. Now, when we return to the previous resistance, which has now become a support, you can see that the buyers are providing good support and the price is expected to move to the specified targets.
Note that the most important rule in trading is capital and risk management So make sure to foll