BTC Tactical Plan: buy retests, validate breakouts__________________________________________________________________________________
Market Overview
__________________________________________________________________________________
BTC is pinned beneath the 115.8k–116.8k supply after a clean rebound off 107.8k, with dense HTF supports just below. Intraday momentum is constructive but capped by overhead supply and a mild risk‑off backdrop.
Momentum: Bullish 📈 but capped under 116k–117k; 6H/4H trend is up while daily stalls at supply.
Key levels:
• Resistances (D/12H) : 115.8k–116.8k (active supply), 118.6k–118.8k (former supply), 124.3k (D high).
• Supports (4H/12H/W) : 114.9k–114.3k (demand block), 113.4k (12H pivot), 112.0k–110.1k (W/240 zone).
Volumes: Intraday elevated (1H/2H VERY HIGH), 4H moderate, Daily normal — enough to power a breakout if 116k gives.
Multi-timeframe signals: 12H/1D filters “Up”; 6H/4H bullish with a flag below 116k; micro‑TFs split (30m neutral‑sell vs 15m neutral‑buy).
Risk On / Risk Off Indicator context: NEUTRE VENTE — mild risk‑off that contradicts price momentum; demand confirmation before adding risk.
__________________________________________________________________________________
Trading Playbook
__________________________________________________________________________________
Dominant trend is up on 6H→1D but capped by HTF supply; favor disciplined buy‑the‑dip or confirmed breakouts with tight invalidations.
Global bias: Slightly bullish as long as 113.4k holds on closes; key invalidation if D < 113.4k.
Opportunities:
• Tactical buy on 114.9k–114.3k retest with lower‑wick rejection and close > 114.8k (2H/4H).
• Breakout buy on close ≥ 116.0k then ≥ 116.7k with rising volume.
• Tactical sell on 115.8k–116.3k rejection confirmed by close < 114.8k (2H/4H), targeting 113.4k.
Risk zones / invalidations: A break of 113.4k opens 112.0k–110.1k (invalidates the long bias). A daily close > 116.8k invalidates counter‑trend shorts.
Macro catalysts (Twitter, Perplexity, news):
• Fed rate‑cut expectations → liquidity support, aiding breakouts above 116.7k.
• Crypto flows: spot ETF inflows and a fresh USDT mint support buy‑the‑dip behavior.
• Tariff/sanctions headlines and geopolitics → risk‑off triggers that fit a NEUTRE VENTE Risk On / Risk Off Indicator.
Action plan:
• Long plan : Entry 114.9k–114.6k or close ≥ 116.0k; Stop 113.9k; TP1 115.6k, TP2 116.7k, TP3 118.6k → R/R ~1.4–2.5x.
• Short plan : Entry 115.8k–116.0k (rejection), Stop 116.8k; TP1 114.4k, TP2 113.4k, TP3 112.0k → R/R ~1.5–2.2x.
__________________________________________________________________________________
Multi-Timeframe Insights
__________________________________________________________________________________
Overall, HTFs are bullish but pressed under daily supply, while LTFs carry the volume to decide the break.
1D/12H: “Up” filters with 113.4k and 110.1k–112.0k supports; upside validation requires firm acceptance above 116.8k.
6H/4H: Ascending structure with a flag below 116k; breakout 116.0k→116.7k unlocks 118.6k.
2H/1H: Very high volumes near 116k; 114.9k–114.3k retests remain buy zones while 113.4k holds.
Major divergences/confluences: Price momentum vs Risk On / Risk Off Indicator at NEUTRE VENTE — demand confirmed closes/volume on breakouts are essential.
__________________________________________________________________________________
Macro & On-Chain Drivers
__________________________________________________________________________________
Macro/liquidity is broadly supportive but offset by headline risk and seasonality.
Macro events:
• Market expects multiple 25‑bp Fed cuts — supportive for BTC’s liquidity beta.
• ECB messaging is mixed; gold’s strength aids risk appetite but Europe’s tone stays cautious.
• Tariffs/sanctions (G7/EU) and Eastern Europe tensions — potential risk‑off shocks.
Bitcoin analysis: Supply 115.8k–116.8k; supports 114.9k–114.3k and 113.4k. Recent spot ETF inflows and a 1B USDT mint are constructive; whale flows remain mixed.
On-chain data: ETF netflows moderate; derivatives more influential (basis <10%, elevated options OI, softening IV) — healthier structure but still spot‑dependent.
Expected impact: Liquidity and rate‑cut hopes favor a clean break above 116.7k; otherwise, headlines can accelerate price toward 113.4k/112.0k.
__________________________________________________________________________________
Key Takeaways
__________________________________________________________________________________
BTC sits in a high range beneath 116k–117k with strong HTF supports just below.
- Trend: constructive/bullish but capped; confirmation needed above 116.8k.
- Top setup: buy 114.9k–114.3k retests or 116.0k→116.7k breakout with volume.
- Macro: dovish Fed expectations support; tariffs/sanctions headlines remain the wild card.
Stay disciplined: let price confirm above 116.7k… or pivot to plan B below 113.4k. 🎯  Long
Long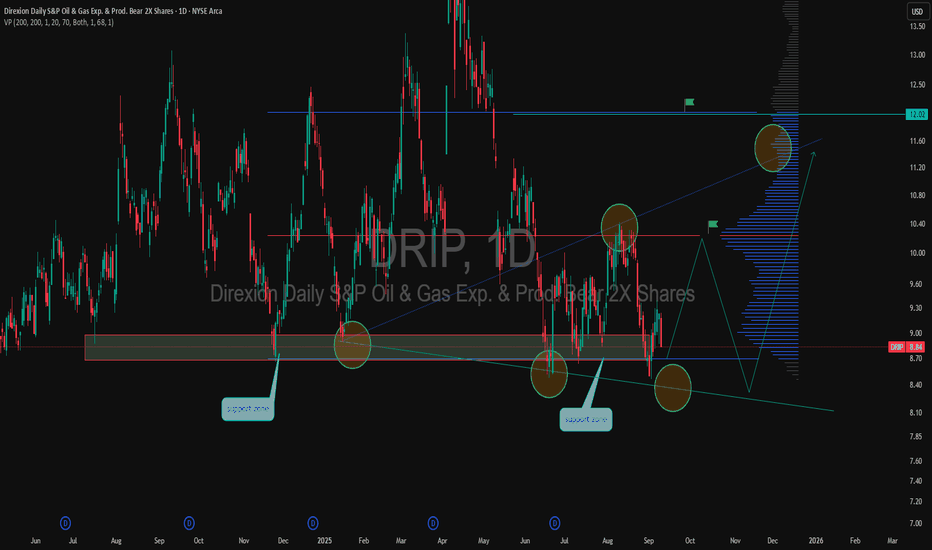
 Long
Long
Gold’s $200 Surge Defies the DollarOver the past week, gold prices exploded by more than $200 per ounce, shattering the $3,500/oz threshold to new all-time highs . Silver joined the surge, breaching $40/oz for the first time since 2011 . This explosive precious metals rally is striking not only for its magnitude, but because it occurred in tandem with a strengthening U.S. dollar – a sharp break from the usual inverse correlation between gold and the greenback. Typically, “gold’s appeal reflects an inverse relationship with the dollar’s value”, as one analyst noted , and gold soars when the dollar slumps. Yet this time, the U.S. Dollar Index held firm (even rising against some currencies), so gold’s ascent “alongside the value of the US dollar” appears anomalous .
This disconnect has confounded the simplistic media narrative that tried to pin gold’s move on U.S. political drama – namely turmoil surrounding Donald Trump pressuring the Federal Reserve. Indeed, mainstream headlines have leaned on that explanation: “Gold surges after Trump’s Fed pressure,” blared the Financial Times, after President Trump’s attempted (and unprecedented) firing of Fed Governor Lisa Cook raised alarms about Fed independence . Bloomberg News similarly attributed gold’s spike to “rate-cut bets” spurred by Trump’s actions . There is some truth here – investors clearly sought safety amid U.S. political uncertainty, with the largest gold ETF (SPDR Gold Shares, ticker GLD) hauling in over $2.3 billion of inflows last week to top all ETFs, “as gold prices flirted with record highs near $3,500” following Trump’s attempt to oust a Fed official . Concerns over Fed independence and Washington turmoil did fuel safe-haven demand . But a closer investigation of market data and cross-asset flows reveals a more complex story than “Trump made gold jump.” In particular, the simultaneous rise of gold and the dollar hints at other forces at play – potentially global capital rotations and eurozone undercurrents – that the simplistic narrative overlooks.
Order Flow: U.S. Buying vs. Asian Selling
One immediate clue lies in where the strongest gold buying originated. Market internals and order flow patterns suggest that North American investors led this rally, while Asian and European participants were net sellers or laggards. Gold’s intraday price action repeatedly showed dips during Asia and London trading hours, followed by robust gains during U.S. market hours – indicating steady accumulation out of New York overcoming profit-taking elsewhere. This aligns with recent flow trends: “Gold ETF buying has flipped from Asia to Western investment markets”, notes BullionVault, as China and India saw outflows while U.S. and European gold funds began expanding together . In the past fortnight, Asian-listed gold ETFs shrank by over 5 tonnes – the heaviest 2-week outflow since the Ukraine invasion – even as Western funds saw their strongest stretch of inflows in over two years .
Physical gold selling in Asia corroborated this trend. As prices hit fresh highs above $3,000 and $3,500, Asian jewelry holders rushed to “cash in”. In India’s bazaars and Middle Eastern souks, retailers report a surge of people selling old jewelry and coins to lock in gains . “Customers raced to cash in their old gold,” Reuters noted, with scrap sales booming across India and the Middle East . This flood of recycled gold effectively made Asia a net supplier to the market during the rally, potentially “tempering gold’s rally” in those regions if it continues . In contrast, U.S. investors were voracious buyers: not only did American ETFs see big inflows, but U.S. futures markets showed relentless bids during New York trading sessions, driving price strength into each day’s close.
In sum, Western demand carried gold higher even as Eastern markets took profits. This East-to-West flow reversal suggests the price surge was not simply a global panic “bid” for gold, but rather a targeted rotation of capital – with U.S. and European buyers eagerly absorbing the supply coming out of Asia. Such a dynamic is important because it hints that new money (likely institutional and speculative) in the West was a key driver, rather than traditional physical demand from Asia (which actually softened amid the high prices).
Gold in USD vs. Gold in EUR: A Currency Disconnect
Another intriguing aspect of this rally is how differently it played out in U.S. dollars versus other currencies – particularly the euro. Gold’s price in USD hit record highs, but gold priced in euros (XAU/EUR) did not. In fact, at gold’s peak this week the euro-priced ounce “held beneath spring highs” even as the USD-priced ounce broke out . Gold in British pounds and Japanese yen did notch new records alongside USD gold , but the euro-denominated price lagged.
This discrepancy between XAU/USD and XAU/EUR is telling. Had the rally been driven purely by U.S.-centric fears (Trump/Fed turmoil) causing a weak dollar, we would expect the opposite – gold might jump in USD but soar even more in euros as the dollar falls. Instead, the dollar strengthened against the euro, and gold’s rise in USD terms outpaced its rise in EUR terms. One interpretation is that some of the buying came from investors shifting capital out of euro assets and into dollar-based gold, effectively boosting both gold and the dollar simultaneously. In other words, capital flight from euro-based holdings could be an underlying factor. If European investors (or global investors with euro exposure) moved funds into U.S. dollars or dollar-priced gold, that would drive the dollar higher at the same time as gold – precisely what we saw.
It’s notable that earlier in the year, gold in euros had spiked to record levels (during a bout of euro weakness and regional banking worries), whereas U.S. gold lagged at that time. Now the roles reversed: “the dollar price topped its previous high, but the euro price of gold stayed below its spring peak” . This reversal suggests the latest rally was U.S.-led, not euro-led. Rather than a panic specifically within Europe, this feels like a more subtle rotation away from the euro toward “safe” currencies and assets. The euro’s exchange rate was relatively firm during this gold spike (indeed, gold’s jump was despite a firm dollar, not because of a weak one), implying the move wasn’t about a collapsing euro – it was about proactive reallocation. In essence, global investors may be quietly diversifying out of euros into gold (and dollars) as insurance against potential eurozone troubles down the line.
Speculators Pile In: CFTC Data Shows Growing Longs
Fueling gold’s ascent has been a wave of speculative positioning in the futures market. The Commodity Futures Trading Commission (CFTC) Commitments of Traders (COT) report reveals that hedge funds and money managers have been steadily adding to bullish gold bets. In fact, bullish bets are at their highest levels in years. As one market analysis noted, “the net long position of Managed Money traders rising… back to 4-year high… reaching 155% of long-term average” . This means speculators hold vastly more long contracts than usual, a clear sign of momentum-chasing and confidence in further upside.
Recent data confirms the build-up: speculators’ net-long gold positions jumped to around 237,000 contracts in mid-August (versus ~178,000 in early 2024) and remain elevated . For context, that mid-August figure was the largest net long in at least four years. Even trend-following funds that had been absent are now “firing on all cylinders,” adding to length as gold broke out. Importantly, while these speculative inflows are large, some analysts point out they are “relatively modest… given the move in gold prices – suggesting there is further upside to come” if more investors pile in . In other words, positioning is bullish but not yet at extreme record levels in proportion to gold’s price move, leaving room for additional buyers.
This surge in paper gold interest highlights that the rally has a strong “hot money” component. It’s not just passive safe-haven holding; fast-moving traders are actively driving the market higher. The rising COT longs also underscore why gold’s jump defied the dollar: in a typical risk-off scenario, one might see short covering or flight from other assets incidentally lift gold, but here we have an affirmative speculative buildup anticipating higher gold ahead.
Massive ETF Inflows: GLD and Silver ETFs See Big Demand
Alongside futures activity, investment flows into gold and silver exchange-traded funds (ETFs) have been massive, indicating broad-based demand from institutions and retail investors alike. The flagship gold ETF, GLD, saw particularly eye-popping inflows. In the week of the surge, GLD attracted roughly $2.3 billion of new money, making it “the No.1 asset gatherer among U.S.-listed ETFs” . To put that in perspective, GLD outdrew even the largest stock index funds for the week – a remarkable rotation of capital into precious metals.
These inflows pushed GLD’s total assets to new heights, as investors sought the convenience of paper gold exposure during the rally. Other precious metals funds saw similar interest: iShares’ silver trust (SLV) reportedly logged sizable inflows as silver prices jumped in unison with gold. Silver’s rally – over 10% in a week to above $40/oz – was the strongest in years, and analysts noted that “momentum traders obviously also became involved” once silver broke technical levels . The U.S. government’s proposal last week to classify silver as a critical mineral (which could spur domestic stockpiling) “helped to fuel the surge through $40” , giving fundamental justification to silver’s move and further enticing ETF investors.
Taken together, the ETF data paints a picture of widespread investment allocation into precious metals. Gold-backed ETFs globally had already been seeing positive inflows in recent months – the World Gold Council reported that the first half of 2025 saw the largest H1 gold ETF inflows since 2020 – and this past week accelerated that trend. The demand was not confined to the U.S. either; European-listed gold funds also saw creations (with particularly strong buying in the UK, Switzerland, and Germany in recent months) . But the U.S. flows were dominant. North American funds accounted for the bulk of new gold ETF buying this quarter , reflecting that U.S. investors are driving this shift to hard assets.
Such massive ETF inflows, alongside record futures longs, indicate a broad conviction trade into gold and silver. Whether as an inflation hedge, a geopolitical hedge, or a play on future Fed easing, capital is pouring into these assets via easily accessible vehicles. GLD’s $2+ billion weekly haul underscores that this was not a niche move – it was front and center in capital markets.
Not a Typical “Risk-Off” – Stocks, Crypto and Bonds Stayed Resilient
Crucially, unlike many past gold spikes, this one did not coincide with a major selloff in other asset classes. In classic market panics, gold’s rise is often mirrored by tumbling equities, collapsing bond yields (as investors buy Treasuries), or even a rush out of speculative assets like cryptocurrencies. That didn’t really happen here – indicating this gold rally was driven by rotation of capital from cash or low-yield reserves, rather than forced liquidations elsewhere.
Consider the stock market: global equities barely blinked. The MSCI World Stock Index had just hit an all-time high in late August; it fell only about 1.5% from that peak during gold’s run-up . A 1.5% dip is trivial – essentially normal daily volatility – and U.S. indices similarly remained near record levels. There was no sense of an equity crash or widespread fear in stocks; in fact, some risk assets like small-cap stocks rose on hopes of Fed rate cuts. Crypto markets were also relatively stable. Bitcoin and other major cryptocurrencies held in their recent trading ranges with no signs of a flight-to-safety out of crypto. Unlike early 2020 (when Bitcoin plunged during a dash for cash), this time crypto was “largely unfazed”. If anything, crypto investors likely interpreted Fed dovishness as positive, which could have buoyed coins – but there was no mass exodus from crypto into gold.
Bonds told a more nuanced story. U.S. Treasuries did not rally alongside gold – in fact, long-term bond prices fell last week, sending yields higher . Typically, if there were a major fear-driven episode, one would expect Treasury yields to plunge (as bond prices rise on safe-haven buying). Instead, the 10-year and 30-year yields ticked up. Notably, gold and bonds moved in opposite directions: “the split between government debt and gold prices has been underway, with gold rising… while the value of longer-term Treasury bonds has halved over five years” . Part of last week’s bond weakness was due to fresh concerns about fiscal deficits and inflation – which ironically can boost gold. A fund manager at Newton noted that the bond market isn’t yet signaling long-term inflation, but “there is falling confidence that can continue indefinitely”, characterizing the situation as a “fiscal crisis, rather than an economic crisis” driving gold’s rise . In short, gold’s jump wasn’t the result of a panic-driven bond rally – if anything, it coincided with a bond selloff. That implies the money fueling gold had to come from elsewhere (cash, forex reserves, or rotation out of other holdings) rather than from investors dumping stocks and bonds in fear.
This cross-market resilience supports the idea that the gold/silver inflows were more of a strategic reallocation or hedge, not a reaction to an acute crash in other assets. As one analyst put it, “If you were a Martian observing this, gold and long-term bonds sending opposite signals is telling you there are concerns” below the surface – but it’s an unusual mix of signals. Investors didn’t run for the exits in equities or corporate bonds; instead, they appear to have drawn on sidelined cash or reallocated currency reserves to fund their gold purchases. This makes the episode more interesting: it hints at a rotation happening quietly, rather than an obvious crisis visible in all markets.
Beyond the Trades: Is Capital Fleeing the Eurozone?
These patterns – U.S.-led gold buying, euro underperformance, no broad risk asset selloff – point to a deeper macro narrative: a potential rotation of capital out of Europe’s financial system and into hard assets. Several data points and developments reinforce this interpretation:
Reserve Currency Shifts: In a striking milestone, gold has now surpassed the euro as the world’s second-largest reserve asset (behind only the U.S. dollar). An ECB report highlighted that for the first time ever, gold represents a larger share of global foreign exchange reserves (20%) than the euro (16%) . In other words, central banks collectively hold more value in gold than in euro-denominated assets. This reflects concerted gold accumulation (over 1,000 tonnes per year since 2022, more than double the prior decade’s average ) at the expense of fiat holdings. It’s effectively a rotation out of traditional currencies – notably the euro – and into bullion. Such a shift “is remarkable”, as one market veteran noted, and coincides with 95% of central banks stating they plan to increase gold reserves in the next year – the highest on record . This trend screams a subtle mistrust in the long-term stability of the euro and other fiat assets, and a desire for the safety of hard currency.
Eurozone Stress Signals: While the eurozone isn’t in open crisis, there are hints of structural stress that may be nudging smart money to preemptively seek safety. Political instability is one concern – for example, in France (the Eurozone’s second-largest economy), the government is teetering on the edge of collapse amid budget battles. Even ECB President Christine Lagarde cautioned that “any risk of a government falling in the euro zone a concern”, after French markets wobbled on snap election fears . Such political tremors feed into a narrative of euro-area fragility. Meanwhile, European banks and governments are grappling with high debt loads and thin margins. As interest rates rose this year, sovereign and corporate borrowing costs in Europe jumped, exposing vulnerabilities in heavily indebted nations. Observers have warned of “debt saturation” and precarious leverage in Europe’s financial system (some even pointing to bloated gold derivatives positions at European banks as a risk) . If investors – or other central banks – perceive even a small chance of a Eurozone financial accident (be it a debt crisis, a bank failure, or political rupture), they may quietly trim exposure now.
Geopolitical Fragmentation and Inflation Hedging: Beyond Europe-specific issues, the broader macro backdrop is one of fracturing globalization and lingering inflation – conditions under which hard assets historically thrive. Under President Trump, the U.S. has upended elements of the post-WWII order, from trade alliances to security commitments . Trade wars and tariffs are forcing reallocations of supply chains and reserves. According to Reuters, Trump’s aggressive policies and sanctions have “upended Western security policy” and contributed to an environment where diversifying away from reliance on any single currency (especially the U.S. dollar) becomes prudent . Many developing countries have responded by boosting gold holdings as a hedge against geopolitical risks and potential sanctions (a lesson learned after Russia’s USD reserves were frozen in 2022) . This “de-dollarization” impulse, interestingly, often doesn’t benefit the euro – it benefits gold. Nations looking to reduce dollar dependence aren’t rushing into euros; they’re buying bullion (and to some extent, yuan) . This adds to global gold demand independent of day-to-day traders.
At the same time, inflation remains a concern. Though off its peak, inflation in both the U.S. and Europe has been stubbornly above central bank targets, eroding trust in fiat purchasing power. Gold is the classic inflation hedge, and its appeal grows when investors worry that “there are concerns… the right tail of inflation risk” in the future . Notably, this gold rally occurred even as inflation expectations in bond markets remained relatively contained – suggesting some investors aren’t waiting for official signals; they are positioning early against the possibility of inflation or currency debasement down the road. The fact that inflation-linked bonds have not rallied (underperforming regular bonds) implies the bond market isn’t convinced inflation will run away . But gold’s surge could be seen as a belts-and-suspenders approach – insurance in case the bond market is wrong or central banks falter.
Hard Asset Accumulation by Private Wealth: It’s not just central banks. Wealthy individuals and institutions are also shifting into tangible assets. Anecdotally, vault operators report high demand for physical gold storage. Real assets from commodities to real estate are getting increased allocation in portfolios as a hedge against both inflation and geopolitical strife. Silver’s inclusion on a U.S. critical minerals list last week (to secure supply chains) is emblematic of the new era of resource nationalism and strategic stockpiling . Gold and silver stand to benefit as strategic assets in a fragmenting world. The rally in both metals might be an early sign of investors preferring the certainty of hard assets in hand over promises on paper.
All these factors converge to a clear insight: the gold and silver surge may be an early warning signal of capital seeking safety from systemic risks – particularly those emanating from currency systems and financial institutions. Unlike a sudden crisis that causes a panicked stampede, this feels more like a strategic redeployment of capital: a rotation before the full storm hits.
Conclusion: A Canary in the Coal Mine?
Gold’s extraordinary run this past week – soaring in concert with a firm dollar, absent a stock market crash – is not just a one-off curiosity. It appears to be a manifestation of deeper shifts in investor behavior and economic regime. The simple story of “Fed drama and political turmoil” belies the larger context: we are likely witnessing a rotation toward safety and solidity in anticipation of future turbulence. Whether that turbulence comes from Europe’s financial system, unsustainable government debts, or a fracturing global order, investors are hedging their bets.
Precious metals are, in effect, serving as a barometer of macro stress and a receptacle for capital seeking refuge. As the European Central Bank’s own analysis noted, “gold generally offers a safe haven in times of stress… in extreme cases, gold prices tend to rise alongside the US dollar, while stock and bond prices decline” . That’s essentially what we’ve just observed – minus the sharp stock decline (at least so far). It puts policymakers on notice: something is bubbling beneath the surface. The last time we saw gold and the dollar rising together was during episodes like the onset of COVID-19 and the 9/11 attacks – clear crises. This time, the “crisis” is more subtle: a slow burn of fiscal strains, geopolitical realignments, and creeping distrust in institutions.
For investors and professionals, the takeaways are clear. Diversification into hard assets is gaining momentum, and not without reason. Gold’s role as a portfolio stabilizer is reasserting itself; even at record nominal prices, it’s attracting huge inflows as a form of insurance. The traditional inverse relationship with the dollar is not sacrosanct – when confidence in both major fiat blocs (dollars and euros) is tested, gold can rise against all currencies at once. Silver’s concurrent jump and its industrial strategic importance highlight that this is a broader precious metals renaissance.
Finally, it’s worth pondering the source of the $200 gold move. The evidence suggests it came not from panic, but from prudence – a reallocation from the quiet corners of cash and currency reserves into the safety of bullion. If that is the case, this gold surge could very well be the early tremor before larger quakes. Investors are effectively voting with their wallets, and their message is a cautious one: prepare for potential storms by holding real assets. Gold’s unusual rally, defying the dollar gravity, might be the canary in the coal mine for broader shifts to come – from an era of easy money and faith in central banks to one where tangible value and trust (or the lack thereof) drive decisions. As always, gold is both a barometer and a beneficiary of such paradigm shifts.
Sources:
Reuters – “Gold hits a record $3,532…main drivers fueled by U.S. President Trump’s upending of policy and Fed independence concerns.”
ETF.com – “GLD led all ETFs last week, hauling in $2.3B as gold flirted with $3,500.”
Reuters – “Gold tops $3,500… FT: ‘Gold surges after Trump’s Fed pressure’… Bloomberg: ‘Record high as rate-cut bets fuel demand.’”
BullionVault – Order flow: “Asian gold ETFs shrank…while European and North American products have now expanded together in 7 of the past 8 weeks, the strongest stretch in 27 months.”
Reuters – Physical market: “As gold prices jump… customers race to cash in old jewellery… If the rush to sell continues, could temper gold’s rally.”
BullionVault – “Dollar gold hit new highs…but Euro and Yuan price of gold held beneath spring highs”
BullionVault – COT data: “Net long position of Managed Money traders 4-year high…155% of long-term average.”
Reuters – “Silver breached $40, highest since 2011… momentum traders involved after US proposal to label silver a critical mineral helped fuel the surge.”
BullionVault – “Western stock markets dropped only 1.5% from last week’s record… long-term gov’t debt fell, driving yields higher, even as gold rose.”
ECB Financial Stability Review (via Frank Holmes) – “Gold now represents 20% of global FX reserves vs 16% for the euro – first time gold’s share exceeds euro’s.”
Reuters – Christine Lagarde: “France is solid but any risk of a government falling in the euro zone is a concern.”
Reuters – “Annual central bank gold purchases have exceeded 1,000 tons since 2022, double the 2010s average”
World Gold Council – “Gold ETFs saw 397t inflows Jan-June 2025, the largest first-half inflow since 2020.”
ECB Research – “In extreme cases (9/11, pandemic onset), gold prices tend to rise alongside the US dollar while stock and bond prices decline markedly – confirming gold’s safe-haven role in times of stress.”
- Gold trades near record highs on US rate cut bets; silver at 14-year high | Reuters
- Gold Surpasses Euro as the Second-Largest Reserve Currency in the World
- What does the record price of gold tell us about risk perceptions in financial markets?
- Gold Tops $3500 Record Price | Gold News
- Gold ETF Inflows Lead $34.3B Surge Into U.S.-Listed ETFs
- Gold ETF Investing Flips from East to West | Gold News
- After the gold rush: Asian, Mid-East sellers flood jewellery market | Reuters
- Central bank demand propels safe-haven gold to record peak | Reuters
- Explainer: Gold's record-breaking rally: who's keeping it going? | Reuters
- Global flows stay hot | World Gold Council
- France's far-right RN says it is getting ready for potential snap elections | Reuters
- Eurozone Financial Crisis: Debt and Derivative Dangers
Bitcoin range: 110k defended, 111.9–114k caps the upside__________________________________________________________________________________
Market Overview
__________________________________________________________________________________
BTC is consolidating above 108.7–109.0k after the pullback from ATH, capped under 111.9–114.0k. Short-term momentum is improving while 6H/12H remain corrective.
Momentum: 📈 Neutral-to-slightly bullish above 110k, but capped by 111.9–113.5k; 6H/12H still in a corrective trend.
Key levels:
- Resistances (HTF/MTF) : 111.9–113.5k (W/720 pivots), 114.0k (240 PL→R), 120.0k (W PH).
- Supports (HTF/MTF) : 110.0–110.2k (recent shelf), 108.7–109.0k (720 PL cluster), 107.3k (240 PL).
Volumes: Very high on 2H/1H/30m/15m; normal on 1D → credible rebound, not yet HTF-validated.
Multi-timeframe signals: 1D in NEUTRAL BUY above 108.7k; 12H/6H/4H trending down (sell-the-rips below 111.9–113.5k); STTF (2H/1H) improving on volume.
Risk On / Risk Off Indicator context: SELL (moderate risk-off) → contradicts the intraday bounce, so be cautious until 114.0k is reclaimed.
__________________________________________________________________________________
Trading Playbook
__________________________________________________________________________________
Compressed range: favor opportunistic executions at the edges; wait for confirmed breaks.
Global bias: Neutral-to-slightly long above 110k while 108.7k holds; swing invalidation on 1D close below 108.7k.
Opportunities:
- Defensive buy on 110.0–110.2k retest; target 111.9k then 113.5k if break confirms.
- Tactical sell on rejection at 111.9–113.5k; target 110.0k then 108.8k.
- Breakout buy if 12H/1D close >114.0k; target 117.4k.
Risk zones / invalidations:
- Loss of 108.7k on HTF close invalidates longs, opens 107.3k then 95.3k if weakness extends.
- Acceptance >114.0k invalidates most shorts, exposing 117.4k.
Macro catalysts (Twitter/News):
- Fed leaning to a 25bp cut (Sep 17 FOMC) with a bull steepener → supports dip buys if ISM/Jobs confirm.
- Gold at record (>3,500$/oz), softer USD, Asian equities broadly positive → mild tailwind for risk.
- Policy divergence (ECB dovish, BOJ cautious) + geopolitics → potential capping below 113.5–114.0k.
Action plan:
- Long Plan: Entry 110.0–110.2k / Stop 109.6k / TP1 111.4k, TP2 111.9k, TP3 113.5k (≈1.8–2.5R).
- Short Plan: Entry 112.0–113.0k on rejection / Stop 113.7k / TP1 110.0k, TP2 108.8k, TP3 107.3k (≈1.6–2.2R).
__________________________________________________________________________________
Multi-Timeframe Insights
__________________________________________________________________________________
Overall, timeframes are compressing: HTF resilient, MTF corrective, STTF recovering on strong volumes.
1D: Holding above 108.7–109.0k; acceptance >114.0k would open 117.4k then 120.0k.
12H/6H/4H: Lower highs/lows, favor sell-the-rips below 111.9–113.5k; rejection there likely retests 110.0k then 108.8k.
2H/1H/30m/15m: Strong-volume rebound; as long as 110k holds, a squeeze toward 111.9k then 113.5k is possible; losing 110k points back to 108.8k.
Key confluences: Multi-TF support 108.7–109.0k; ceiling 111.9–113.5k with 114.0k as decision level → compressed structure favors an imminent move.
__________________________________________________________________________________
Macro & On-Chain Drivers
__________________________________________________________________________________
Macro modestly supports dip-buys while background risk-off tempers upside; on-chain is neutral-to-cautious, aligned with the technical range.
Macro events: Markets price Fed cuts with a bull steepener; gold at record (>3,500$/oz), softer USD, Asia broadly green; ECB leaning dovish, BOJ cautious; upcoming US CPI/PMI/ISM and Jobs in focus.
Bitcoin analysis: Ichimoku Tenkan/Kumo as overhead resistance; key pivot 110.4–110.7k; some watch 103–100k on downside; ETFs saw net inflows in August despite -6.5% spot → ongoing institutional demand.
On-chain data: Large transfers (e.g., 7,860 BTC, 6,002 BTC) → potential liquidity/volatility; 6m/CTH cost basis near 107–108.9k as support; STH stress near 113.6k; no broad capitulation (SOPR ~1).
Expected impact: Confluence for a 108.7–113.6/114.0 range; easing bias may help a topside break if volumes persist, otherwise rallies cap below 114.0k.
__________________________________________________________________________________
Key Takeaways
__________________________________________________________________________________
BTC sits between 110k support and 111.9–114.0k resistance, with strong intraday volumes but a risk-off backdrop.
- Trend: neutral-to-slightly bullish above 110k, yet MTF remains corrective.
- Best setup: defensive long at 110.0–110.2k with <109.6k invalidation, or rejection short at 111.9–113.5k.
- Macro: Fed cut path and softer USD support dips, but caution below 114.0k.
Stay nimble: trade the edges and wait for a close >114.0k or <108.7k for direction. ⚠️  Long
Long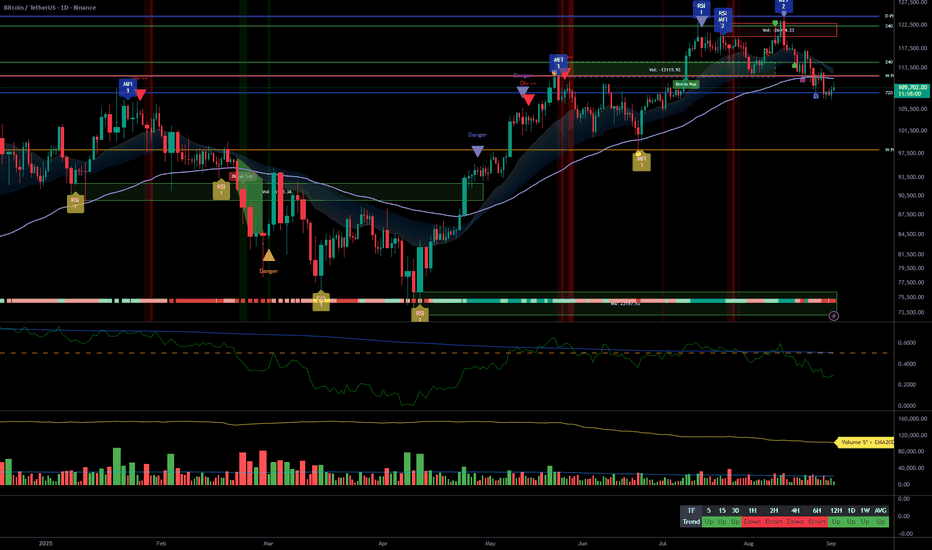
BTC MTF down, LTF volatile: Plan A short, Plan B reclaim__________________________________________________________________________________
Market Overview
__________________________________________________________________________________
BTC is consolidating at the range lows after the 120k–124k rejection, pressing the 108.8k pivot with a dominant bearish bias and sold rallies.
Momentum: Bearish 📉 — lower highs/lows with price pinned at 108.8k (12H/1D pivot).
Key levels:
• Resistances (4H–1D) : 110.9k–111.0k; 111,956 (W Pivot High); 113.5k.
• Supports (4H–1W) : 108.7k–108.8k (720 Pivot Low); 107,413 (240 Pivot Low); 98,353 (W extension).
Volumes: Normal on HTF; moderate on 1–2H; very high spikes on 30m → volatility concentrated on LTF.
Multi-timeframe signals: MTF trend is Down (1D/12H/6H); only notable exceptions are ISPD BUY on 2H/4H hinting at limited technical bounces toward 111k/113.5k.
Risk On / Risk Off Indicator: SELL — confirms the bearish momentum and risk-off regime, aligned with repeated rejections below 111k/111,956.
__________________________________________________________________________________
Trading Playbook
__________________________________________________________________________________
Strategic stance: with MTF downtrend and risk-off regime, favor selling rallies while staying nimble if a confirmed reclaim > 111,956 occurs.
Global bias: NEUTRAL SELL; key invalidation on a daily close > 111,956.
Opportunities:
• Short on rejection at 110.9k–111.96k → target 108.76k then 107.41k.
• Breakdown short on clean loss of 108.76k → possible extension into 107.41k.
• Counter-trend long only after a confirmed reclaim > 111,956 with volume → target 113.5k then 117.5k.
Risk zones / invalidations:
• A daily reclaim > 111,956 invalidates the short bias.
• A confirmed loss of 107.41k invalidates rebound scenarios and opens downside risk (98.35k in HTF view).
Macro catalysts (Twitter/News):
• Fed (Daly) turning dovish → potentially supportive for risk if confirmed.
• Elevated geopolitical tensions → higher risk premium, supportive of risk-off.
• US markets closed Monday (Labor Day) → thinner liquidity, amplified BTC volatility.
Action plan:
• Plan A (preferred, range short): Entry 111.0k–111.9k / Stop 112.6k / TP1 108.76k, TP2 107.41k, TP3 98.35k (optional) → R/R ~2.0–3.0.
• Plan B (bullish contingency): After a 1D close > 111,956, buy pullback 112.0k–112.2k / Stop 111.0k / TP1 113.5k, TP2 117.5k, TP3 120k (retest zone) → R/R ~1.5–2.5.
__________________________________________________________________________________
Multi-Timeframe Insights
__________________________________________________________________________________
HTFs remain bearish while LTFs are volatile with a few unconfirmed bounce signals.
1D/12H/6H: LH/LL structure capped below 110.9k–111.96k; pressure on 108.76k then 107.41k; below 107.41k opens a window to 98.35k extension.
4H/2H: NEUTRAL SELL with local ISPD BUY; bounces toward 111k/113.5k only if > 111,956 is reclaimed, otherwise rallies tend to fail and get sold.
1H/30m/15m: SELL; micro-range 108.3k–109.8k; very high 30m volume → watch for sweeps under 108.7k with quick reclaim for scalps, else continuation toward 107.41k.
__________________________________________________________________________________
Macro & On-Chain Drivers
__________________________________________________________________________________
Macro stays risk-off, but crypto-native flows (ETFs/stablecoins) provide dip support.
Macro events:
• Fed’s Daly hints at recalibration → more dovish tilt, potentially risk-supportive.
• China PMIs are mixed (manufacturing contraction) → fragile global growth signal.
• Hot geopolitics + US holiday → thinner liquidity and higher risk aversion.
Bitcoin analysis:
• Spot ETF net inflows → structural bid.
• Spot demand neutral; perps more sell-leaning; critical 107k–108.9k (6M cost) vs 113.6k (3M cost) as rebound supply.
On-chain data:
• Large seller-related transfers → near-term sell-side risk.
• Rising stablecoin issuance (USDT/USDC) → fresh dry powder to support dips.
Expected impact: Risk-off favors “sell the bounce” below 111,956; ETF inflows and stablecoin liquidity may cushion 108.7k/107.4k; a sustained loss of 107k–108.9k would expose 93k–95k.
__________________________________________________________________________________
Key Takeaways
__________________________________________________________________________________
The market is bearish overall with LTF-driven volatility.
- Trend: bearish/NEUTRAL SELL while capped below 111,956.
- Best setup: sell rallies into 110.9k–111.96k toward 108.76k/107.41k; long only on a confirmed reclaim > 111,956.
- Key macro: risk-off backdrop, partially offset by ETF inflows and rising stablecoin liquidity.
Stay focused: watch 108.76k’s reaction and any reclaim above 111,956 to adjust bias.
__________________________________________________________________________________
__________________________________________________________________________________
BTC – Fakeout Before the Big Breakout!Bitcoin has been repeating a familiar pattern:
- Fakeouts below key support zones, trapping early sellers.
- Breakouts back above structure, followed by strong impulsive moves.
We’ve already seen this sequence twice in the past months, and BTC might be setting up for it once again. Price faked out below support, reclaimed it, and is now eyeing a breakout from the falling channel.
🔁If history rhymes, the next leg could trigger a powerful impulse toward new highs. Traders should keep an eye on the $112,000–$114,000 zone — a breakout from here could be the spark for the next rally.
Is BTC about to repeat its playbook? 👀
📚 Always follow your trading plan regarding entry, risk management, and trade management.
Good luck!
All Strategies Are Good; If Managed Properly!
~Richard Nasr Long 
SBET vs DFDV: Which Crypto Treasury Horse Will Run Fastest?SharpLink Gaming (SBET) and DeFi Development Corp. (DFDV) are prime examples of the MicroStrategy model applied to different digital assets, Ethereum and Solana, respectively.
SharpLink Gaming, formerly an online gaming company, has made a dramatic and public pivot to become one of the world's largest corporate holders of Ether (ETH). Its strategy is to act as a direct and transparent vehicle for investors to gain exposure to the Ethereum ecosystem. The company actively raises significant capital through equity offerings, such as its recent multi-billion dollar ATM program, to fund its ETH acquisitions. It also generates yield by staking its ETH, which is a key part of its business model. The company's stock price and market narrative are now almost exclusively tied to the performance of its growing ETH treasury, making it a high-beta proxy for Ethereum.
DeFi Development Corp. has a similar, dedicated focus on Solana (SOL). The company's business is centered on accumulating, compounding, and providing exposure to SOL. DFDV's core strategy is to grow its "SOL per share" metric, which is its equivalent to MicroStrategy's Bitcoin per share. To achieve this, DFDV also engages in aggressive capital raises. Like SharpLink, it also generates revenue by actively participating in the ecosystem through staking, operating its own validator nodes, and exploring other on-chain opportunities.
In essence, both companies have fundamentally transformed their business models to serve as publicly-traded, regulated treasury vehicles for their respective assets. They both use financial engineering, like capital raises, to grow their holdings and create a leveraged play for investors. The primary difference is the underlying asset—ETH for SBET and SOL for DFDV—and the specific ecosystem activities they engage in to generate additional value beyond simple price appreciation.
Market Cap
Comparing the market capitalization of Ethereum (ETH) and Solana (SOL) is crucial for understanding the capital flows needed for one to outperform the other. As of late August 2025, ETH's market cap is approximately $429 billion, while SOL's is about $87 billion, meaning ETH is nearly 5 times larger.
For SOL to outperform ETH, it must grow at a much faster rate. Due to its smaller size, SOL requires a proportionally smaller amount of new capital to achieve a significant price increase. For example, to close the market cap gap by 10%, SOL would need an additional $43 billion in inflows, which would cause its price to more than double. In contrast, for ETH to achieve the same proportional gain (e.g., a 10% increase), it would need over $40 billion in new capital inflows.
Essentially, SOL has a higher beta and a lower monetary hurdle to achieve significant percentage gains. A steady inflow of tens of billions of dollars would have a much more dramatic impact on SOL's price than on ETH's. However, with ETH's sheer size and institutional backing, particularly with the recent launch of spot ETFs, it can absorb and channel much larger capital flows, which is a key reason its price is less volatile. Therefore, SOL's smaller size makes it more sensitive to inflows, making it easier for it to outperform ETH on a percentage basis, especially during a retail-driven bull market.
Impact of Spot ETFs
A significant number of spot Ethereum ETFs have already been approved and are trading in the United States. Following the approval of the initial 19b-4 filings in May 2024, the SEC subsequently declared several S-1 registration statements effective in July 2024, allowing the ETFs to begin trading. There are currently nine SEC-approved spot ETH ETFs from major issuers like BlackRock, Fidelity, and Grayscale. There are currently no approved SOL spot ETFs in the United States. However, several applications are under active consideration by the SEC. Filings from major issuers such as Bitwise and 21Shares have been submitted, but the SEC has consistently delayed its decision on them. There is a general expectation that if the SEC continues to follow the precedent set by Bitcoin and Ethereum, a Solana ETF could be the next in line for approval. In summary, a clear distinction exists: ETH spot ETFs are a reality, with multiple products already trading, while SOL spot ETFs are still in the application and review phase, awaiting a decision from the SEC.
Summary
While ETH has had relative outperformance in August 2025 against Bitcoin and most large-cap alts, the approval of Solana spot ETFs will provide a significant tailwind for SOL and SOL treasury companies like DFDV. While Ethereum is the strongest horse among the alts, has experienced no downtime, and gas fee transactions on the main chain have become much cheaper than they were the last cycle, hot money will quickly allocate capital towards the highest-beta alts and crypto treasury companies as ETFs are approved; possibly on a rolling basis if underlying assets are approved at different times in Q4. However, expect ETH and SBET to do exceptional through 2026 as ETH hits mainstream adoption through ERC-20 based tokenized stocks, prediction markets, etc. and as spot ETF inflows accelerate. BTC Between 112.6k and 117k: Trade the Pivot, Not the Ego__________________________________________________________________________________
Market Overview
__________________________________________________________________________________
BTC is consolidating below 117k after a clean rejection, pressing a major HTF support around 112.6k. The pullback is orderly, with intraday downside inside a still constructive 1D/1W trend. ⚖️
Momentum: 📉 Tactically bearish — intradays trend down while 1D/1W remains broadly bullish.
Key levels:
- Resistances (HTF/MTF): 115.5–116.5k (4H–12H supply), 117,063 (240 Pivot), 124,277 (D Pivot).
- Supports (HTF): 112,646 (240 Pivot), 111,959 (prior W High), 110–109k (lower liquidity zone).
Volumes: Overall normal; moderate on 4H/15m → no climax, orderly pressure.
Multi-timeframe signals: 15m→12H trending down; 1D/1W still up. Holding 112.6k keeps daily structure constructive; a decisive close below opens 111.96k then 110–109k.
Risk On / Risk Off Indicator: VENTE (risk-off) — aligns with momentum and caps rebounds while below 117,063.
__________________________________________________________________________________
Trading Playbook
__________________________________________________________________________________
Stay defensive: prioritize fade-the-bounce below 117k, while watching for a clean bullish reaction at 112.6k for tactical longs. 🧭
Global bias: Overall NEUTRE VENTE below 117,063; primary invalidation on 4H/12H close > 117,063.
Opportunities:
- Rebound short: sell 114.5–116.0k toward 113.2k then 112.7k (while < 117,063).
- Tactical long: buy a wick + reclaim at 112.8–112.6k toward 114.8k then 117.1k.
- Bullish breakout: add only on confirmed reclaim > 117,063 toward 120–124k.
Risk zones / invalidations:
- Breakdown: a 2H/4H close < 112,646 invalidates tactical longs and exposes 111,959 then 110–109k.
- Reclaim: a 12H close > 117,063 invalidates rebound shorts.
Macro catalysts (Twitter, Perplexity, news):
- Jackson Hole: potential hawkish tone post-FOMC minutes (inflation-focused) → headwind for risk.
- Energy: oil rebound on US draws → short-term inflation pressure, supports risk-off.
- Geopolitics: Middle East/Ukraine tensions → headline risk and volatility.
Action plan:
- Preferred setup (reactive long at HTF support):
- Entry: 112.8–112.6k after wick and 1H reclaim
- Stop: < 111,959 (1H/2H close)
- TP1: 114.8k; TP2: 117,063; TP3: 120k
- R/R: ~2.0–2.8 depending on execution
__________________________________________________________________________________
Multi-Timeframe Insights
__________________________________________________________________________________
Overall, intradays push lower into an HTF support that higher timeframes still defend.
1W/1D: Higher-timeframe structure intact while 112.6k holds; potential rebounds toward 117.1k if a clean pivot reaction prints.
12H/6H/4H/2H: Bearish bias with lower highs/lows; 114.5–116.5k remains a sell zone; watch for acceleration if 112.6k breaks.
1H/30m/15m: Bearish drift, micro-range 113.2–114.6k; mean-reversion possible but sellers in control without volume extremes.
Key signal: 112,646/111,959 support confluence vs. Risk On / Risk Off Indicator in VENTE → decisive range battle; the break will define the next leg.
__________________________________________________________________________________
Macro & On-Chain Drivers
__________________________________________________________________________________
Macro risk-off (Fed/energy/geopolitics) weighs on sentiment while on-chain signals show timid demand near highs.
Macro events: Markets focus on Powell at Jackson Hole after inflation-leaning minutes; oil rebound adds to inflation angle; geopolitics raises risk premium.
Bitcoin analysis: Price ~113–114k; Monthly bullish, Weekly neutral, Daily bearish; US spot ETF outflows vs. HK listings — mixed institutional signals consistent with consolidation below 117k.
On-chain data: 1Y MVRV Z-Score slightly < 0; subdued activity/fees near ATHs → modest spot demand, market catalyst-sensitive.
Expected impact: Macro/on-chain backdrop supports an NEUTRE VENTE bias while 112.6k is pressured and no pro-risk catalyst emerges.
__________________________________________________________________________________
Key Takeaways
__________________________________________________________________________________
Market is testing a key HTF support with intradays bearish but no capitulation.
- Overall trend: tactically bearish, higher-timeframe bullish if 112.6k holds.
- Most relevant setup: reactive long at 112.8–112.6k with tight stop; otherwise fade 114.5–116k.
- Key macro factor: Jackson Hole tone that could trigger range resolution.
Stay disciplined: wait for confirmation at the pivot — the break will decide. 🔎
__________________________________________________________________________________
__________________________________________________________________________________
S&P 500 ETF & Index– Technicals Hint at a Possible Correction📉📊 S&P 500 ETF & Index at Resistance – Technicals Hint at a Possible Correction 🔍⚠️
Everything here is pure technicals— but sometimes, the market whispers loud and clear if you know how to listen. 🧠📐
The VOO ETF, which tracks the S&P 500 , has now reached the upper boundary of a long-term ascending channel, once again brushing against resistance near 590.85. This zone has consistently led to major pullbacks in the past.
On the right panel, the US500 Index mirrors this move—pushing toward all-time highs, right as broader sentiment turns euphoric. Technically, both charts are overextended and pressing into key zones.
👀 Potential Path:
🔻 Rejection from current zone ➝ Down toward 526.17, then 465.72 (green support channel)
🔁 Possible bounce after correction — trend still intact long term
And while we’re keeping it technical, it’s worth noting that the Buffett Indicator (Stocks-to-GDP) i s currently screaming “overvaluation.” This doesn't predict timing—but it adds macro context to an already overheated chart setup.
The lesson? Price respects structure. Whether or not the fundamentals are in agreement, the charts are warning that now may not be the time to chase.
History doesn’t repeat, but it often rhymes. Stay sharp, stay technical. 🎯
One Love,
The FX PROFESSOR 💙
ps. the beauty of these levels? Tight Stop loss- excellent R/R
Disclosure: I am happy to be part of the Trade Nation's Influencer program and receive a monthly fee for using their TradingView charts in my analysis. Awesome broker, where the trader really comes first! 🌟🤝📈  Short
Short
 Long
Long
 Long
Long
 Long
Long
Bitcoin Uptrend Intact, Pullback First? 120.0k–119.8k is Key!__________________________________________________________________________________
Market Overview
__________________________________________________________________________________
BTC is hovering near 120.6k after a clean reclaim above the 119.8k pivot, now pressing into the 121k–122.3k daily supply cluster. Trend is bullish, but we’re trading into resistance.
Momentum: 📈 Bullish, multi-timeframe HH/HL, yet approaching a dense 121k–122.3k supply.
Key levels:
- Resistances (4H/1D) : 121,000–121,500 • 122,318 (D) • 123,235 (240)
- Supports (1H/4H/1D) : 119,800 (720 pivot) • 118,500 (240) • 115,860 (240)
Volumes: Normal across most TFs; prior spikes accompanied the 119.8k breakout.
Multi-timeframe signals: 1D/12H/6H trending up toward 122.3k; 4H/2H high-base consolidation; 30m/15m locally overbought under 121k, favoring pullbacks to 120.0k–119.8k.
Risk On / Risk Off Indicator: Neutral Buy backdrop, but tilting Neutral Sell → Sell on the very short-term, slightly contradicting the bullish push into resistance.
__________________________________________________________________________________
Trading Playbook
__________________________________________________________________________________
Strategic stance: uptrend intact—prefer buy-the-dip over chasing breakouts until we get a daily close above 122,318 with volume.
Global bias: Buy bias (Neutral Buy) while 119.8k holds; key invalidation on a close below 119.8k.
Opportunities:
- Buy the dip at 120.0k–119.8k targeting 121.5k then 122.3k/123.2k.
- Bullish breakout on H4/D close > 122,318 toward 123,235 (let it run if flows expand).
- Tactical fade 120.9k–121.1k back to 120.0k if Risk On/Off stays in Sell on LTFs.
Risk zones / invalidations: Strong rejection at 122.3k plus a close < 119.8k = bull trap risk and range-back toward 118.5k; loss of 118.5k could open 115.9k.
Macro catalysts (Twitter, Perplexity, news):
- Spot ETF inflows remain positive and above new supply → supports dip-buying.
- China liquidity mixed, Euro CPI contained, no major macro shocks → technical breakout must be confirmed by volume.
- Rotation to ETH/Alts + slowing derivatives momentum → near-term cap risk on breakouts.
Action plan:
- Plan A (buy-the-dip): Entry 120.0k–119.8k / Stop < 119.6k / TP1 121.5k, TP2 122,318, TP3 123,235 • R/R ~2–3.
- Plan B (breakout): Entry on retest 122.35k–122.5k after H4/D close > 122,318 / Stop ~122.0k / TP1 123,235, TP2 let it run • R/R ~1.5–2.
__________________________________________________________________________________
Multi-Timeframe Insights
__________________________________________________________________________________
HTFs remain bullish while LTFs are stretched into resistance.
1D/12H/6H: HH/HL above 119.8k; H4/D close > 122,318 unlocks 123,235; look for volume expansion to validate extension.
4H/2H: High-base consolidation under 121k–122k; better R/R on pullbacks to 120.0k–119.8k than chasing an immediate break.
30m/15m: Local overbought and Risk On/Off in Sell; higher odds of a pullback toward 120.0k/119.8k before any attempt above 122k.
__________________________________________________________________________________
Macro & On-Chain Drivers
__________________________________________________________________________________
Macro is calm-to-supportive; ETF flows backstop BTC, but rotation to alts and slower derivatives momentum argue for caution on breakouts.
Macro events: China credit/liquidity mixed; Spain CPI contained (ECB pressure tempered); US deficit keeps the debasement/hedge narrative alive.
Bitcoin analysis: Spot ETF inflows (+$65.9M) with IBIT buys > mined supply support demand; BTC dominance slipping (rotation to ETH/Alts) can cap near-term outperformance; futures momentum has cooled.
On-chain data: Risk-on but not euphoric; compressed IV and high alts OI increase sensitivity to surprises; STH resistance near ~127k as an upper on-chain area.
Expected impact: Constructive for dip-buys; demand confirmation (volume/flows) needed to validate a daily break above 122.3k.
__________________________________________________________________________________
Key Takeaways
__________________________________________________________________________________
An uptrend is probing a 121k–122.3k daily supply cluster with normal volumes and a mixed short-term Risk On/Off read.
- Trend: bullish 📈 while 119.8k holds.
- Top setup: buy-the-dip 120.0k–119.8k; only confirm continuation on a close above 122,318.
- Macro: ETF inflows positive, macro calm; rotation into alts may cap BTC near-term.
Stay patient: favor pullbacks and wait for an H4/D close with volume to “pay” the break above 122.3k. 👀 BTC 1H Analysis – Key Triggers Ahead | Day 9💀 Hey , how's it going ? Come over here — Satoshi got something for you !
⏰ We’re analyzing BTC on the 1-hour timeframe after today’s CPI release .
👀 Following the CPI news, Bitcoin broke through key areas — including the descending channel and the $117,000 resistance — and moved higher. It then faced rejection from the previous high, pulling back to around $118,000, which aligns with a multi-timeframe 4H SMA25 bounce. After that, it broke the $119,000 level and is now heading toward its key resistance at $120,000.
🎮 Fibonacci drawn from the current high to the price jump zone shows our current key level at 0.61, which is a relatively strong resistance. Breaking above this Fibonacci level could send BTC toward its current high and potentially lead to a new ATH.
⚙️ On the RSI oscillator, the key level is 70. Entering the overbought zone could push BTC toward its current high.
👑 The 99 MA is forming a strong base below the 0.37 level, while the 25 MA is working to break resistance and push price upward. On the 4H multi-timeframe view, the 0.23 area acts as a rebound zone after touching the 25 MA.
🕯 Volume and trade count are increasing, with solid consolidation above zones where whales have been buying and accumulating. Following today’s CPI results, fresh capital has flowed into risk assets like Bitcoin. This could be highly attractive for other coins, especially BTC pairs that are bullish in these conditions.
🔔 You can set an alert at the $120,000 area to watch price action when it reaches this level. If it matches your setup confirmations, you can open a position. Personally, I have a profitable long position on Ethereum, which is considered a BTC pair.
📊 On the 1H timeframe for USDT.D, we can see that after reacting to 4.20%, it faced a drop, and with a break below 4.10%, BTC could set a new high.
🖥 Summary: Bitcoin is moving toward its $120,000 resistance, where we could consider opening positions. The most important factor will be holding and confirming above this level.
❤️ Disclaimer : This analysis is purely based on my personal opinion and I only trade if the stated triggers are activated .
Long 
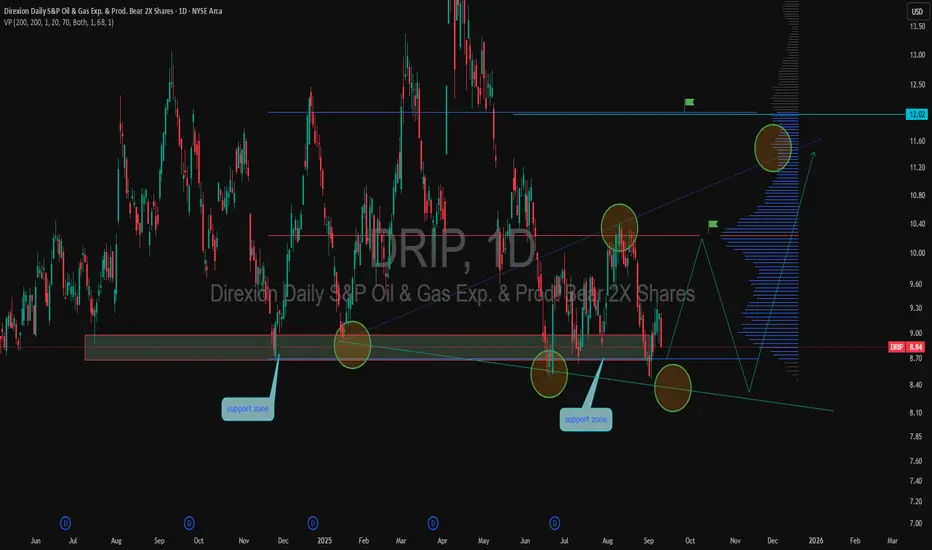
DRIP: the bear in an oilskin ready to huntDRIP: the bear in an oilskin ready to hunt
Technical analysis:
DRIP has built a solid support zone between 8.60–9.00, showing volume accumulation and smart money activity. After a recent bounce, the price broke above the 10.00 level and is holding above 10.15. The next resistance is at 10.88, followed by 12.81 and the strategic target of 14.89.
EMA and MA have turned upward, confirming a short-term trend change. MACD is moving toward the positive zone, while RSI remains neutral with room to rise.
Tactical plan: consider buying on a pullback to 10.00-10.15 with targets at 10.88, 12.81, and 14.89. Stop loss below 9.80.
Fundamental overview:
DRIP is an inverse ETF on the oil & gas sector, delivering 2x returns opposite to the market trend. Growing interest is linked to expectations of oil price declines amid potential commodity market correction, geopolitical instability, and seasonal demand slowdown. Another factor is possible OPEC+ announcements on production cuts, which could boost volatility.
Conclusion:
If oil prices stumble over geopolitical hurdles, DRIP might stage a rally where the only bored ones will be those left without a position. Long 
BTC Support Tested, Mixed Cross-TF Signals, Tactical Caution__________________________________________________________________________________
Technical Overview – Summary Points
__________________________________________________________________________________
Momentum & context: Bullish bias confirmed on higher timeframes (1D/4H), but bearish divergences appearing from 2H downward.
Major support/resistance: 114,600–115,000 and 114,667 hold as the critical zone. Key resistance: 116,900–117,000 must break for a bullish trigger.
Volume: Normal on HTF. Very high volumes detected on 30min/15min during the 116,000+ resistance test (climax/reversal risk).
Multi-timeframe behavior: Risk On / Risk Off Indicator = “Strong Buy” from 1D to 1H, short-term sellers active below 2H (ISPD = Sell on 15min).
__________________________________________________________________________________
Strategic Summary
__________________________________________________________________________________
Overall bias: Bullish structure preserved, but fragility evident on intraday.
Opportunities: Tactical buys possible on 114,600–115,000 (stop <114,000) or strong breakout above 116,900.
Risk: Clear break below 114,000 = risk of drop to 110,000. Volume climax/ISPD Sell below resistance = profit taking advised.
Macro catalysts: Ongoing geopolitical news (US/Russia/China), volatility during US announcements; post-Fed digestion.
Action plan: Strict monitoring of ETF flows/funding/US news. Cautious accumulation on daily/4H, short-term shorts only if confirmed by lower timeframe signals.
__________________________________________________________________________________
Multi-Timeframe Analysis
__________________________________________________________________________________
1D: Strong upward bias, price at major support, calm volume.
12H/6H/4H: Robust sectorial momentum (Risk On / Risk Off Indicator “Strong Buy”), daily/4H supports holding, initial bearish signs on 2H/1H.
2H/1H: Growing fragility: “Down” trend confirmed on 2H, momentum loss, buyer exhaustion visible.
30min/15min: Very high volumes under resistance, ISPD Sell 15min: short-term correction alert. Overbought microstructure, trigger risk if rejection at 116,000–116,250.
Cross-TF summary: Market mostly “Up”, but tactical vigilance around supports, increased caution above 116,000.
Summary:
- Bullish structure maintained on daily/4H, but top/reversal warning signals on brief lowest TFs (15/30min).
- 114,600–115,000 pivot zone is decisive: holding = increased stabilization/accumulation probability; break = risk of extension down to 110,000.
- Active monitoring of ETF flows/funding/news is essential.
__________________________________________________________________________________
Macro & Bitcoin Analysis (Twitter Summary)
__________________________________________________________________________________
Geopolitical risks remain high, US/China protectionism & Fed on hold: crypto market in wait-and-see mode.
BTC broke 116k, entered low-liquidity zone; rebound remains “fragile.”
ETF flows: moderate return to buying, funding neutral.
Possible post-pullback accumulation signal, but needs confirmation.
Strategy: swing buy on defended/major supports, strict management if short-term seller signals (volume/ISPD).
__________________________________________________________________________________
Action Steps
__________________________________________________________________________________
Buy on 114,600–115,000 zone if confirmed by daily/4H, stop loss <114,000.
Re-buy or more aggressive swing on clear breakout above 116,900–117,000.
Take profits/short if clear rejection 116,000+ with volume climax/ISPD Sell.
Monitor macro (US events), ETF flows, funding rate, volume behavior.
 Long
Long
Bitcoin - Will Bitcoin reach its previous ATH?!Bitcoin is below the EMA50 and EMA200 on the four-hour timeframe and is in its short-term descending channel. In case of an upward correction, Bitcoin can be sold from the specified supply zone, which is also at the intersection of the ceiling of the descending channel.
It should be noted that there is a possibility of heavy fluctuations and shadows due to the movement of whales in the market and compliance with capital management in the cryptocurrency market will be more important. If the downward trend continues, we can buy in the demand range.
In recent days, Bitcoin has stabilized below the $120,000 mark, a development that reflects increasing structural maturity in the market and strong institutional capital inflows. Unlike in previous cycles, where price rallies were largely driven by retail hype, the current liquidity flows are channeled through regulated and professional instruments like ETFs. During the month of July alone, Bitcoin ETFs attracted over $6 billion in inflows, marking the third-highest monthly inflow in their history. Leading this trend were BlackRock’s IBIT and Fidelity’s FBTC, which together recorded more than $1.2 billion in net inflows within a single week. This signals a shift in trust from traditional investors toward crypto markets—within transparent, traceable, and regulated frameworks.
On-chain metrics further validate this shift. The MVRV ratio, which compares market value to realized value, is currently fluctuating between 2.2 and 2.34. These levels do not indicate profit-taking extremes nor fear of major corrections, but instead point to a healthy and rationally profitable market. Meanwhile, the supply of Bitcoin held in non-exchange wallets is rising, while exchange-held balances have dropped to their lowest levels in a decade, now accounting for just 1.25% of total supply. This trend implies reduced short-term selling pressure, as coins transition from liquid to long-term holdings.
Trader behavior is also evolving. Unlike previous bull runs, profit-taking remains controlled. The SOPR index, which measures realized profit relative to purchase price, has not yet reached saturation levels. This suggests that current holders are not satisfied with existing gains and are anticipating higher price levels. Furthermore, metrics like daily active addresses remain stable, indicating a lack of speculative retail influx. The network’s current dynamics resemble those of mature traditional markets, where investment decisions are guided by analysis, discipline, and long-term perspective.
Analysts at major financial institutions believe that if this trend continues, Bitcoin could reach targets of $180,000 to $200,000 by year-end. A more conservative scenario places the $95,000 to $100,000 range as a strong support zone—especially if political, regulatory, or macroeconomic pressures intensify. Overall, the convergence of institutional capital, rational trader behavior, stable on-chain conditions, and regulatory clarity has transformed Bitcoin into a more structured and dependable asset than ever before.
Ultimately, Bitcoin is no longer just a speculative tool. It has secured its role as a legitimate asset within the portfolios of global financial institutions. Even if the pace of capital inflow is slower than in previous cycles, the underlying structure is more robust and sustainable—offering a clearer path toward broader global adoption and higher valuation.
Nonetheless, recent data from CryptoQuant suggests that long-term Bitcoin holders (LTHs) have begun net selling near the $120,000 resistance zone—a psychologically significant level in Bitcoin’s price history. Analysts interpret this as a potential sign that veteran investors—those who entered during earlier market cycles—are now realizing profits as prices reach historic highs. If short-term holders follow suit, this shift could amplify selling pressure and trigger heightened price volatility. Short 
S&P 500 ETF & Index Hit Resistance – A Technical Warning Shot 📉⚠️ S&P 500 ETF & Index Hit Resistance – A Technical Warning Shot 🔍🧠
Following up on the video I just posted , I had to share this updated chart of the VOO ETF (Vanguard S&P 500) and US500 Index , now that both are testing key resistance levels.
On the left: AMEX:VOO has reached the very top of a multi-year ascending channel—a zone that has historically triggered sharp corrections. The level at 590.85 marks a major resistance zone.
On the right: The US500 Index is showing a similar technical overextension, trading just under 6,450, with 5,928.25 as the nearest support below.
🎯 Technicals at play:
VOO could retrace toward 526.17 and potentially 465.72, both of which are solid technical supports within this channel.
This setup doesn't mean panic—but it does argue for caution, especially after such an extended run.
🧠 And yes, the Buffett Indicator (Stocks-to-GDP) continues to point toward an overheated market . While it's not a timing tool, it adds macro weight to the technical signals.
In the video, I also touched on:
Taking profits on NASDAQ:NVDA after a near-perfect technical rejection at target.
Reviewing Rolls Royce nearing upper channel resistance.
Gold and Silver at inflection points—likely to be impacted if equities begin to unwind.
Rotational potential into Bitcoin and Ethereum, which may benefit from macro shifts.
This is how I trade: respect structure, stay proactive, and prepare before the move—not after. Let me know how you’re positioning or if you’re sitting on hands waiting for a dip.
One Love,
The FX PROFESSOR 💙
Disclosure: I am happy to be part of the Trade Nation's Influencer program and receive a monthly fee for using their TradingView charts in my analysis. Awesome broker, where the trader really comes first! 🌟🤝📈

ETH - BTC ETF News: What It Means for the Market+ China Rumors 🚨 ETH - BTC ETF News: What It Means for the Market + China Rumors 💥🌐
July just ended with a crypto bombshell 💣 — and the market is barely reacting.
Let’s break it down:
🧠 One part hard news.
🌀 One part geopolitical smoke.
🎯 All parts worth watching if you care about macro market shifts.
🏛️ SEC Approves Real BTC & ETH for ETF Flows (July 29)
Say goodbye to the cash-only ETF model.
The SEC now allows direct in-kind creation/redemption of Bitcoin and Ethereum in ETFs.
That means providers like BlackRock, Fidelity, VanEck can now use actual BTC/ETH, not just synthetic tracking.
✅ Bullish Impact:
💰 Real Spot Demand: ETF inflows = real crypto buying
🔄 Efficient Arbitrage: No middle step via cash = faster flows
🧱 TradFi + Crypto Merge: ETFs now settle with crypto — not just track it
🎯 Better Price Accuracy: Spot ETFs reflect true market value more cleanly
📉 The market reaction? Mild.
But don’t get it twisted — this is a structural reset, not a meme pump.
⚠️ But There’s a Bearish Angle:
🏦 Centralized Custody: Crypto now lives in Coinbase, Fireblocks vaults
⚠️ Network Risks: ETF performance now tied to ETH/BTC uptime
🧑⚖️ Regulatory Overreach: More hooks into validator networks, MEV relays
🌊 Volatility Risk: Panic redemptions = real BTC/ETH sold into open markets
Still, this is good news for Ethereum in particular.
Why? Because ETH isn’t just money — it’s infrastructure.
And now Wall Street is finally using it, not just watching it.
🇨🇳 And Then There’s China… Rumor or Tumor?
Crypto Twitter is swirling with unconfirmed whispers from July 29 that China may be prepping a major Bitcoin statement ahead of the BRICS summit.
But let’s be clear:
🚨 It’s a rumor. Or a tumor. 🧠
And like many tumors in crypto — there’s a 40% chance it brings bad news. 🤕
Still, here’s what’s being floated:
🧠 Speculations Include:
🔓 BTC re-legalization in “special finance zones” (HK-style)
🏦 BTC in national reserves (!)
🤖 CBDC integration or smart contract interoperability
⚒️ Return of official state-backed Bitcoin mining
🧯 But no official sources. Just geopolitics + timing.
China’s FUD/FOMO pattern is Bitcoin tradition — don’t get trapped by hopium.
But if even half of it is true... buckle up.
📈 Ethereum Leads the Charge — But Watch These Alts:
If ETFs go fully crypto-native, some sectors light up 🔥
🔹 1. Ethereum Layer 2s (ARB, OP, BASE)
→ ETF gas pressure = L2 scaling demand
🔹 2. DeFi Protocols (UNI, AAVE, LDO)
→ TradFi liquidity meets on-chain utility
🔹 3. ETH Staking Derivatives (LDO, RPL)
→ Institutions want yield = LSD narrative grows
🔹 4. Oracles (LINK)
→ ETFs need trusted on-chain data = Chainlink shines
🔹 5. BTC on ETH Bridges (ThorChain, tBTC)
→ If BTC flows into ETH-based ETFs, bridges light up
🚫 What I will Avoid:
❌ Memecoins – zero relevance to ETF flows
❌ GameFi – not part of TradFi’s roadmap
❌ Ghost Layer 1s – no users, no narrative, no pump
🧠 My Take:
ETH is building momentum toward $4,092 — the third breakout attempt on your 1-2-3 model.
🔥 The fuse is lit. Target? $6,036
Timing? Unknown. But structure is in place.
Meanwhile, Bitcoin Dominance is rising.
ETH is shining.
Solana — while powerful — continues paying the price for memecoin madness 💀
We’re entering a new phase — where ETFs settle with real crypto , China watches the stage, and macro money is warming up behind the curtain.
So stack smart.
Study the flows.
Don’t let silence fool you — the biggest moves come after the news fades.
One Love,
The FX PROFESSOR 💙
Disclosure: I am happy to be part of the Trade Nation's Influencer program and receive a monthly fee for using their TradingView charts in my analysis. Awesome broker, where the trader really comes first! 🌟🤝📈
Education

CRO (Crypto.com) $3 Target! Don't Miss This Move🪙 Ticker: OKX:CROUSDT
🕰 Chart: 1D (Heikin Ashi)
🔧 Tools Used: Fibonacci Extension, Fundamental News (ETF Filing)
🔍 Chart Analysis: Fibonacci Extension Targeting $3+
The Fibonacci Extension tool has been applied to the major CRO impulse wave from its peak near $0.90 (late 2021) to the 2022–2023 bottom at $0.0484, confirming a multi-year retracement and consolidation period.
Let’s break down the major Fib levels:
Extension Level Price Target
0.236 $0.2495
0.382 $0.3741
0.618 $0.5745
1.0 $0.9011
1.618 $1.4281
2.618 $2.2809
3.618 $3.1336
📌 Current Price: ~$0.12
🔥 Upside Potential to $3.13+ — a 25x move from current levels if full extension plays out!
📣 Fundamental Catalyst: CRO in Trump Media ETF
According to the chart note (sourced from SEC-related headlines):
"Trump Media filed with the SEC to launch a new ETF, the Truth Social Crypto Blue Chip ETF, which would primarily hold Bitcoin, but also Ether, Solana, Cronos (CRO), and XRP."
Even more important:
"Crypto.com is slated to act as the fund’s digital custodian."
This is massive fundamental validation for CRO — not just as a token, but as an ecosystem and financial infrastructure provider.
🌐 Why Crypto.com Matters: Utility, Ecosystem, Adoption
Crypto.com isn't just an exchange — it's a comprehensive Web3 ecosystem, which includes:
🔁 CEX (Centralized Exchange):
Buy, sell, stake, and trade hundreds of cryptocurrencies with high liquidity and low fees.
🔄 DEX (Decentralized Exchange):
Cronos Chain supports decentralized trading and DeFi apps — with low gas fees and EVM compatibility.
💳 Visa Credit Card Integration:
Crypto.com offers one of the most popular crypto Visa debit cards — earn cashback in CRO and enjoy perks like Spotify/Netflix rebates.
📱 Mobile Super App:
Buy/sell/stake/farm on-the-go with a seamless user interface.
📈 Earn & Lending Services:
Stake CRO or other assets for up to double-digit yields.
🤝 Strategic Partnerships
Crypto.com has been aggressively investing in brand and adoption:
🏟 Official partner of UFC, FIFA World Cup, and Formula 1
🏀 NBA’s Los Angeles Lakers Arena naming rights (Crypto.com Arena)
💼 Member of Singapore's regulated exchanges
🔐 ISO/IEC 27701:2019, PCI:DSS 3.2.1, and SOC 2 compliance — one of the most secure platforms in the industry
🧠 Conclusion: The Perfect Blend of TA + FA
With CRO being included in a potential U.S.-regulated ETF, the Crypto.com ecosystem booming, and technical patterns pointing to a Fib-based target above $3, CRO might be the sleeper play of the next bull run.
"The move nobody anticipates" might just be the most explosive one.
🎯 Short-Term Targets:
$0.25
$0.37
$0.57
🎯 Mid-Term Bull Targets:
$0.90 (prior ATH)
$1.42
$2.28
🎯 Full Cycle Extension:
$3.13
📢 Let me know in the comments:
Are you holding GETTEX:CRO ? What do you think about its inclusion in the ETF?
#CRO #CryptoCom #ETF #TrumpMedia #Altcoins #Bullrun #CryptoTrading #DeFi #FibTargets #CronosChain  Long
Long
 Long
Long