Long
Long
 Long
Long
 Long
Long
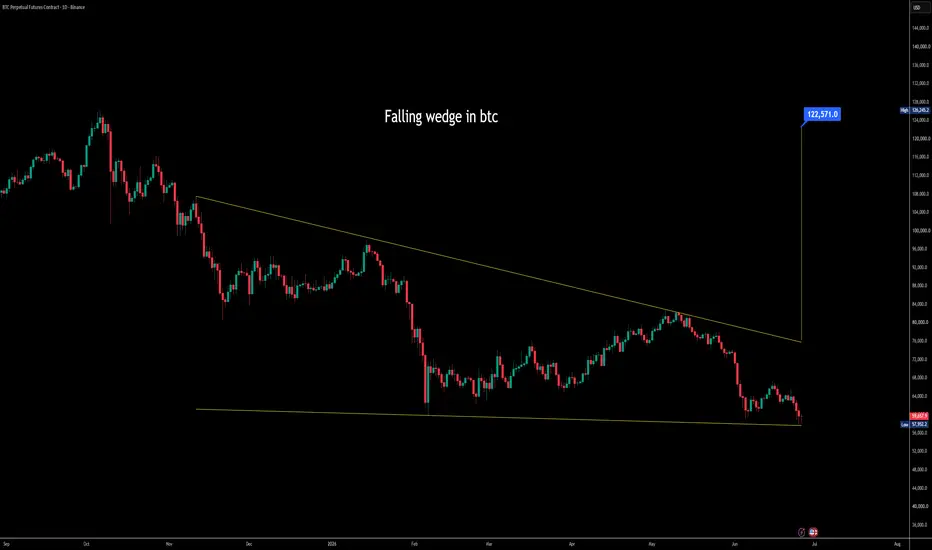
BTC: Falling Wedge Retest + Hidden Bullish DivergenceBTC: Falling Wedge Retest + Hidden Bullish Divergence
BTC is reacting from an important technical area.
Price broke above the upper trendline of the falling wedge, pulled back into that former resistance, and is now trying to turn it into support.
At the same time, Q is showing a hidden bullish divergence, which adds trend-continuation confluence to the bullish scenario.
This does not mean the move is fully confirmed yet. BTC is still inside the Value Area, and the next real test is the POC / VAMid zone above.
Core Thesis
BTC is attempting a bullish retest of the falling wedge breakout while trading inside value.
If buyers defend the retest zone and reclaim the internal value levels above, the market can rotate higher toward VAH.
If the retest fails, the move becomes a failed breakout and price can rotate back toward VAL and the lower developing profile.
Key Levels
Retest zone / upper wedge trendline: former resistance now acting as support
VAL ~62.2k: lower boundary of the current value area and key support
dPOC ~62.7k: internal magnet near current price
POC / VAMid ~64.3k-64.4k: first major upside checkpoint
Ditch ~65.1k: low-volume area that can act as a reaction zone
VAH ~66.5k: main bullish rotation target and higher confirmation level
Lower developing profile ~61.9k-60.2k: downside rotation zone if the retest fails
Bullish Scenario
The bullish scenario starts with BTC holding the falling wedge retest.
If price stays above the retest zone and continues accepting above the lower value area, the next logical target is the POC / VAMid around 64.3k-64.4k .
That is the first important test for buyers.
A clean reclaim and acceptance above POC would suggest that BTC is moving from a weak lower-value position back toward the upper part of the auction.
From there, the next checkpoint is the Ditch around 65.1k , followed by the main rotation target at VAH around 66.5k .
Acceptance above VAH would be the stronger confirmation that BTC is no longer only rotating inside value, but attempting upside expansion.
Bearish Scenario
The bearish scenario starts if BTC fails this retest.
If price loses the wedge trendline again and accepts back below the VAL area, the breakout loses strength.
In that case, the first downside magnet is the lower developing value area around 61.9k-61.3k .
If sellers keep control there, the next logical magnet becomes dPOC around 60.2k .
That would mean the market rejected the bullish retest and moved back into value-seeking behavior lower.
Momentum Context
Q adds important confluence to the bullish scenario.
The recent pullback created a hidden bullish divergence on Q, which is typically a trend-continuation signal rather than a simple reversal signal.
That supports the idea that BTC may be trying to continue the upside move after retesting the falling wedge breakout.
This does not remove the need for confirmation, but it makes the bullish case stronger as long as price holds the retest zone and reclaims the POC / VAMid area.
For me, the key confirmation remains price acceptance above POC / VAMid around 64.3k-64.4k , ideally with Q continuing to stabilize and turn higher.
Educational Note
A falling wedge breakout is not confirmed only by crossing the trendline.
The quality of the retest matters more.
If former resistance becomes support and price starts accepting back above value levels, the setup gains strength.
If price falls back below the breakout zone, the pattern becomes a failed breakout and the market usually rotates toward the next liquidity or volume magnet.
The hidden bullish divergence on Q is useful here because it supports continuation, but price still needs to confirm the idea through acceptance above key volume levels.
Final View
BTC is choosing the bullish path for now, and Q hidden bullish divergence adds trend-continuation confluence.
Hold wedge retest -> reclaim POC / VAMid -> rotate toward Ditch -> VAH.
Lose wedge retest -> lose VAL -> rotate lower toward developing value and dPOC.
No prediction. Just a conditional map around the falling wedge retest, Q momentum context, and the volume profile levels.  Long
Long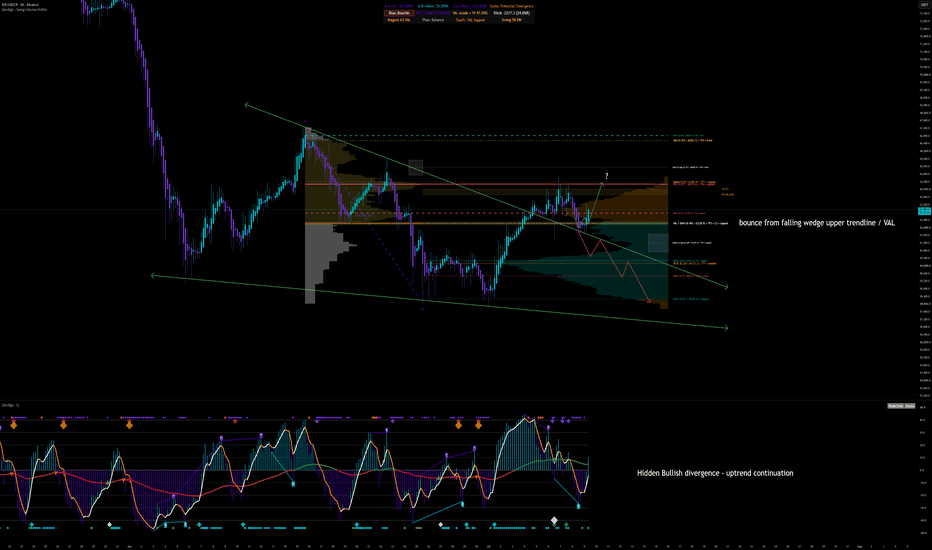
 Long
Long
 Long
Long
Back to the Value.BTC 4H: Back Inside Value, But Still Fighting Falling Wedge Resistance
BTC has managed to reclaim the value area after tapping the VAL zone around 62.2k.
That is constructive, but not enough by itself.
Price is now testing an important confluence:
Back inside VA
VAL reclaimed around 62.2k
Falling wedge resistance directly above price
Current price near the 62.4k area
This makes the next few 4H closes important.
The market is no longer in a simple breakdown structure, but it has not confirmed a clean breakout yet.
Scenario 1: Bullish Acceptance Back Inside Value
The bullish scenario requires BTC to hold above the VAL and start closing above the falling wedge resistance.
If buyers can confirm acceptance back inside the value area, the next upside magnet is the higher-volume zone around 64.2k-64.5k.
That area lines up with previous value/POC resistance and is likely the first important reaction zone.
If BTC accepts above that region, the next upside targets are around 65.1k and then the upper value area near 66.5k.
In simple terms:
Hold above 62.2k VAL
Break and close above falling wedge resistance
Target 64.2k-64.5k first
Above that, watch 65.1k and 66.5k
This would suggest that the move back into value is not just a short squeeze, but a real acceptance move.
Scenario 2: Rejection From Wedge Resistance
The bearish scenario is a rejection from the falling wedge resistance followed by a loss of the VAL.
If BTC fails to close above the wedge and starts closing back below 62.2k, the reclaim loses strength.
That would turn the move back into value into a failed acceptance.
In that case, price can rotate back toward the lower liquidity and volume zones.
The main downside areas I would watch are:
60.7k
60.0k
59.4k
58.6k
A clean loss of VAL would put sellers back in control and increase the probability of another sweep toward the lower part of the structure.
Key Level
For me, the key zone is 62.2k-62.5k.
As long as BTC holds above this area and keeps building acceptance inside VA, the bullish scenario remains alive.
If price loses this zone and rejects the wedge, the setup shifts back toward a bearish rotation.
Final Thought
BTC is at a decision point.
Reclaiming value is positive.
But the falling wedge resistance still needs to be broken.
The next move depends on whether BTC confirms acceptance above this resistance, or fails and rotates back below VAL.
This is not a prediction.
It is a trigger-based plan. Long 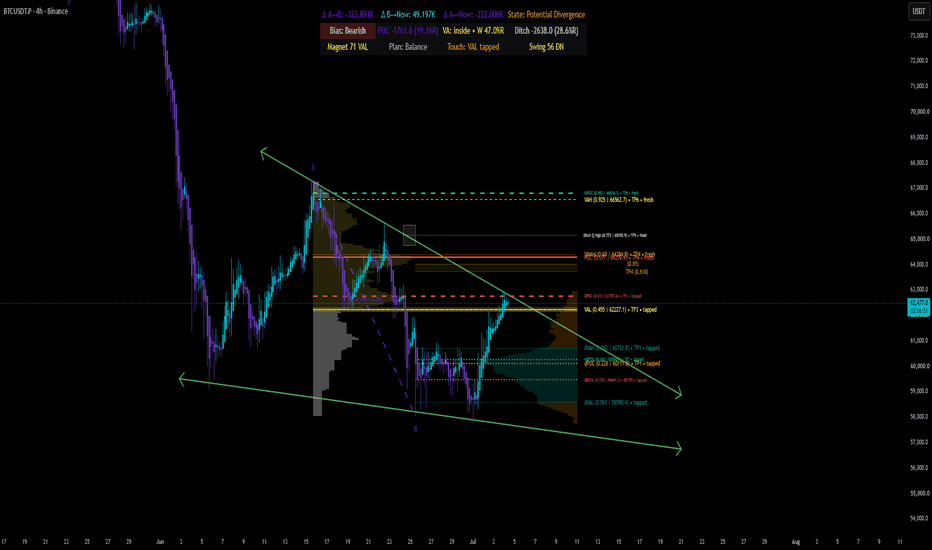
 Long
Long
Short 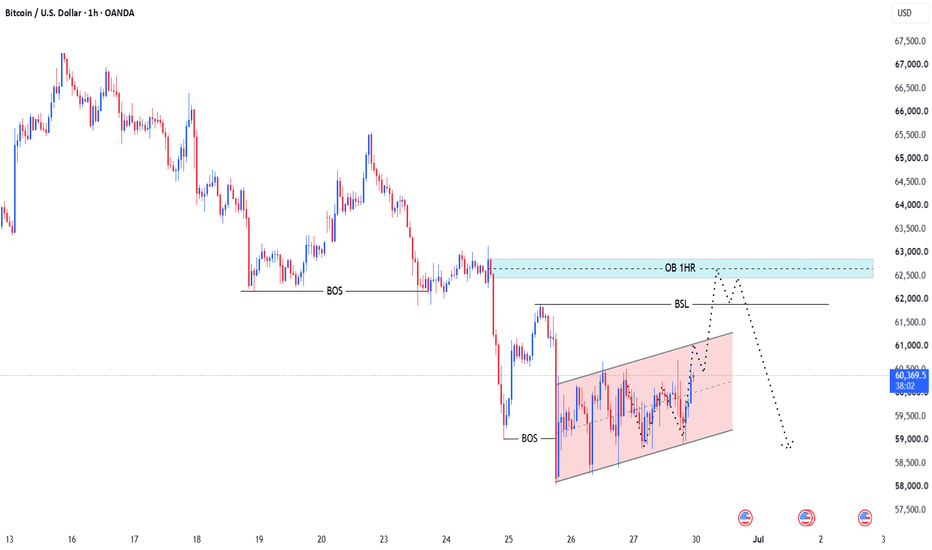
 Long
Long
Long 
 Long
Long
 Long
Long
 Long
Long
 Long
Long
DPRO: When Canadian drones storm the Pentagon and EuropeDraganfly builds unmanned systems for militaries, border forces and first responders. Its platforms are involved in programs of the US, Canadian and Swedish armies, and the May contract with DEVCOM for a counter‑drone system locks the company into a priority defense direction. The company trades on Nasdaq, and everyone who understands that the global shift to mass‑produced reconnaissance drones gives a small manufacturer a chance to grow into a global military supplier is watching.
Fundamentals
The first quarter of 2026 brought record revenue of 2.31 million dollars, a 49 percent increase. Gross margin came in at 15 percent due to an unfavorable sales mix and one‑time inventory write‑offs. The net loss widened to 5.63 million dollars, with a loss per share of 0.18 dollars. The balance sheet holds 147 million dollars in cash after a February offering at 7 dollars per share.
Key events: on May 20, Draganfly and F4 Defense were selected by the DEVCOM Army Research Laboratory to develop a modular counter‑unmanned aircraft system. In March, the company and Palladyne AI completed the integration of SwarmOS, validating autonomous swarm capabilities. In Sweden, drones have been deployed for search‑and‑rescue operations using Smith Myers ARTEMIS mobile phone detection and geolocation. The company supplies Flex FPV drones for US Air Force Special Operations Command training and became the exclusive integrator and distributor of the Blitz EO/IR payload for the Americas.
Risks
The operating gap between revenue and loss requires either rapid scaling or further equity raises. Insiders have been selling shares with no purchases. Dilution remains a real threat.
Technicals
On the three‑day chart, price broke out of a descending wedge and completed a retest, forming the buy zone at the confluence of the 0.786 Fibonacci level, the fair value gap, and the 100‑day moving average. Yesterday‘s close was 5.98 dollars. Volume is many times above multi‑month averages. ADX and MACD give a buy signal, and the 100‑day and 200‑day moving averages have formed a golden cross.
First target is 10.62 dollars, second target is 14.40 dollars.
The market values Draganfly as a speculative bet on military rearmament and the shift to mass‑produced drones. Losses and dilution remain risks, but the growing defense portfolio and technical breakout create an asymmetric setup.  Long
Long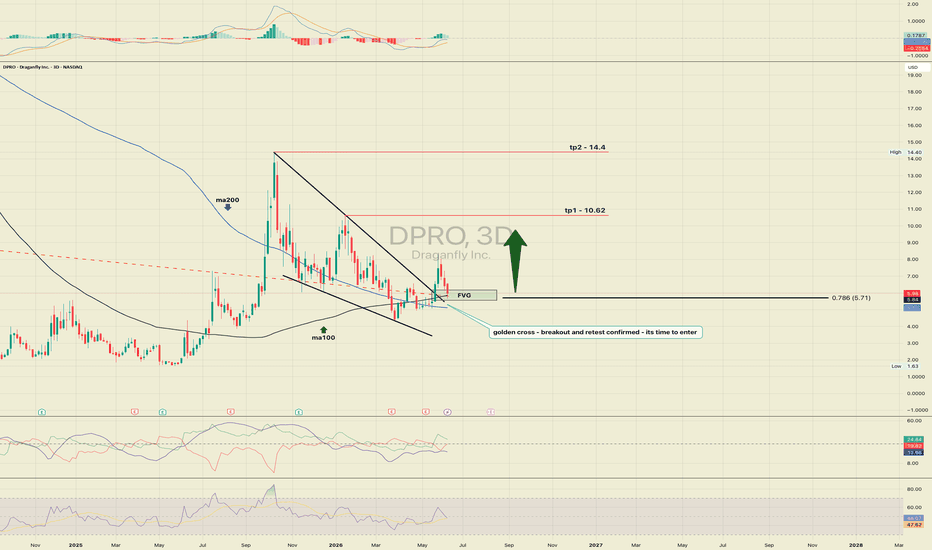
 Long
Long
 Long
Long
 Long
Long


 Long
Long