GOLD - The Hunt for Liquidity (Correction) Before the Drop ICMARKETS:XAUUSD is recovering after Thursday's sharp decline, trading around $4,060 on Friday. This rebound may represent nothing more than a liquidity-building move before the broader downtrend resumes
The U.S. dollar continues to strengthen, while gold remains under selling pressure, reinforcing the prevailing bearish market structure. The broader trend remains firmly bearish.
From a technical perspective, gold continues to face pressure from geopolitical uncertainty and hawkish Federal
Fibonacci Retracement
Gold Outlook: FOMC to Trigger a $3,970 Flush?
1. Fundamental & Sentiment Macro Outlook
As we step into the final trading week of July, the Gold market (XAUUSD) is bracing for immense volatility driven by a stacked macroeconomic calendar. Heading into the crucial Federal Reserve Interest Rate Decision (FOMC) on Wednesday, alongside US Q2 GDP and PCE Inflation metrics on Thursday, institutional market participants are maintaining a defensive posture.
Macro liquidity is currently favoring a structured re-pricing. Ahead of major central bank
50% Fibonacci Retracement Holding as Macro Uptrend SupportGBPUSD 1D โ 50% Fibonacci Retracement Holding as Macro Uptrend Support
Cable rallied over 1,150 pips from the 1.2705 swing low to the 1.3870 swing high, and the current retracement is now pressing into the 50% Fibonacci level at 1.3287. This is a decision zone โ and so far, buyers are defending it.
๐ Key Fibonacci Levels:
โ 0.618 Fib (1.3425): Immediate resistance, rejected price multiple times since May
โ 0.5 Fib (1.3287): Current support zone, price holding above on daily closes
โ 0.382 Fib
NZDJPY - Long squeeze before a rally. Bullish trendFX:NZDJPY is consolidating following a distribution phase, while the broader trend remains bullish. The continued weakness of the Japanese yen is providing medium-term support for the pair
The Japanese yen remains under pressure, which continues to favor the New Zealand dollar. From a technical perspective, NZDJPY is maintaining its bullish structure while consolidating within the 94.59โ95.35 range. A false breakout below support could shift the short-term imbalance back in favor of buyers
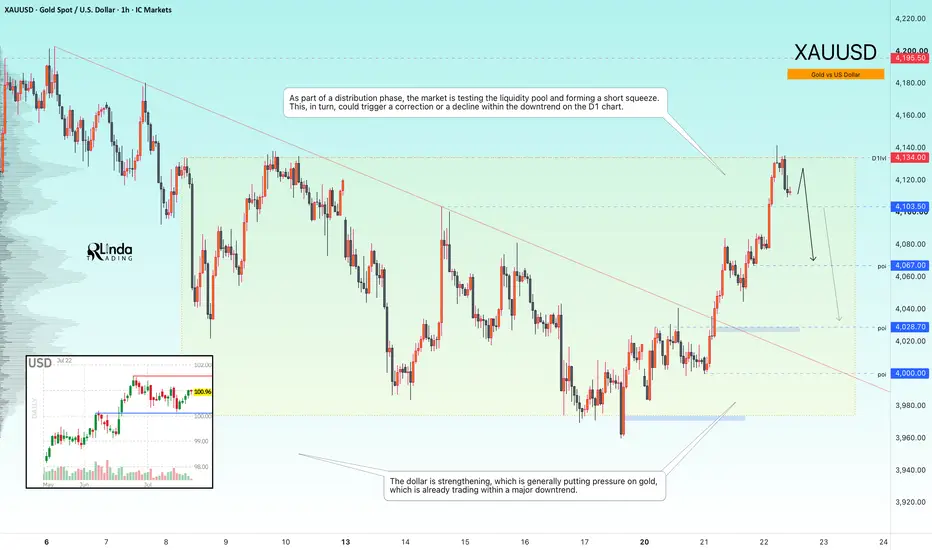
GOLD - A false breakout of resistance within a bearish trendICMARKETS:XAUUSD has broken out of its short-term descending channel within the current distribution phase and is now testing the 4134 liquidity zone while printing fresh intermediate highs. Despite the technical recovery, the broader fundamental backdrop remains weak
Gold remains caught between geopolitical support and pressure from hawkish Federal Reserve expectations and elevated real yields. Analysts note that a sustainable recovery would likely require lower oil prices, declining bond
XAUUSD: Wave 5 Sell Setup Targets 3,993
Gold is still trading under bearish pressure after breaking below the previous uptrend trendline. From Kellyโs view, the current structure suggests that the market may still be moving inside a bearish Elliott Wave sequence, with wave 5 aiming towards the lower Fibonacci target area.
The key idea is simple: gold may rebound slightly first, but as long as price stays below the sell zone and strong liquidity resistance, the downside structure remains active.
โก Market structure
The chart shows
XAUUSD (H1) | Gold Coils Below $4,080 Resistance Weekly Close Shakeout or Pre-FOMC Bear Trap?
The Gold market (XAUUSD) enters a highly anticipated Friday session under tight technical compression as market participants prepare for the upcoming weekly close. With the crucial US Federal Reserve policy decision looming next week, institutional desks (Smart Money) are actively de-risking and rebalancing positions.
Fundamentally, the intraday order flow is guided by automated trading algorithms capitalizing on pre-FOMC positioning. As broader mac
XAUUSD: Wave (5) Peak at $4,225 Then Big Dip?
1. Fundamental & Sentiment Analysis
The Gold market (XAUUSD) maintains an aggressive intraday expansion during Thursday's trading session, holding structural integrity on the H1 timeframe as Smart Money pushes toward key overhead liquidity pools.
Fundamentally, market participants are positioning ahead of today's U.S. Initial Jobless Claims release and upcoming FOMC rate guidance. Supported by persistent geopolitical safe-haven bids, institutional algorithms are completing a textbook 5-wave El
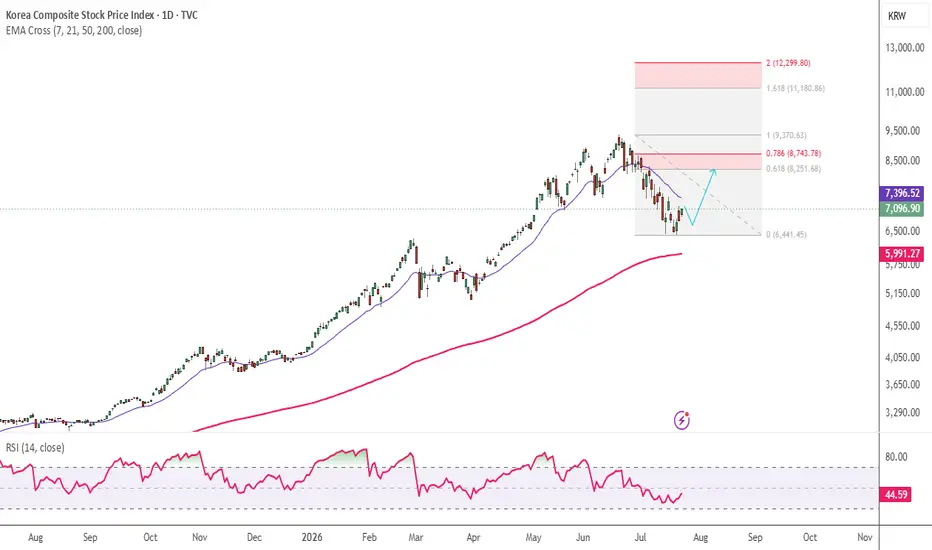
KOSPI : Bull Trap or Continuation Rally ?TVC:KOSPI
๐ Korea's "Talk of the Town" Index at a Critical Inflection Point โ Breakout or Bull Trap? ๐ฐ๐ท
After forming a convincing double bottom near the 6,440 zone, the index has staged a healthy rebound and is now approaching the 20-day EMA, a key dynamic resistance level that could determine the next major trend.
The coming weeks may define whether this recovery evolves into a sustained uptrendโor proves to be another relief rally.
๐ Technical Outlook
The recent double-bottom formation
Emaar : Further Downside ?DFM:EMAAR
๐ Weekly Chart Signals Further Downside โ Is 6.5 the Next Key Level? ๐
The weekly price structure is currently showing continued downside momentum, with price potentially moving toward the 6.5 support zone.
However, this is where patience becomes important. ๐
The major Fibonacci retracement levels remain relatively distant on both the upside and downside, meaning the market is currently positioned in a technically uncertain zone without a clear high-conviction entry.
๐ What I'm
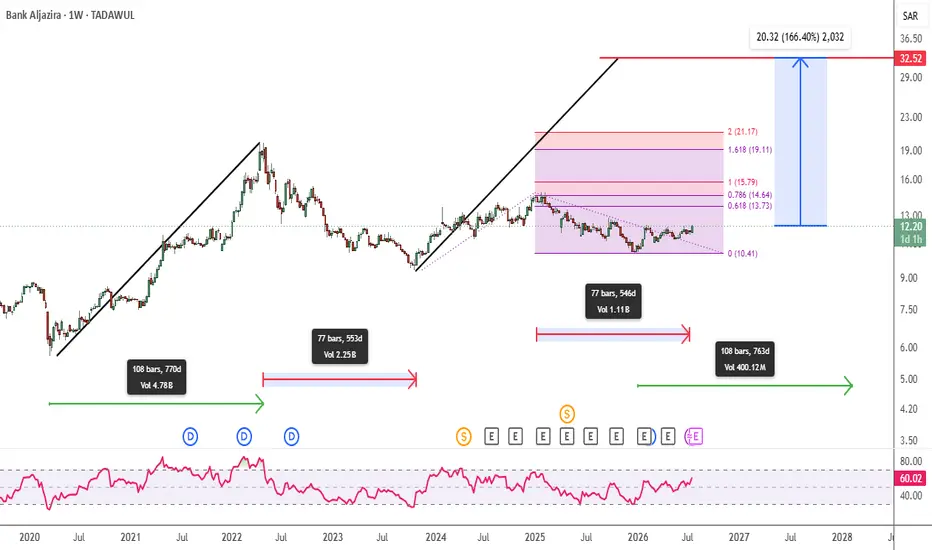
Bank Al Jazira : BUILDING SOMETHING MUCH BIGGER !!TADAWUL:1020
The weekly market structure remains exceptionally strongโand the immediate upside levels are clearly defined:
๐ฏ 14.60
๐ฏ 15.50
๐ฏ 19.11
But zoom outโฆ and the bigger picture becomes even more interesting. ๐
The broader structure appears to be developing into a major AB=CD harmonic pattern.
If the pattern completes as projected, the potential long-term target could reach approximately:
๐ฅ 32
Yesโฆ 32.
Now let's look at the time cycles. โณ
The first major bullish leg developed ov
Sedco Capital Reit Fund : From Deep Discount to Potential 14โ16TADAWUL:4344
๐ From Deep Discount to Potential 14โ16 Target? The Weekly Chart Tells an Interesting Story ๐ฅ
The weekly chart suggests that price may have completed a major accumulation and recovery phase after rebounding from a deep discounted Fibonacci retracement zone of the previous bullish swing from 4.14 to 11.00.
๐ The Price Structure
After the initial bullish move, price retraced within a descending parallel channel, eventually forming a significant swing low near 5.91 in November 20
Americana : Is a Breakout Around the Corner ?TADAWUL:6015
๐ 5-Week Consolidation: Is a Breakout Around the Corner? ๐
After spending nearly five weeks consolidating around the 2.00 level, price continues to hold within a tight range, with the recent swing high forming near 2.09.
This prolonged consolidation is becoming increasingly interesting from a price action and technical analysis perspective.
๐ Key Technical Structure
๐น Trendline support remains intact, suggesting buyers are still defending the underlying structure.
๐น Price
TVSMOTOR: 1H Descending Channel Breakout past 61.8% Fib ๐ TVS Motor Company Limited (TVSMOTOR) - 1-Hour (1H) Chart Analysis
This post is shared for EDUCATIONAL PURPOSES ONLY to analyze short-term parallel channel breakouts, Fibonacci structural confluences, and moving average transitions. It is not financial or investment advice.
๐ฏ Educational Swing Setup:
โข Entry Zone: 3,590.00 โ 3,622.00 (Sizing into position blocks within this breakout environment or accumulating on minor hourly retests of the 3,600 EMA support zone).
โข Target 1: 3,651.50
โข Ta
BITCOIN - A distribution toward 67K before a decline?BINANCE:BTCUSDT.P has transitioned from consolidation into a distribution phase following the breakout above resistance and is now advancing toward a key resistance zone within the broader bearish trend
The fundamental backdrop remains relatively weak for the cryptocurrency market. However, spot Bitcoin ETFs have recorded inflows for five consecutive trading sessions, providing short-term support for the current rally.
From a technical perspective, Bitcoin has broken above the 65,600 resis
ETHUSDT - The Battle for a Key Support Zone BINANCE:ETHUSDT.P is showing local bullish momentum and appears stronger than Bitcoin in the current market environment. Price action is focused on the 1800โ1850 zone, where buyers and sellers are competing for control
Bitcoin remains in consolidation between 61,000 and 65,000, while the broader market trend is still bearish. The lack of both fundamental and technical support continues to weigh on the crypto market as a whole.
From a technical perspective, Ethereum has broken above resista
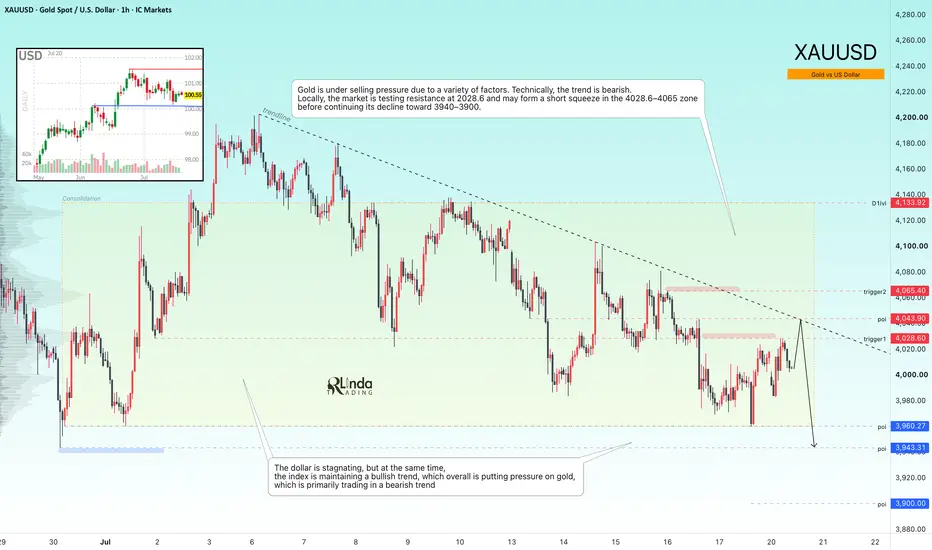
GOLD - A short squeeze before the decline continues toward 3900ICMARKETS:XAUUSD is hovering around the $4,000 mark on Monday, caught between bullish and bearish pressure as markets digest the ongoing escalation of tensions between the U.S. and Iran, while this week's U.S. economic calendar remains relatively light
The U.S. dollar remains in consolidation, although the Dollar Index (DXY) continues to maintain its broader bullish trend. Gold remains under pressure, and the daily technical outlook continues to favor the bears, limiting the potential for
MASON XAUUSD โ Key Support And Resistance Setup
XAUUSD is trading around 4,010 after recovering from the lower support area, but price is still moving below the main descending trendline. The short-term reaction shows buyers are defending the support zone, but the broader structure still needs confirmation before a stronger bullish move can be trusted.
The priority plan is to trade from strong support and resistance zones, with sell pressure still favoured if gold rejects from the upper Fibonacci resistance areas.
Technical View
Gold is c
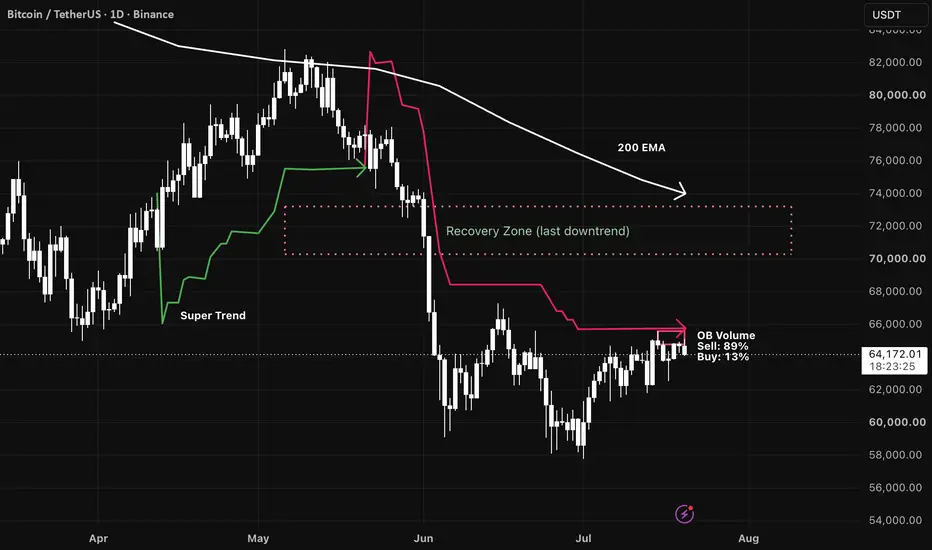
BTC/USDT (1D): Testing Resistance | SuperTrend & 200 EMAIn this daily analysis of Bitcoin (BTC/USDT), we take a look at the current price action relative to key trend indicators and key resistance zones.
Key Technical Factors:
SuperTrend Indicator:
The SuperTrend flipped bearish in late May/early June after the strong drop from the $70k+ levels. The red trailing stop level currently sits around $66,000, acting as immediate dynamic resistance.
Order Book Volume Ratio (OB Volume):
At the current level, sell volume dominance is showing around 89% v
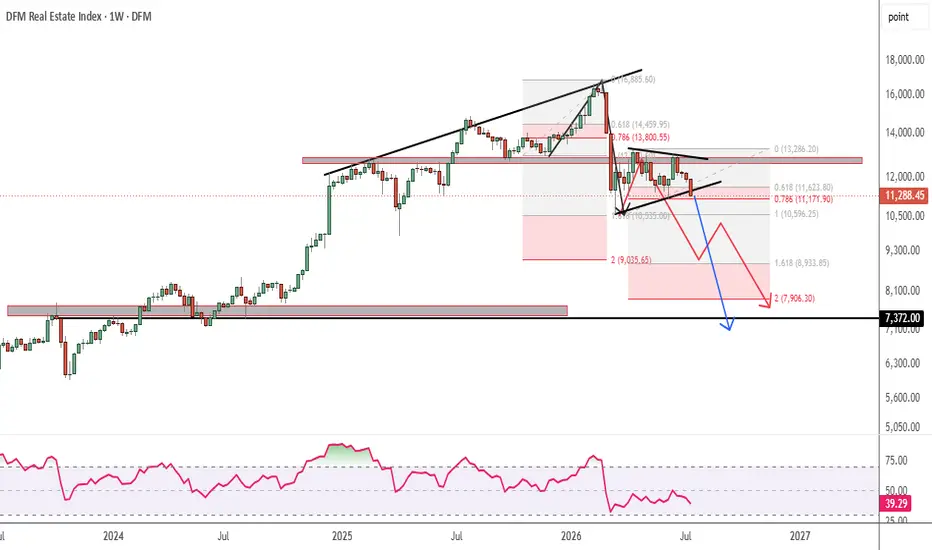
DFMREI : Is Downtrend Over ?DFM:DFMREI (Dubai Financial Markets Real Estate Index)
๐ Is the Downtrend Over? Reverse Fibonacci Suggests Another Leg Lower โ ๏ธ
After rejecting from the 16.8k trendline resistance, the market continues to respect its broader bearish structure.
Here's what the chart is telling us:
๐น The previous impulse moved from a 13k swing low to a 16.8k swing high, which also aligned perfectly with a major descending trendline resistance. Applying a Reverse Fibonacci Extension projected the 10.6k zone as
DShort
BTCUSDT 2022 | Lesson Learnt from Wrong Low IdentifiedBINANCE:BTCUSDT
๐ One Lesson I Wish I Had Understood Earlier
Back in 2022, I began my technical analysis journey under @Trad3WithFaraz. At that time, Harmonic Patterns felt overwhelming, and I struggled to fully understand their significance.
What I failed to appreciate then was a simple yet powerful concept:
Many harmonic reversal patterns complete around the 0.886 Fibonacci retracement level.
(later I learnt that " MANY " and not the " ONLY ")
Looking back at a chart I shared on 26 N
Talabat Weekly Correction for Healthy Upside towards 2.0-2.2 ??DFM:TALABAT ๐ Healthy Correction After Fibonacci Target Completion
The stock has entered a healthy corrective phase after successfully achieving the 0.786 Fibonacci retracement target of the 0.60 โ 1.59 impulsive swing.
Rather than chasing price, it's time to focus on key support levels where the next high-probability setup may emerge.
๐น Current Market Structure
โ
The 0.786 Fibonacci target has been achieved.
๐ Price is now correcting within the broader trend.
๐ข The 1.13โ1.10 zone is current
Jarir at Weekly Breakout; What Next ??TADAWUL:4190
๐ Weekly Breakout Intact | Eyes on 30 July Results
The weekly chart continues to paint a bullish picture after a decisive breakout above the 17.00 resistance level. As long as the price holds above this breakout zone, the primary trend remains in favor of the bulls.
๐น Current Technical Structure
โ
Weekly breakout above 17.00 confirmed.
โ
Long-term trend remains bullish.
๐
30 July 2026 earnings could be the next major price catalyst.
๐น Recent Price Action
Price rallied towa
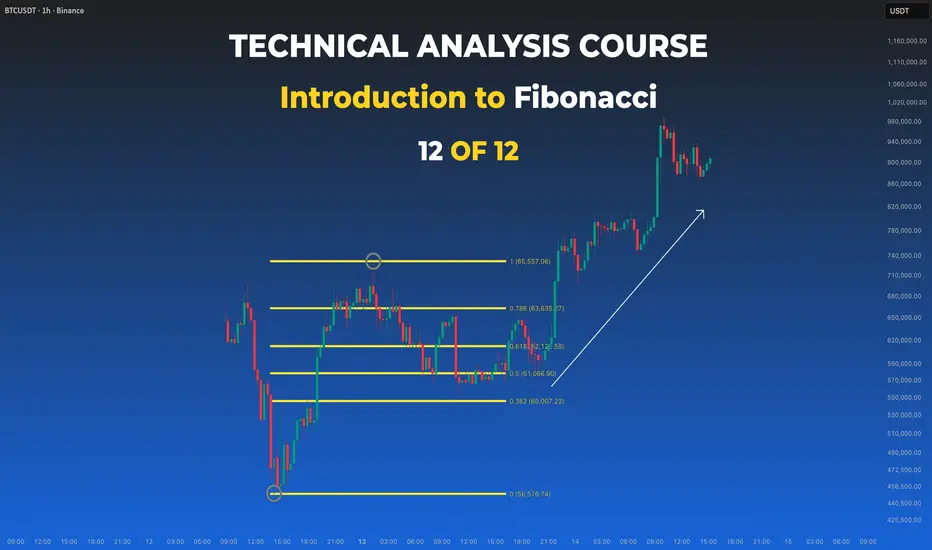
Trading Roadmap | Classical TA ยท Lesson 12 โ Intro to FibonacciLesson 12 - Introduction to Fibonacci
Difficulty: Intermediate
Fibonacci levels do not predict price โ they offer a structured way to map where pullbacks may pause and where trends may reach. In this final lesson of the course, we tie them into the structure, trends, and confirmation tools you've built through the whole roadmap.
๐ต WHERE THE LEVELS COME FROM
The Fibonacci sequence produces a set of ratios โ 23.6%, 38.2%, 61.8%, 78.6% โ that traders project onto price swings. The 50