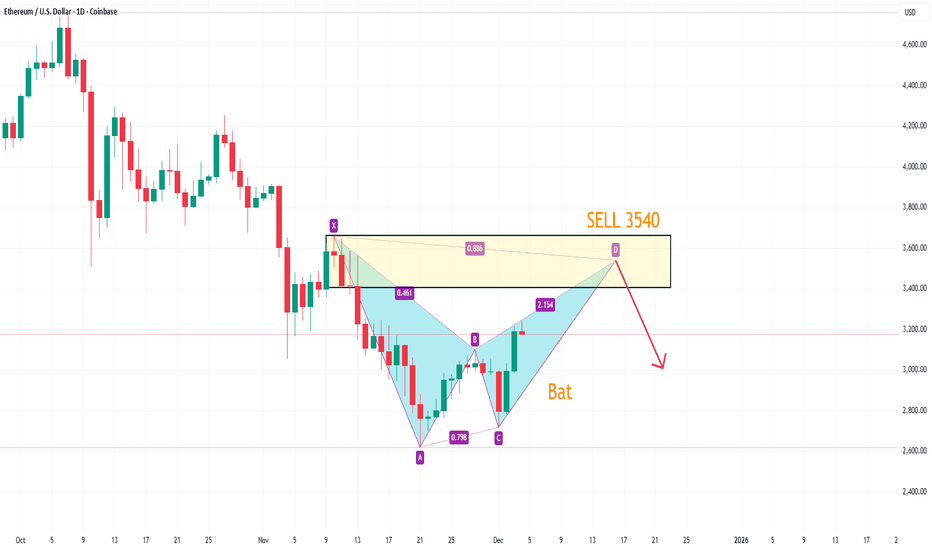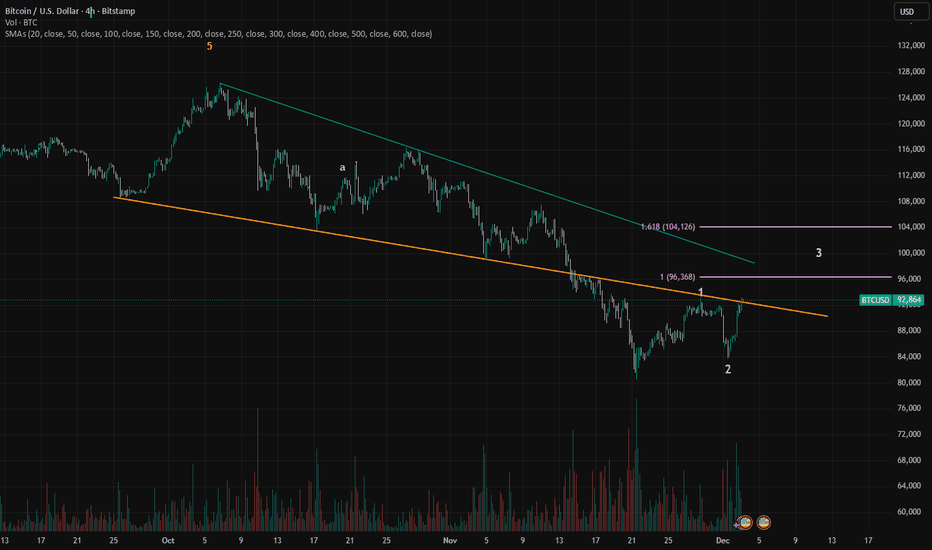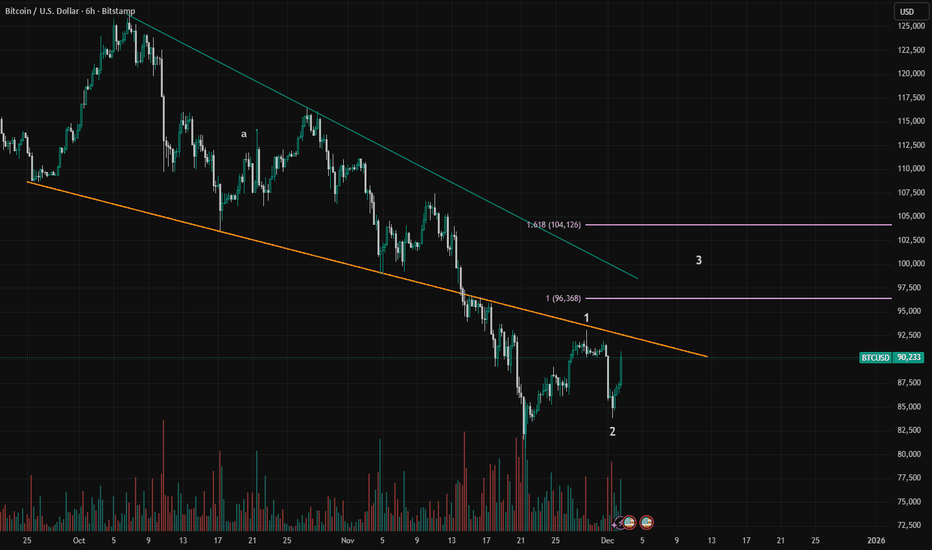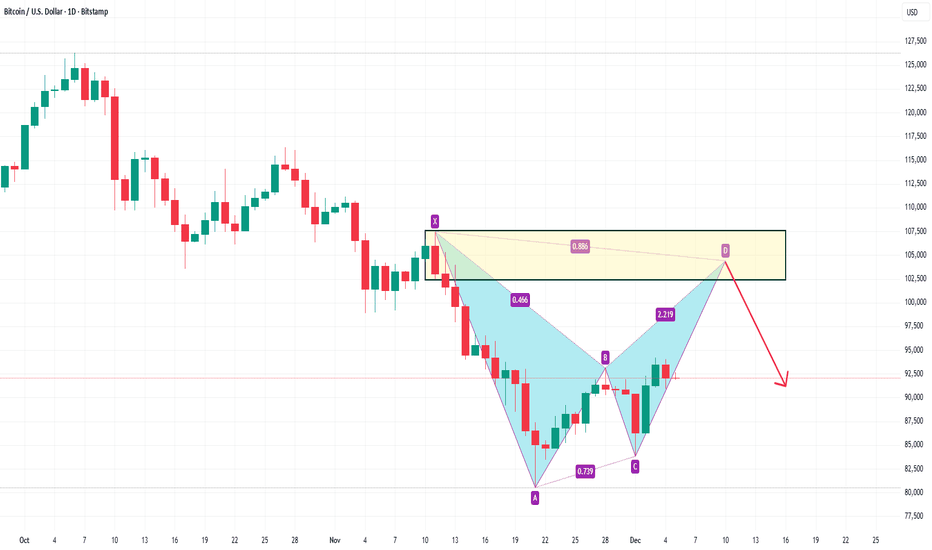
BTCUSD SELL 104400On the daily chart, ETHUSD has stabilized and rebounded, with bulls holding the upper hand in the short term. Currently, attention should be paid to the resistance around 104400, a potential shorting entry point for a bearish bat pattern, which also falls within the previous supply zone.
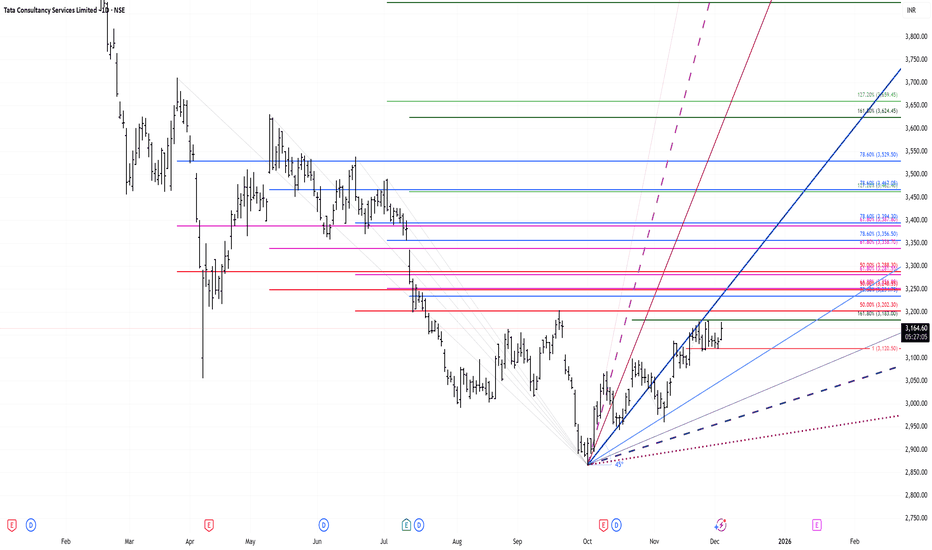
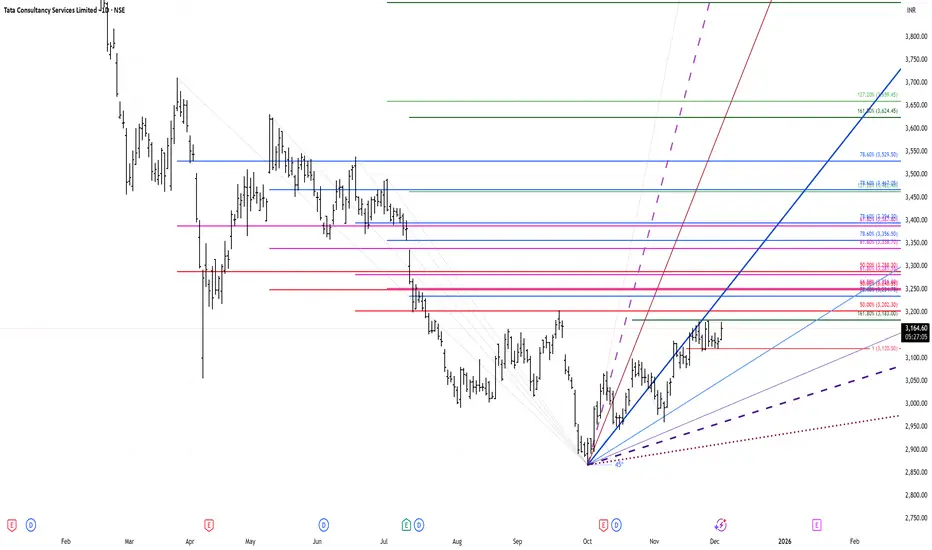
Gann Fan
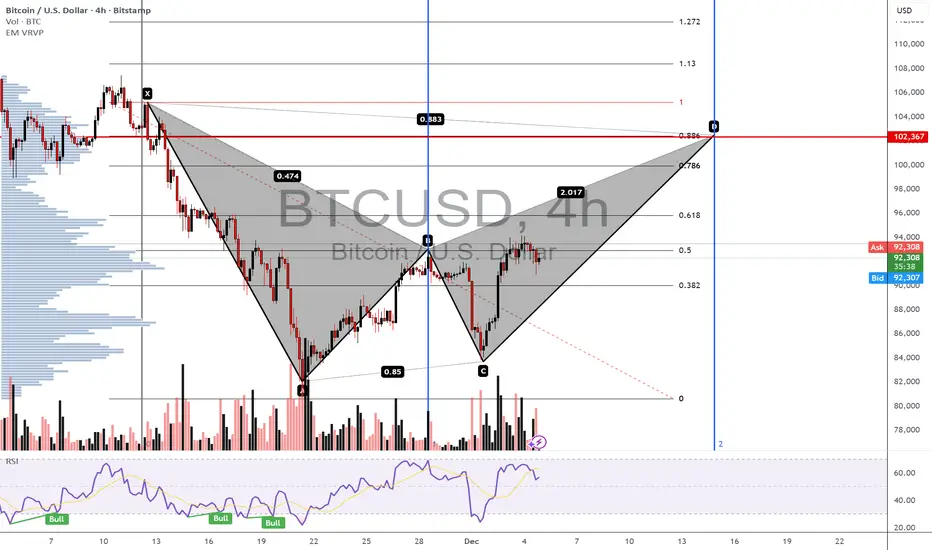
BTCUSD - Potential Bearish BatBTCUSD forming a Bearish Bat pattern completing at 102,367, aligned with major supply, fib confluence, and momentum divergence.
Expectation: Price to reach PRZ, sweep liquidity, and reject lower.
Entry:
Short 101,500–103,000 (aggressive)
or
Wait for bearish confirmation.
Stop Loss:
103,500–104,500 above X and liquidity pool.
Targets:
TP1: 95,000–96,000
TP2: 90,000–91,000
TP3: 82,000–84,000 (runner)
Reasoning:
Harmonic symmetry + fib clustering + low-volume node + RSI divergence all point
ETHUSD Bearish BatETH is completing a Bearish Bat pattern at the 0.886 retracement near 3,476, coinciding with prior supply, bearish RSI divergence, and a low-volume node overhead. The harmonic pattern aligns with structural liquidity and fib extensions that indicate likely exhaustion.
Prediction:
Expect rejection and reversal from the 3,450–3,500 PRZ, with downside targets toward 3,150, 3,000, and potentially 2,800.
Entry:
Short at 3,450–3,500 (aggressive) or after confirmation (conservative).
Pound Setup is still hanging around…The pound is still hanging around at the top of a possible triple zig zag that could target 127-128. While overall I believe the pound is going to move higher , this would give a low risk setup for a long position. I’d like to see all closes below 1.3375. Let’s see if this scenario plays out.
GOLD SHORT SELL VIEW
Hello Traders, here is the full analysis for this pair,
let me know in the comment section below if you have any questions,
the entry will be taken only if all rules of the strategies will be
satisfied. I suggest you keep this pair on your watch list and see if
the rules of your strategy are satisfied.
Dear Traders,
If you like this idea, do not forget to support it with a like and follow.
PLZ! LIKE COMMAND AND SUBSCRIBE
$HIMS: starting a 5-wave sequenceNYSE:HIMS : I'm counting a 5-wave sequence starting from November low of $32.88. I see a clear 5-wave pattern from that low going to Nov. 28 high of $39.xx. Wave 2 started there.
Wave 2 so far has retraced just shy of 61.8% retracement. For a Wave 2, 50%-61.8% retracement are quite common and normal. However, it could retrace 99% of Wave 1.
If $32.88 is taken out, then this count is invalidated and NYSE:HIMS has not completed the major degree level consolidation.
If Wave 2 ended at today
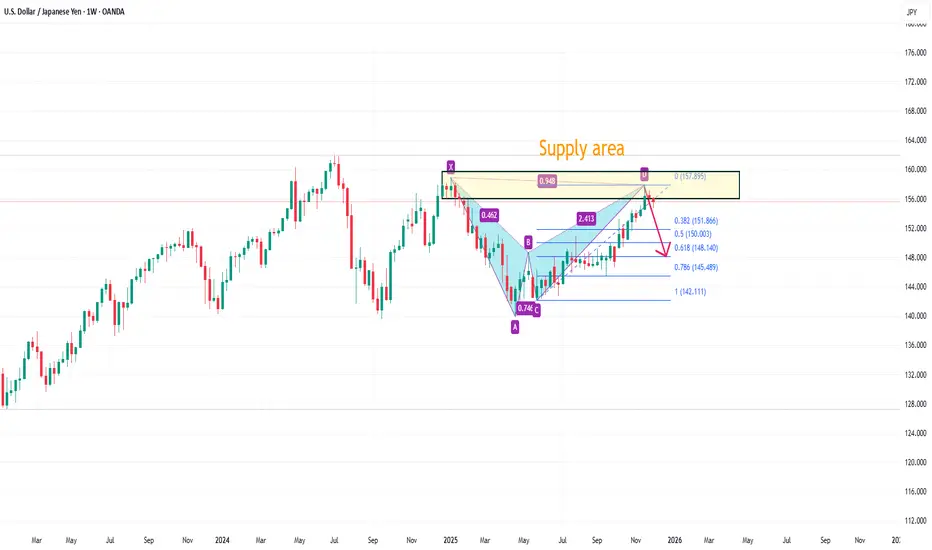
USDJPY TP 148.14On the weekly chart, USD/JPY encountered resistance after testing the previous supply zone, and the current price action has formed a bearish bat pattern. The current downside target is the 0.382 Fibonacci retracement level (151.86), with a second target at the 0.618 Fibonacci retracement level (148.14).
Selling AUD USD after measured move up. RR 2.5 Measured move in lovely swing leg moves in the AUD USD Currency pair. Selling short here with a RR of rouchly 2,5 with a conservative target and a stop above round number and old high. The trading range action around the entry here suggests that a reversal could be likely.
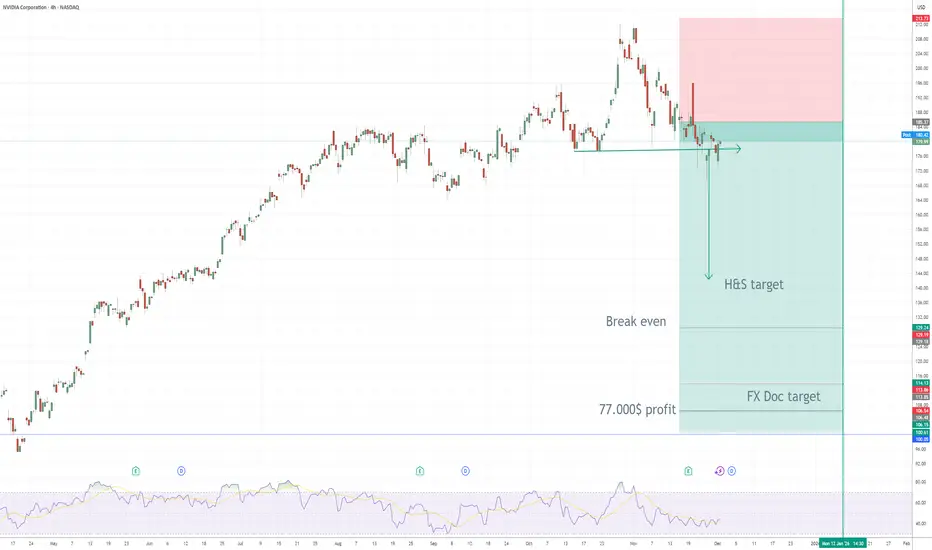
NVIDIA (NVDA) – My PUT Options Position ExplainedI opened a medium-term bearish position on NVDA by purchasing PUT options.
Here’s the full breakdown of the idea, entry logic, and projected targets.
🧠 Why I Entered the Trade
NVDA formed a clear Head & Shoulders (H&S) reversal pattern on the 4H chart — one of the strongest technical reversal signals after an extended bullish trend.
The neckline has now been broken, validating the structure and confirming bearish momentum.
The rejection from the right shoulder, combined with weakening RSI and
BAT – Decision Point Ahead as Structure TightensBAT is approaching a critical decision zone as price moves within a tightening structure. After a strong impulsive leg upward, the market is now forming a potential topping pattern while sitting directly on the trendline support.
The current behaviour shows two possible scenarios depending on how price reacts around this region. The market has respected this ascending support multiple times, making it an important level to watch closely.
Key Observations:
• The recent high has created a pot
BTC 1W Bearish AB=CD harmonic, pt1=74200, pt2=48785BTC is in a bearish AB=CD harmonic pattern, heading to first price target at 74200. Expecting bullish retracement at that level before continuation to pt2 at 50000.
TOTAL crypto market cap is in a similar pattern, with loses projected to be > 2.4T USD.
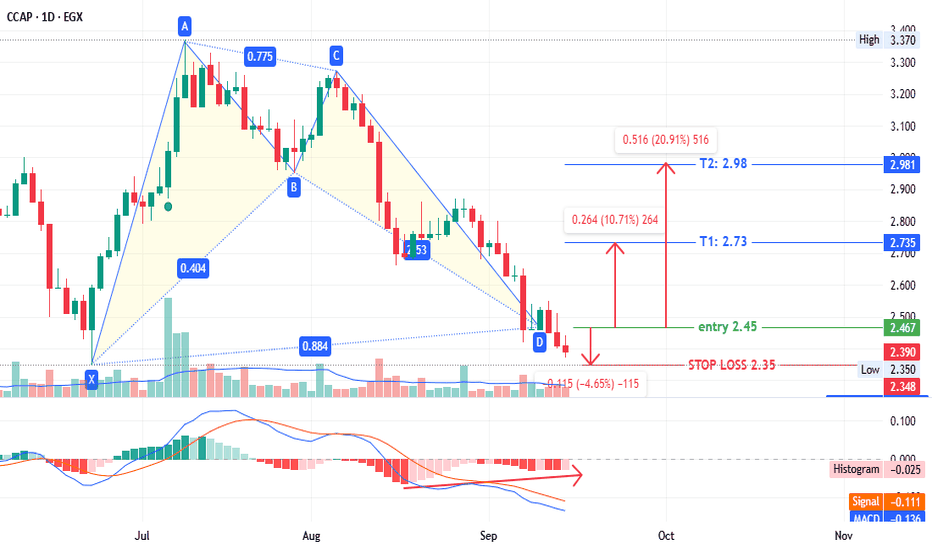
CCAP - good opportunity, normal risk CCAP - EGX30 - Timeframe 1 day
Format a Gartley bullish pattern as follows:
- Entry: 2.45 (current price: 2.39)
- Stop loss: 2.35 (potential loss: 5%)
- First target: 2.73 (potential profit: 10%)
- Second target: 2.98 (potential profit: 20%)
Important notes:
1. Activate the stop loss if it is triggered, as there are lower entry levels for this pattern (down to 1.75).
2. Prices may rebound from this point.
This is not investment advice, only my analysis based on chart data.