Long
Long
 Long
Long
 Long
Long
 Long
Long
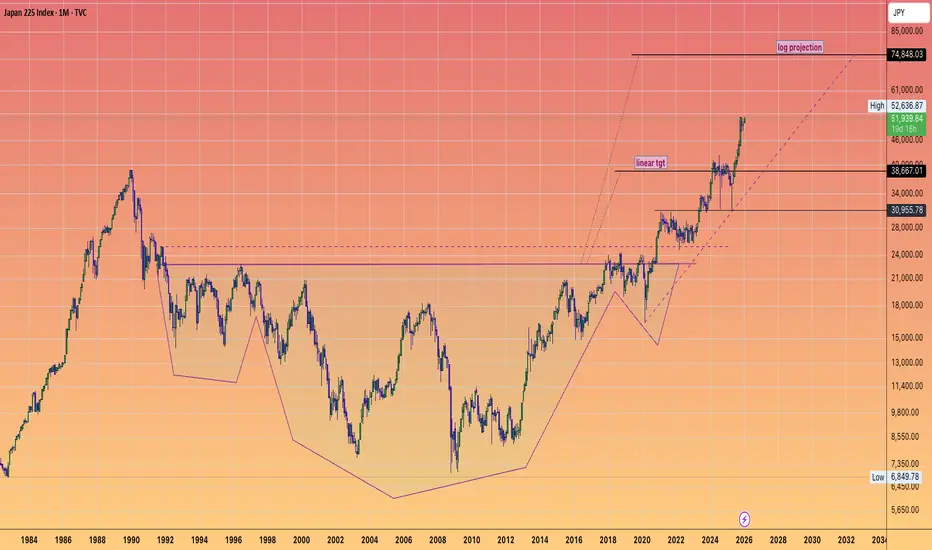
Update: Nikkei 225 Hits 52k. The Log Extension still the Magnet!The Nikkei 225 closed the first full week of 2026 at 51,939.89, marking a significant recovery from its mid-week dip to nearly 51,000. Here is why the structural bull case for your log target remains robust:
The "Takaichi" Tailwinds: The market is currently fueled by "Sanaenomics" (the policies of Prime Minister Sanae Takaichi), which focus on expansionary fiscal measures and a pro-growth stance that favors reflation over aggressive interest rate hikes.
Earnings Dominance: Heavyweights like Fast Retailing (Uniqlo) recently posted record earnings (revenue of ¥1.03 trillion), proving that Japan's major exporters can deliver massive growth even as the global landscape shifts.
Institutional Accumulation: Unlike previous "hot money" cycles, this rally is seeing sustained inflows from global funds (like BlackRock and Citigroup) who are pivoting away from expensive US tech toward the "relative affordability" of Japanese equities.
The AI Infrastructure Play: Japan's industrial ecosystem—specifically semiconductor equipment makers like Tokyo Electron and Advantest—provides the physical infrastructure (machinery and materials) required for the global AI boom, creating a consistent floor for the index.
Technical Verification (January 2026)
The Pivot: The index successfully tested and held the 51,000 handle on January 8th, confirming it as new structural support.
Momentum: The 50-day moving average remains firmly above the 200-day, a "Golden Cross" alignment that typically precedes long-term logarithmic extensions.  Long
Long
GTLB: Whales Buying the AI Fear — Textbook Neckline Backtest🦊 💻🦊 💻 📈 🚀 📈 🚀
When the broader market panics over sweeping, generalised macro narratives, the smart money quietly separates the structural winners from the noise.Software names got absolutely hammered in June on widespread "AI disruption" fears.
Morgan Stanley recently characterised this environment as a "peak uncertainty" moment for the entire enterprise software landscape.
But while retail investors threw the baby out with the bathwater, the institutional tape tells a completely different story: 155 existing institutional positions were increased, and 55 brand-new whale positions were opened.
They didn't run away; they aggressively bought the fear.
The structural rotation out of pure speculative hardware and back into high-quality, cash-generating software platforms is officially underway—and GitLab (NASDAQ: GTLB) is sitting right at the front of the line.
📊 Part I: Fundamental Fuel & The $1B ARR MilestoneGitLab isn't an AI casualty; it is a primary AI beneficiary.
Its native DevSecOps platform is scaling rapidly as enterprise software groups scramble to deploy agentic coding workflows.
The numbers from the recent Q1 FY2027 print prove the business is firing on all cylinders:
The Billion-Dollar Threshold: GitLab officially crossed $1 billion in ARR while generating a robust $220 million in free cash flow for FY2026.
Corporate Confidence: Management didn't hesitate to authorise a massive $400 million share repurchase program.
This isn't a defensive posture—this is a structurally sound company aggressively buying its own dip because it knows the market is mis-pricing its equity.
Q1 FY2027 Earnings Blowout: Revenue hit $264.2 million (a stellar 23% YoY growth clip), easily beating consensus estimates.
Non-GAAP EPS landed at $0.23, serving up a clear 12.3% beat on the bottom line.
Guidance Lifted: Full-year revenue guidance was confidently lifted to a $1.12 billion baseline, completely contradicting the sector-wide slowdown narrative.
📐 Part II: Technical Architecture — High Volume Breakout, Low Volume Pullback
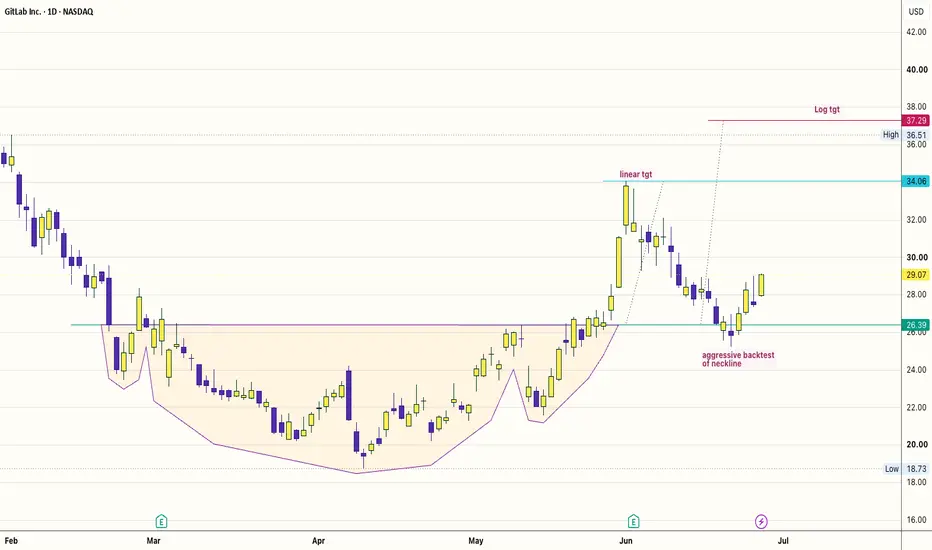
The chart setup captured in is absolutely textbook market structure.
We are witnessing a classic structural accumulation pattern that has just completed its introductory expansion phase.
➔ ➔ ➔
The Base & Neckline Break:
After grinding out a wide rounding accumulation floor from February through May, GTLB executed a massive, high-volume breakout candle in early June, violently slicing through structural resistance at $26.39.
The Controlled Cleanse: The subsequent decline wasn't a liquidation event—it was a highly controlled, incredibly low-volume pullback.
The Aggressive Neckline Backtest: As highlighted explicitly on the chart, price successfully completed an aggressive backtest of the neckline at the $26.39 level and immediately found strong institutional bids.
Volume is beginning to return right on cue, confirming that the weak hands have been thoroughly shaken out.
⚡ Part III: Execution Coordinates & Trade Parameters
The risk-to-reward ratio on this swing configuration is incredibly clean.
We wait for the confirmation trigger to unlock the sequence toward our primary targets.
🟢 Trigger Level> $29.5 above recent minor consolidation highs activates the trade.
🔴 Hard Stop< $29.00 A clean break back below the immediate pivot invalidates the localised bullish momentum.
🎯 Target 1 (Linear)$32.00 Initial liquidity pocket.
Take profit on the first 1/3 of the position to secure a risk-free trade.
🎯 Target 2 (Linear)$34.06 Major psychological resistance line mapped on. Trim harder here.
🚀 Target 3 (Log Tgt) $37.29. Exit the remaining core runner for a maximum risk-to-reward payday.
#GTLB #GitLab #DevSecOps #TechnicalAnalysis #PriceAction #SectorRotation #EarningsBeat #ChartPatterns #RoundingBottom #WhaleActivity #SoftwareRotation #TradingView #SwingTrade #BuyTheDip #MarketStructure  Long
Long
Pidilite Industries – Weekly Inverse Head & Shoulders Setup🎯 Pidilite Industries – Weekly Inverse Head & Shoulders Setup
📊 CMP: ₹1,518
🛑 Stop Loss: ₹1,427
🎯 Targets: ₹1,572 | ₹1,617 | ₹1,685 | ₹1,766
Technical View
Pidilite Industries is showing a potential Inverse Head & Shoulders formation on the weekly chart, indicating a possible medium-to-long-term trend reversal.
Adding further strength to the setup, the right shoulder is developing within a box consolidation pattern, creating a classic "pattern within a pattern" structure. Such formations often lead to strong directional moves once the breakout occurs.
A sustained breakout and close above ₹1,530 can confirm the bullish setup and may trigger a fresh upside rally toward the mentioned targets.
Key Observations
✅ Weekly Inverse Head & Shoulders under formation
✅ Right Shoulder forming a box consolidation
✅ Pattern within pattern setup
✅ Breakout trigger above ₹1,530
✅ Favorable risk-reward for positional traders
✅ Positive global market environment can support the move
Trading Strategy
Accumulate only on confirmation above ₹1,530.
Maintain a strict stop loss at ₹1,427.
Follow proper position sizing and risk management.
Be patient and allow the pattern to play out over time.
A sustained breakout above the neckline can unlock significant upside potential in the coming weeks.
⚠️ Clarification:
This is an independent analysis based purely on technical and market study. No part of Religare is involved in this view or recommendation.
📝 Important:
I am not responsible for any loss or profit incurred. I am not taking any fees for these views – just sharing my analysis for educational and informational purposes.
📉 Disclaimer: Not SEBI-registered. Please do your own research or consult a financial advisor before taking any investment decision.  Long
Long
Compounder or Trap? Examining $Dixon Technologies’ Growth Runway5 Bullish Insights for ATH's
IT Hardware & Laptop PLI: Dixon isn't just a smartphone assembler anymore.
Their foray into IT hardware and laptops (under the latest PLI schemes) opens up a massive total addressable market (TAM) that is significantly larger than their legacy mobile business. This is a "new leg" of growth the market hasn't fully digested.
Vertical Integration (The "Value Chain" Moat): They are aggressively moving from simple sub-assembly to "Full Box Build" manufacturing.
By doing more of the heavy lifting (PCBA to final assembly), they capture more value per unit, which structurally improves their long-term operating margins.
Non-Linear Client Acquisition: They are moving beyond simple volume assembly for one or two brands.
By locking in marquee global brands (Samsung, Xiaomi, Motorola, etc.) for multiple product categories (TVs, ACs, Washing Machines), they have created a "lock-in" effect where these brands cannot easily switch without massive disruption to their supply chain.
"Make in India" Export Hub: The goal is no longer just domestic consumption.
Dixon is increasingly positioning its facilities as an export base for Southeast Asia, Africa, and the Middle East.
If they successfully turn into a global export powerhouse, the CAGR shifts from a "domestic play" to a "global manufacturing play."
Operating Leverage on Fixed Costs: Most of Dixon's capital expenditure (Capex) has already been deployed.
As revenue scales, their incremental operating costs drop.
This creates a "hockey stick" effect on profitability—where revenue grows at 20-30%, but net profit can potentially grow even faster because the heavy lifting in infrastructure is already done.
The "New High" Reality Check
To sustain new highs, Dixon has to prove that the margin profile is expanding as they add these new, complex products.
If the revenue grows but the margins stay flat, the market will eventually cap the valuation multiple.
Dixon has carved out a textbook Inverse Head & Shoulders on the daily, signaling a transition from the accumulation phase back into trend continuation.
The Setup: The right shoulder has formed with decreasing volume, a classic sign of exhaustion in selling pressure.
The Trigger: A clean breakout above the neckline confirmed by a volume spike.
The Risk Management: The stop-loss is placed strictly below the right shoulder consolidation. If this fails, the pattern is void.
The Target: 14,628. Let the price action get us there, but keep the stop tight.
#DixonTech #EMS #IndiaGrowth #NIFTY #NSEINDIA  Long
Long
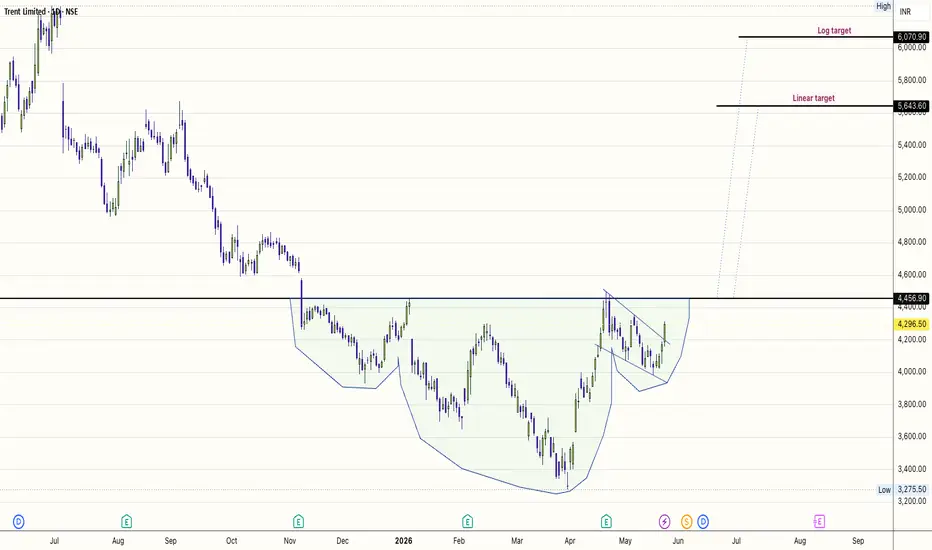
TRENT: The Bear-to-Bull Pivot🏬 🏬 🏬
The TRENT reversal is taking shape, and the structure is textbook. We aren’t guessing; we’re playing the pattern.
The Setup:
The Inverse Head and Shoulders has formed. Entries here represent an incredibly high reward-to-risk ratio.
The Entry: We are playing the consolidation near the neckline/right shoulder.
The Risk Management: The stop is non-negotiable—it sits under the right shoulder. If we break below that, the "bullish reversal" thesis is invalidated, and the pattern has failed.
Respect the stop.
The Target: The depth of the head dictates the potential move. The targets speak for themselves; let the price discovery play out.
5 Reasons Why TRENT is Shifting from Bear to Bull:
Inverse H&S Confirmation: The formation of a higher low at the right shoulder confirms that the selling pressure has been absorbed.
Volume Participation: —Look for a contraction in volume during the formation of the right shoulder, followed by an expansion upon the breakout.
Moving Average Support: The price is consolidating above , shifting the long-term trend bias from distribution to accumulation.
Relative Strength (RS): Compared to the broader index, TRENT has stopped making new relative lows, signalling that institutional buying is stepping in to support the floor.
Momentum Shift: Oscillators (like the RSI) are showing a bullish divergence at the right shoulder, indicating that while the price was grinding lower, the selling momentum was already drying up.
5 Fundamental Pillars: Why TRENT is a Structural Compounder
1.) Zudio’s "Value-Fashion" Moat
Zudio has effectively cracked the code of the Indian mass market by offering trendy, fast-fashion apparel at accessible price points.
Its FOCO (Franchise-Owned, Company-Operated) model allows Trent to scale aggressively without tying up massive capital in real estate, while maintaining tight control over store operations and the customer experience.
2.) Unmatched Operational Efficiency
Trent’s ability to keep margins resilient—even while expanding rapidly—is driven by its bulk manufacturing and private-label-only strategy.
By owning the entire supply chain and avoiding the margin-diluting discount cycles common in retail, they maintain superior inventory turnover and high Return on Capital Employed (ROCE).
3.) Data-Driven Tier-2/Tier-3 Penetration
Trent is no longer just a "big city" retailer. By leveraging AI-backed location analytics and micro-market data, they are strategically targeting smaller towns where consumption is shifting from unorganised to organised retail.
This "deep-farming" of existing regional markets significantly reduces the risk of expansion.
4.) Multi-Format Synergy
The portfolio is perfectly balanced between Westside (mid-premium/lifestyle focus) and Zudio (value-fashion focus).
This allows Trent to capture the entire spectrum of the Indian consumer’s wallet as they move up the income ladder, creating high brand stickiness and lifetime value.
5.) Execution-Led Revenue Momentum
Trent consistently delivers 17–20% year-on-year revenue growth, fuelled by both same-store sales growth (LFL) and a relentless pace of new store additions.
In a market often plagued by consumption uncertainty, Trent’s ability to sustain double-digit top-line growth is a testament to the brand's resilience and structural market demand.
#BreakoutAlert #TechnicalAnalysis #ValueInvesting #IndiaGrowth #StockMarketIndia  Long
Long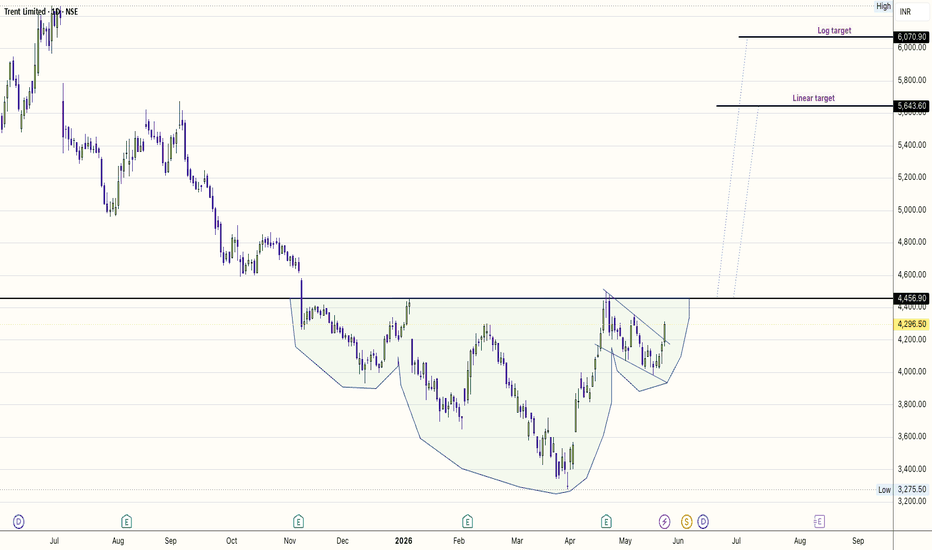
 Long
Long
 Long
Long
 Long
Long