 Long
Rectangle
Long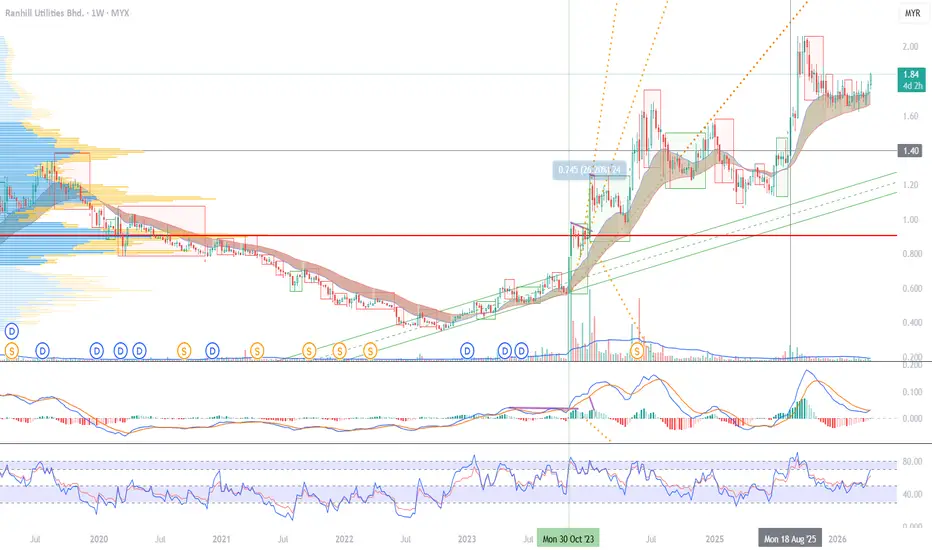
NATGAS - BEARISH MOVE!Hello traders,
Natural Gas has formed a rectangle pattern.
Currently, the support level (2.7808 – 2.7643) has been broken,
which signals a potential bearish continuation.
Based on this breakdown, I expect a bearish move.
🎯 TARGET: 2.7050
 Short

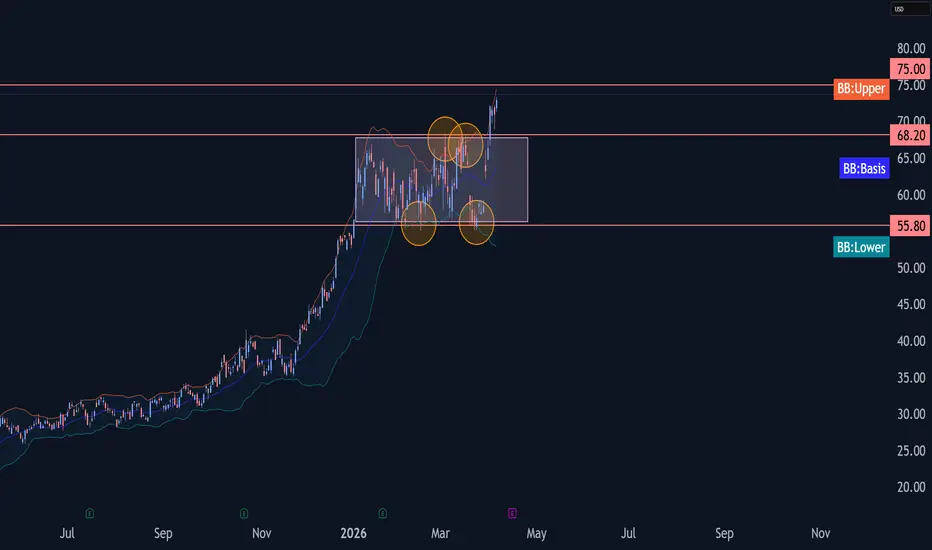
Alcoa Wave Analysis – 7 April 2026 - Alcoa broke resistance level 68.20
- Likely to rise to resistance level 75.00
Alcoa recently broke the resistance level 68.20 (which is the upper border of the sideways price range inside which the price has been moving from January).
The breakout of the resistance level 68.20 accelerated the active short-term impulse wave 3 of the intermediate impulse wave (5) from February.
Given the strong daily uptrend, Alcoa can be expected rise to the next resistance level 75.00 (target price for the
 Long
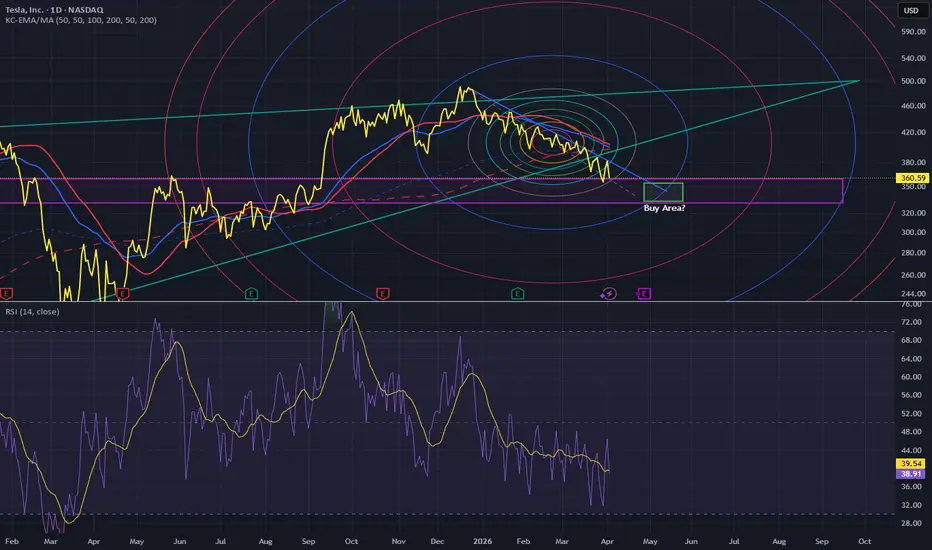
Little more down pleaseLooks like more downside ahead to 336.Then waiting for upgoing confirmation, but price is breaking down from a large triangle. So keep your eyes open!

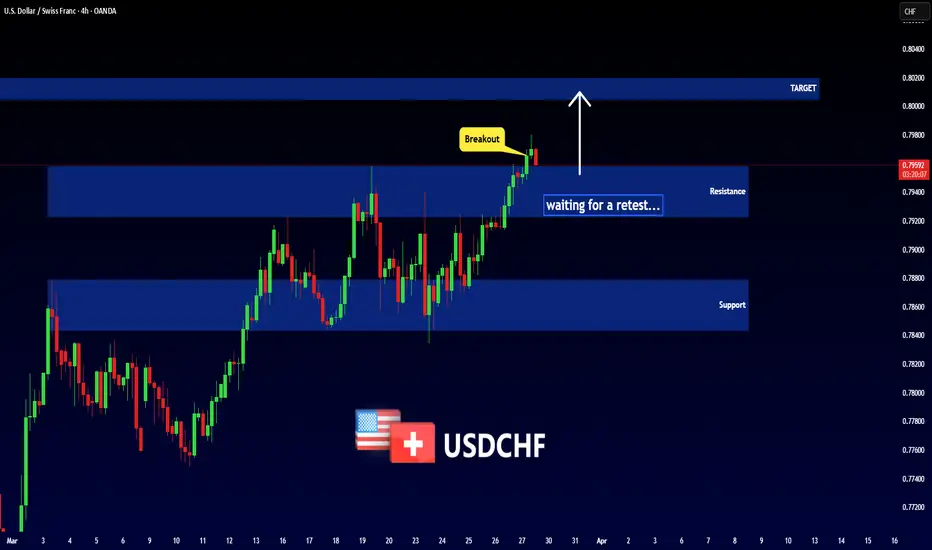
USDCHF - NEW BREAKOUT!Hello traders,
as discussed in the previous analysis, USDCHF has formed a rectangle pattern.
Currently, the resistance level (0.79582 – 0.79230) has been broken,
and this zone may now act as a new support.
Based on this breakout, I expect a bullish move.
🎯 TARGET: 0.80050

 Long
USDCHF - BULLISH SCENARIOHello traders,
the USDCHF price has formed a rectangle pattern.
Let’s look for a bullish scenario:
If the market breaks and closes above the resistance level (0.79582 – 0.79230),
we can expect a bullish move.
🎯 TARGET: 0.80050
Long
AUDUSD - BEARISH SCENARIOHello traders,
the AUDUSD price has formed a rectangle pattern.
Let’s look for a bearish scenario:
If the market breaks and closes below the support level (0.68970 – 0.69481),
we could see a strong bearish move.
🎯 TARGET: 0.67785
 Short

 Long

INDO THAI SECURITIESIndo Thai Securities Ltd. (NSE: INDOTHAI) is a small‑cap financial services company engaged in stock broking, investment advisory, and capital market operations. Incorporated in 1995, it is headquartered in Indore, Madhya Pradesh.
Promoter: Doshi Family (Dhanpal Doshi & Group) – 56.77% holding (Dec 2025)
FY22–FY26 Snapshot
Revenue Growth: CAGR ~12% over FY22–FY26, supported by broking and advisory services. → Good
Net Profit: FY26 PAT ~₹42 Cr, reflecting steady growth. → Good
Operating Marg
 Long

USOIL - BEARISH SCENARIOHello traders,
the USOIL price has formed a rectangle pattern.
Let’s look for a bearish scenario:
If the market breaks and closes below the support level (92.632 – 89.499),
we could see a bearish move.
🎯 TARGET: 80.760
 Short

CRUDE OIL (WTI): Important Decision Ahead
WTI Crude Oil is currently consolidating within a horizontal
parallel channel on a daily time frame.
I do believe that a bullish accumulation is currently taking place
before a strong wave up.
Your confirmation to buy the market will be a bullish breakout and
a daily candle close above the resistance of the range (101.76).
A strong upward movement will be expected then.
❤️Please, support my work with like, thank you!❤️
I am part of Trade Nation's Influencer program and receive a month
Long
EURCHF - BULLISH MOVEHello traders,
EURCHF has formed a rectangle pattern.
Currently, the resistance level (0.90552 – 0.90494) has been broken,
which signals a potential bullish continuation.
Based on this breakout, I expect a bullish move.
🎯 TARGET: 0.91020
Long
Bull Market Trading Plan for OilA triple "W" formation is acting as a key support level, suggesting that oil prices are unlikely to decline in the short term.
The resurgence of the energy crisis is providing substantial underlying support. Currently, the Strait of Hormuz remains only partially open for oil tanker traffic. Furthermore, despite the G7 nations releasing their strategic oil reserves, market prices have not experienced a significant pullback; consequently, oil prices continue to enjoy robust support on the downside
Long
Long Consolidation box.2110 Analysis
Closed at 165.10 (16-03-2026)
Long Consolidation box.
Currently around resistance level (170 - 175).
Crossing this range may lead it towards 200 - 210
initially.
Immediate Support seems to be around 151 - 153
& then around 140 - 141.
However, breaking 125 - 126 may bring more selling
pressure.
Consolidation range bottom is around 56 - 60.


SILVER (XAGUSD): Accumulation Completed?!
Silver violated a resistance of a horizontal accumulation range
on a daily time frame.
There is a high probability that the price will continue rising
at least to 94.0 level.
❤️Please, support my work with like, thank you!❤️
I am part of Trade Nation's Influencer program and receive a monthly fee for using their TradingView charts in my analysis.
 Long

GOLD - BULLISH SCENARIOHello traders,
the gold price has formed a rectangle pattern.
Let’s look for a bullish scenario:
If the market breaks and closes above the resistance level (5206.265 – 5172.800),
we could see a strong bullish move.
🎯 TARGET: 5366.000
 Long

GOLD (XAUUSD): Waiting for Breakout
Gold continues consolidating, coiling within a horizontal range on a daily time frame.
Your reliable signal to buy will be a breakout of its resistance.
A daily candle close above 5207 will provide a strong confirmation.
A bullish continuation will be expected to 5334 level then.
❤️Please, support my work with like, thank you!❤️
I am part of Trade Nation's Influencer program and receive a monthly fee for using their TradingView charts in my analysis.
Long
EURUSD - BEARISH MOVEHello traders,
the EURUSD formed a rectangle pattern.
Currently, the support level (1.17420 – 1.17555) is broken,
so I expect a bearish move from this breakdown.
🎯 TARGET: 1.16360
Short
US 500 Index – Facing a Key Test of Trader SentimentThe US 500 index is facing a major sentiment test. Despite posting a strong rebound from yesterday’s initial 1.5% drop to 6760, to finish the day with a small 0.15% gain at 6875, the index is back down 0.75% again today, trading at 6825 at the time of writing (0630 GMT). The decision for US and Israeli forces to conduct coordinated attacks on selective targets across Iran that started on Saturday and are currently still on-going, operations that resulted in the death of Iran’s Supreme leader Aya


USDJPY - BULLISH MOVEHello traders,
as discussed in the previous analysis , the USDJPY price has formed a rectangle pattern
Currently, this resistance level (153.664 - 154.051) has been broken,
and the zone now acts as new support.
Based on this breakout, I expect a bullish move.
🎯 TARGET: 157.000
 Long

USOIL - BEARISH MOVEHello traders,
the USOIL price has formed a rectangle pattern.
Currently, the support level (65.653 – 65.108) is broken,
so I expect a bearish move from this breakdown.
🎯 TARGET: 62.835
Short
WULF - 3 months RECTANGLE══════════════════════════════
Since 2014, my markets approach is to spot
trading opportunities based solely on the
development of
CLASSICAL CHART PATTERNS
🤝Let’s learn and grow together 🤝
══════════════════════════════
Hello Traders ✌
After a careful consideration I came to the conclusion that:
- it is crucial to be quick in alerting you with all the opportunities I spot and often I don't post a good pattern because I don't have the opportunity to write down a proper didactical comment;
- sin


1729 - 5 months RECTANGLE══════════════════════════════
Since 2014, my markets approach is to spot
trading opportunities based solely on the
development of
CLASSICAL CHART PATTERNS
🤝Let’s learn and grow together 🤝
══════════════════════════════
Hello Traders ✌
After a careful consideration I came to the conclusion that:
- it is crucial to be quick in alerting you with all the opportunities I spot and often I don't post a good pattern because I don't have the opportunity to write down a proper didactical comment;
- sin
 Long

J&K Bank: Value Meets BreakoutJammu & Kashmir Bank Ltd is a scheduled commercial bank established in 1938 and headquartered in Srinagar, India. It provides retail, corporate, treasury and other banking services across the country and acts as an agent bank for the Union Territories of Jammu & Kashmir and Ladakh.
Valuation
P/E: ~5–6 (Sector avg ~12–18) → Undervalued
P/B: ~0.7–0.8 → Trading below book value
Dividend Yield: ~2%
Market Cap: Mid-cap PSU bank
Profitability
ROE: ~15%
Stable Net Interest Margin (NIM)
Consistent pro

