Seasonality
NASDAQ (CASH100) is Approaching KEY ResistanceSince 15 May, the Cash100 has been trading within an upward channel.
It’s now approaching diagonal resistance — will it hold, or break higher?
On the chart, I have marked every time NAS has tested the diagonal resistance and failed to break through.
I’ll be watching this area closely for shorts.
What do you think: will NAS continue climbing, or is a reversal coming?
Bitcoin’s Triple Bullish Pole Sequence Next Stop $184K+? Bitcoin’s long-term bull run is unstoppable, powered by a sequence of bullish flag and pole formations. The first pole delivered $63K. The second is still in play, aiming at $198K. The third, born after a breakout above its own flag and the all time high, now eyes $184K with price cruising above $121K.
Since late 2023, a rock solid ascending trendline has been the market’s backbone, holding as dynamic support through every pullback. The immediate demand zone is your prime reload spot if price d
Bitcoin Approaches Cycle Top with AB=CD Completion in SightBTCUSDT continues its bullish macro structure, now advancing towards the projected cycle top zone at $160,524, completing a textbook AB=CD harmonic formation. The BC leg retraced precisely 0.584 of AB, aligning with a 2.423 CD extension, confirming a strong harmonic symmetry.
Price is currently trading around $116,569 after breaking through key resistance levels, with the Immediate Demand Zone resting at $110,198. This zone will act as the first major defense level if a short-term correction oc
NSIT Insight Enterprises Forecast until early 2026Pretty bad year for NSIT but I see a chance for a rebound coming from early October 2025 with a participation in the x-mas / end of year ralley.
my forecast is shown as arrows in the chart. please feel free to contact me for some
seasonality chat and to get further ideas on that or maybe discuss.
leave a comment. what do you think?
How to Read COT Data: Understanding Big Players’ Order FlowHey whats up traders, today Im going to reveal my COT approach. If you’re serious about finding higher timeframe bias based on what the big players are doing, then COT data is a tool you need to know. It offers unique insights into the positioning of institutional traders—and if read correctly, it can help you align with real market momentum rather than noise.
Before we break it down step-by- step. I want to mention that this is my personal approach. Larry Williams is doing it differently and I
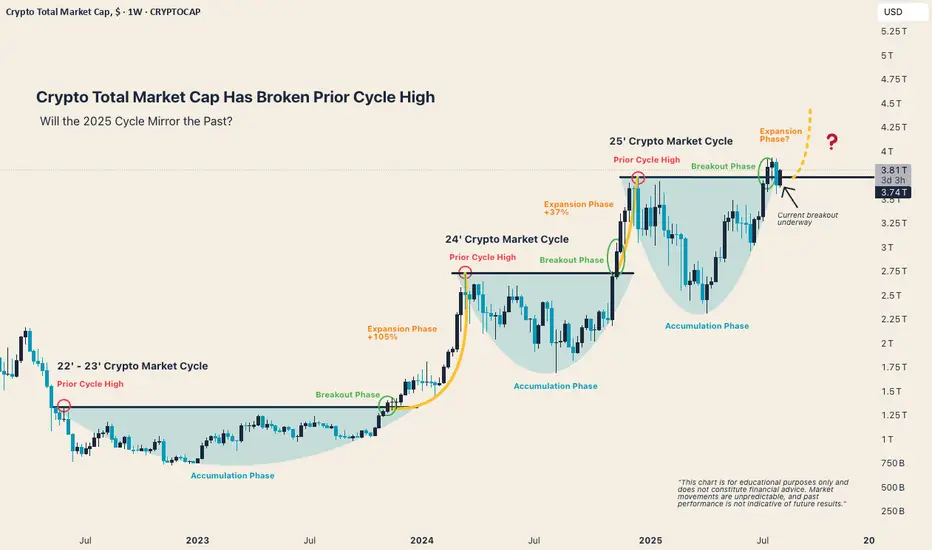
Crypto Total Market Cap Has Broken Its Prior Cycle HighEach of the past two crypto market cycles saw a clean breakout above prior highs, followed by significant expansion phases:
2023: ~105% rally post-breakout
2024: ~37% rally post-breakout
2025: Now underway?
We’ve entered the breakout phase again. If history is any indicator, this is the moment where things often accelerate.
While we don’t trade based on hope or symmetry, understanding how markets have behaved around these moments can provide valuable context for positioning, risk, and timin
On our way to a new ATH for SOLUSD?This is a possible scenario idea I have in mind for SOLUSD that I want to share with everyone.
Keep in mind that this is not an advice to buy, it should be your decision to buy this specific asset.
There are 4 reasons I am thinking that we are (still) on our way to a new ATH for Solana and why I am extremely bullish on this specific crypto asset:
1. The orange man is pushing the FED for rate cuts for weeks: there already are some numbers (f.e. low inflation) out there that this might happen
ETH to 19k by Dec 17. BTC Aug 2017- identical $/time to ETH nowOn this day, August 2017 BTC was trading at approximately $3400-$3600.
By Christmas, it hit 19.8k. I expect a similar outcome with in ETH 2025.
Leverage causing liquidations on both sides and volatility the whole way up.
Be right and sit tight. These opportunities happen very infrequently. Don't fumble the bag.
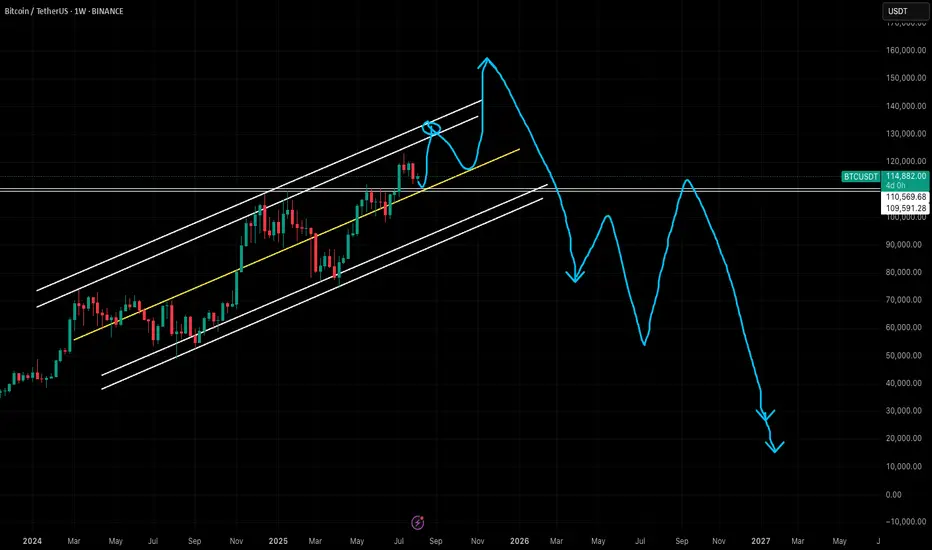
Bitcoin Analysis As Per Seasonality & PatternBitcoin Analysis As Per Seasonality & Pattern - DYOR
Expecting Top Of Bitcoin Around $150k - $160k By The End Of This Year 2025 and Right After That Bitcoin Can Start Falling After Completing Its Bull Cycle
In Next Bear Market Which I Am Expecting In Year 2026 - Potential Bottom Should Be Below $20k - In Next Bear Market Expecting Bitcoin To Take Longest Correction In History Can Around 90% Drop From Its Top
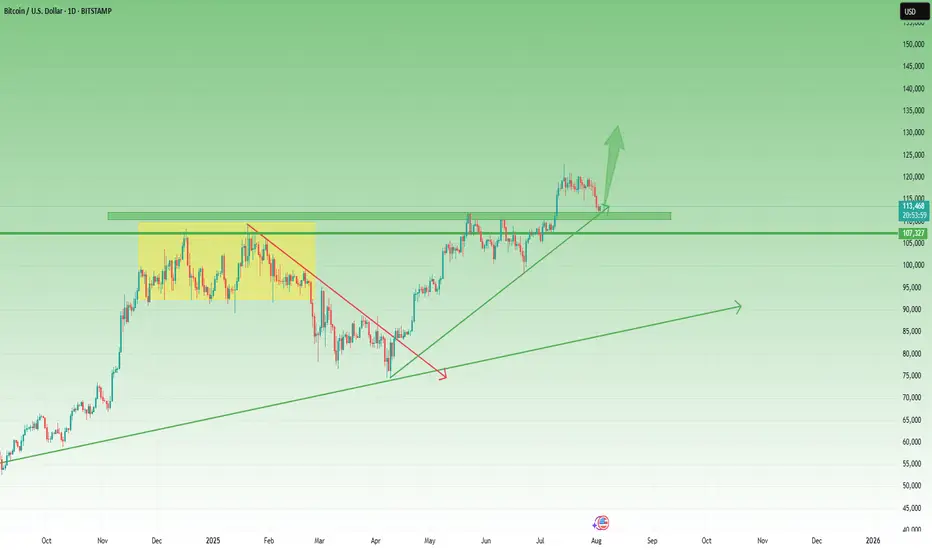
BTCUSD – Is the Correction Over? Key Support Holding so FarLast week was a red one for Bitcoin, with price declining day after day, and losses accelerating into Thursday and Friday.
However, yesterday’s low around 112K landed perfectly at a strong confluence support: a key horizontal level aligned with the ascending trendline from April.
Despite the drop, the broader structure remains firmly bullish. So far, this move looks like a normal correction within an uptrend — nothing more.
Looking ahead, I expect a reversal from this support. If bulls can rec
Nasdaq US100 Wave 3 Expansion Toward 31,606 in PlayNasdaq US100 has completed a significant wave cycle with a confirmed wave 1 in the broader Elliott Wave structure. Following this, price underwent a corrective wave 2 that extended from the $22,237 supply zone down to $16,334, marking the conclusion of the previous cycle’s correction. This structure now signals the initiation of a fresh upward impulse, setting the stage for a powerful wave 3 advance.
The emergence of wave 3 will gain full confirmation once price successfully breaks above the ex
JPY at Key Zone – EURJPY & GBPJPY Could Drop 1k+ PipsExactly one year ago, the JPY Currency Index broke above the falling trendline of a falling wedge, signaling the end of a bearish cycle that had lasted nearly five years.
As is typical after long-term reversals, the reaction was sharp and fast, and the price quickly reached the first resistance target of the pattern.
Since then, the index entered a lateral phase, with clear support forming around the 730 zone.
________________________________________
🔍 Current Price Action
Recently, the pric
Next BTC topHistorically, BTC/USD has tended to peak when the 200-week simple moving average (200W SMA) approaches or crosses the high from the previous market cycle.
If this pattern holds, and assuming the 200W SMA continues rising at its current pace, the next top could occur sometime between January and May 2026.
If BTC accelerates earlier, the moving average would steepen, potentially shifting the timing forward.
Something worth watching to manage risk and position sizing accordingly.
JASMY – A Volatile Setup with x3 Potential 🔸 After bottoming out at 0.003 and spending over a year in accumulation, JASMY finally broke above the key 0.008 resistance zone in February 2024. That breakout triggered a series of explosive moves – but just as violent were the drops that followed.
🔸 What stands out:
• The first post-breakout spike found a new support at 0.015.
• Then came a second vertical move toward 0.06, followed (of course) by a brutal drop.
• But… 0.008 held, and by late June, the chart printed a higher low, showing t
XAU/USD – Ranging Market Prepping for Breakout?Gold has been ranging for the next couple months and usually I am out of the market during the months of April Through July because historically these are not my best months trading XAU/USD. However you will see me posting a lot more in the coming months because my best months historically are August - December where the market really cranks up with some bigger moves.
So in a summarized version below you will find what it is that i am looking at with gold.
Gold (XAU/USD) has remained locked
BTC at Make-or-Break Level! Which Side Are You On?#Bitcoin #BTCUSDT #CryptoTrading #TradeWithMky
📉 Scenario 1 – Bearish Breakdown
If BTC loses the green zone (~117K), expect a heavy drop toward 113K and beyond. This is a key demand zone — break it, and bears dominate.
📈 Scenario 2 – Bullish Reversal
Watch for accumulation between the green & red zones. A breakout above the red supply zone (~119K) will signal buyers are back in charge.
🗣️ As the chart says: "بیا فیک نزن، بعد شکست این محدوده باید بخری!"
🚀 Whether you're a breakout trader or a
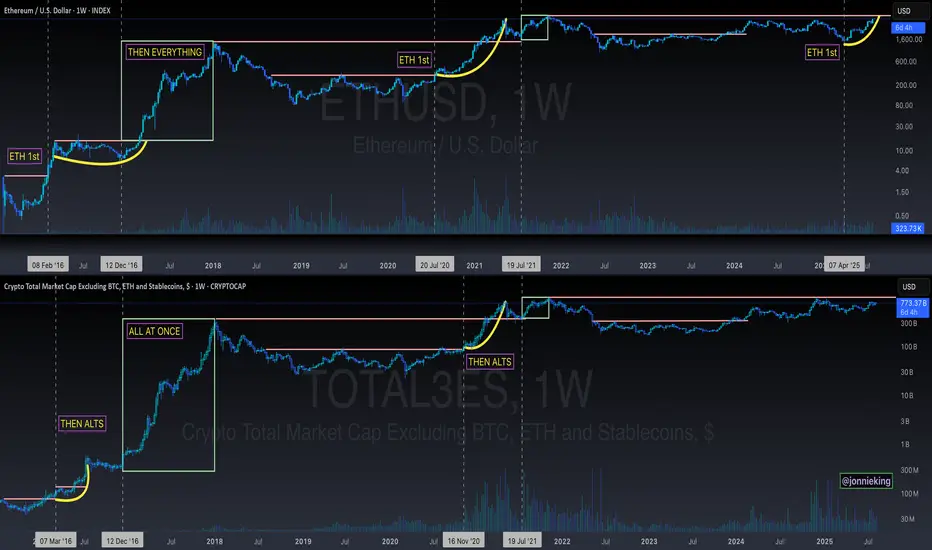
$BTC Will Go Up Alongside Alt SeasonSomeone posted on one of my tweets the following:
" Jonnie my bro, the only problem for me right now is that btc didnt top yet. You also talked how btc shoud top around 200k range. Alt season can only come when btc reach top"
MYTH DEBUNKED ✅
CRYPTOCAP:BTC does NOT need to top in order for Alt Season to commence.
Both can and will occur in tandem 🤝
SPY: Climbing the Wall of Worry — But Is a Turn Coming?SPY: Climbing the Wall of Worry — But Is a Turn Coming?
The S&P 500 (SPY) is pushing into a critical zone as we approach July 28th, and I can’t ignore the confluence of signals piling up here.
Technical Setup
We’re testing the top of a rising wedge formation.
Key round number overhead at $640 — a psychological and options magnet.
Price is extended well above moving averages with declining volume, often a warning sign for bulls.
Multiple resistance lines converge in this zone, creating a hi