SOLUSDT - Countertrend correction. Waiting for a short squeezeBINANCE:SOLUSDT is developing a countertrend rally against the backdrop of a broader bearish market and a local range, while Bitcoin continues to test a key support zone
Bitcoin remains under heavy pressure from a combination of factors: the Fed's hawkish stance, record institutional outflows, the expiration of $10.6 billion in options, the fading geopolitical risk premium following the U.S.–Iran peace agreement, and capital rotation into AI-related stocks. At the moment, the market lacks meaningful fundamental support, and the medium-term outlook remains bearish
In contrast, Solana is showing relative strength despite Bitcoin's weakness, rebounding by 6–10% on the back of strong interest in tokenized equity trading and increased futures speculation ahead of a potential airdrop
Resistance levels: 74.66, 76.06, 76.63
Support levels: 68.07, 65.86, 64.66
As part of the current countertrend move, Solana is developing an aggressive corrective rally. Technically, this advance may be aimed at building liquidity. Market makers may extend the move toward the 74.66–76.63 area of interest, where a short squeeze could develop before the market resumes its decline toward 68.0–64.6
Best regards,
R. Linda  Short
Short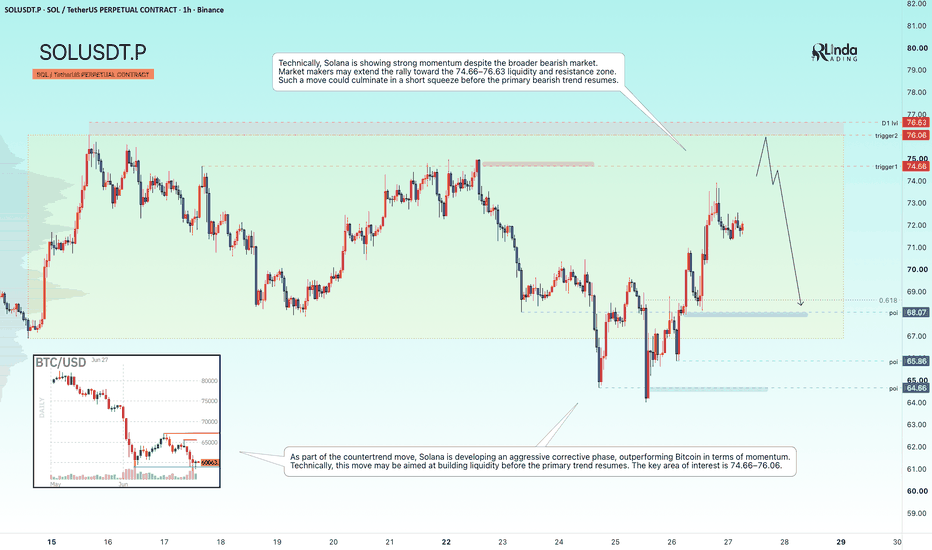
Gold Is Consolidating as Markets Await Key Economic News.Market Outlook
Trend
* Price is currently consolidating within a symmetrical triangle following the previous sharp decline.
* The descending trendline remains the primary barrier, so the short-term bias stays bearish until a clear breakout is confirmed.
Resistance Levels
🔵 4,094 – 4,096 – Near-term resistance and the initial breakout zone to watch.
🔵 4,125 – 4,127 – Major resistance, aligned with a supply zone and the 1.618 Fibonacci extension.
* An H1 candle close above 4,094 would increase the probability of a continuation toward 4,125.
* If bearish rejection signals appear around these resistance zones, selling pressure is likely to return.
Support Levels
🟢 4,038 – 4,040 – Intermediate support, serving as a key level to confirm the breakout if it holds.
🟢 4,015 – 4,017 – Major support, where the ascending trendline converges with a strong demand zone.
* As long as price remains above 4,015, buyers still have the opportunity to push for a breakout from the triangle.
* A break below 4,015 would confirm a downside breakout and signal the return of the bearish trend.
* 3,977 is the next downside support target if the bearish breakout occurs.
⸻
Trading Plan
🟢 BUY GOLD
* Entry: 4,015 – 4,017
* Stop Loss: 4,005
* Take Profit: 200 / 500 / 1000 pips
🔴 SELL GOLD
* Entry: 4,125 – 4,127
* Stop Loss: 4,137
* Take Profit: 200 / 500 / 1000 pips
Risk Management
* Risk no more than 1–2% of your account equity per trade.
* Wait for price confirmation before entering a position.
* Consider moving your stop loss to breakeven once the trade reaches a reasonable profit level to protect your capital.  Long
Long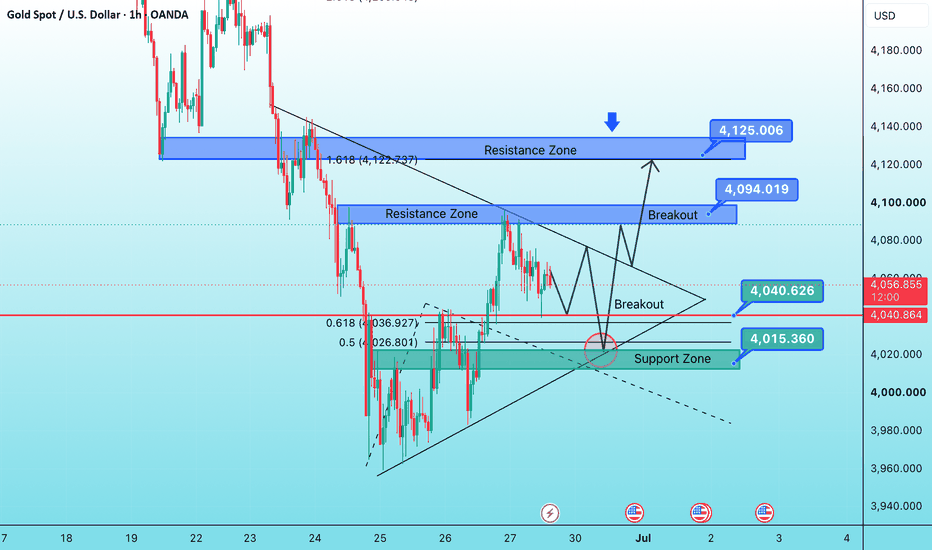
Mastering the SMC Workflow: A Professional GuideWelcome to the Advanced SMC Framework. This methodology focuses on the "footprints" of institutional market participants, allowing traders to align themselves with Smart Money rather than falling for retail traps.
1. Market Structure & Direction
Market Structure Shift (MSS): The primary signal of a trend reversal. It occurs when price breaks the previous internal swing point.
Break of Structure (BOS): Confirms trend continuation. A valid BOS signifies that the market is respecting its existing trend (Bullish or Bearish).
Change of Character (CHoCH): The very first sign of a potential trend change. It is the initial reaction against the prevailing trend.
2. Liquidity: The Market Fuel
Liquidity is the lifeblood of institutional trading. It is where retail stop-losses are clustered, providing the necessary volume for "Smart Money" to enter their positions.
Buy Side Liquidity (BSL): Equal Highs – retail traders place buy stops here.
Sell Side Liquidity (SSL): Equal Lows – retail traders place sell stops here.
Rule: Always wait for a Liquidity Sweep (Price taking out highs/lows) before entering a trade.
3. Institutional Entry Zones
Order Block (OB): The last candle before a significant move. These are high-probability zones where institutional orders remain unfilled.
Fair Value Gap (FVG): An imbalance in price action, represented by a gap between three candles.
Fresh FVG: Highly potent, as it has not been tapped yet.
Old FVG: Weakened due to prior market interactions.
Breaker & Mitigation Blocks: Former Order Blocks that have failed. A failed Buy OB becomes a potential Sell zone (Breaker Block) upon retest.
4. Precision & Optimization
Premium & Discount Pricing: Use the Fibonacci tool.
Discount Zone (<50%): The "Buy" area in an uptrend.
Premium Zone (>50%): The "Sell" area in a downtrend.
Optimal Trade Entry (OTE): The golden 62%–79% Fibonacci retracement zone. Confluence of an OB, FVG, and Liquidity here creates a high-probability setup.
Liquidity Void: Rapid price movement with little to no trading volume, often filled later in the cycle.
SMT Divergence: Comparing correlated assets (e.g., BTC vs. ETH). If one asset fails to make a new high while the other does, it indicates exhaustion/reversal.
5. The Professional SMC Workflow
For a high-probability trade, look for the following confluence:
Identify HTF (Higher Timeframe) Trend.
Wait for Liquidity Sweep.
Identify MSS/CHoCH.
Check for strong Displacement (accompanied by FVG).
Refine entry via Order Block or OTE Zone.
Maintain a Risk:Reward ratio of at least 1:3.
Indicator Logic Integration
Our custom approach automates these complex tasks:
Dynamic Visuals: Clearly differentiates between Fresh and Old FVG/Order Blocks.
Auto-Detection: Automatically marks Liquidity Sweeps, BOS, and CHoCH.
Signal Filtering: Provides entry alerts only when multiple confluence factors (e.g., OTE + FVG + OB) align, filtering out "noise."
Professional Note: Trading the financial markets involves significant risk. This framework is designed to improve your probability of success by trading with the flow of institutional capital. Always manage your risk through disciplined position sizing. Education 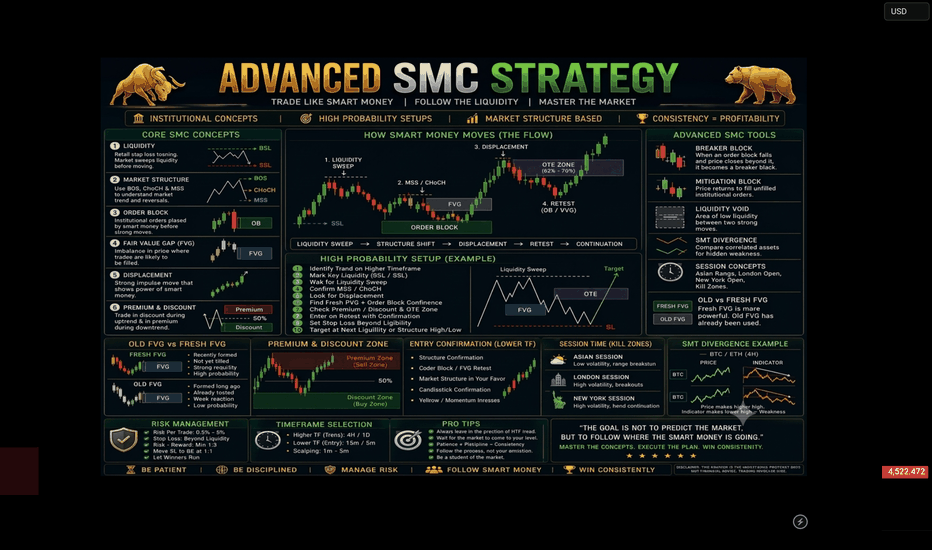
Gold Trend at the End of the WeekMarket Outlook
🔹 Trend: Price remains in an overall bearish trend but is currently experiencing a short-term recovery while trading above an ascending trendline. The current momentum suggests a consolidation phase before the next significant breakout.
🔹 Key Resistance Levels:
* 4,054 – 4,056: Near-term resistance. If price breaks above this zone and closes with confirmation, it could extend the rally toward 4,095.
* 4,145: The next major resistance level, which will be crucial in determining a medium-term bullish reversal.
🔹 Key Support Levels:
* 3,975 – 3,977: Immediate support, aligned with the ascending trendline. Holding above this zone would keep the current recovery intact.
* 3,910: The final major support, coinciding with a key Fibonacci level. A break below this area would confirm and accelerate the broader bearish trend.
🔹 Scenarios:
* Bullish: A breakout above 4,056 could drive price toward 4,095 and 4,145.
* Bearish: A break below the ascending trendline and the 3,955 support level could send price lower toward 3,910.
⸻
Trading Plan
🔴 SELL GOLD
* Entry: 4,094 – 4,096
* Stop Loss: 4,106
* Take Profit: 200 / 500 / 1000 pips
🟢 BUY GOLD
* Entry: 3,912 – 3,910
* Stop Loss: 3,900
* Take Profit: 200 / 500 / 1000 pips
Risk Management
* Risk no more than 1–2% of your account equity per trade.
* Wait for confirmation signals before entering a position.
* Consider moving your stop loss to breakeven once the trade reaches a reasonable profit level to protect your capital. Long 
XAUUSD – Gold Is Recovering, But Fibonacci Resistance Is TheXAUUSD – Gold Is Recovering, But Fibonacci Resistance Is The Next Test
Gold is recovering, but the market is not fully bullish yet.
After a strong drop earlier this week, price found support near the lower channel and started a short-term recovery. Gold is now around 4,088, testing its first key resistance.
The recovery is improving, but the main test lies at the Fibonacci resistance zones where sellers may react.
WEEKLY TREND SUMMARY
Gold started the week with strong bearish pressure, breaking multiple supports and moving inside a descending channel. Midweek, sellers dominated below the SMA 200.
Near the channel bottom, buyers stepped in and pushed price into a recovery phase. By the end of the week, gold shifted from bearish continuation to a short-term correction, but the overall trend still needs confirmation.
FUNDAMENTAL ANALYSIS
Gold remains sensitive to USD, yields, and rate expectations. The current bounce is likely driven by profit-taking and technical buying.
For now, price action is key. A break above Fibonacci resistance is needed for stronger upside.
TECHNICAL ANALYSIS – SMC + FIBONACCI
Gold reacted from the lower channel and is forming a short-term bullish correction. Buyers are defending the 4,020 – 4,045 zone.
As long as price holds above this area, upside continuation is possible.
Key resistance sits at 4,110 – 4,130. A breakout here could push price toward 4,160 – 4,175. However, both zones may trigger selling since price is still below SMA 200.
KEY PRICE ZONES TO WATCH
Current price: 4,088
Buy zone: 4,020 – 4,045
Support: 4,045
Resistance 1: 4,110 – 4,130
Resistance 2: 4,160 – 4,175
SMA 200: ~4,381
Lower support: 3,960 – 3,980
Bearish continuation: Below 3,960
Invalidation: Below 4,020
TRADING SCENARIOS
Buy Scenario
Buy Zone: 4,020 – 4,045
Entry: Bullish reaction or CHoCH
SL: Below 4,020
TP1: 4,110 – 4,130
TP2: 4,160 – 4,175
Breakout Buy
Condition: Break and hold above 4,130
Target: 4,160 – 4,175
Sell Scenario
Sell Zone: 4,110 – 4,130 or 4,160 – 4,175
Entry: Bearish rejection or CHoCH
TP1: 4,045
TP2: 4,020
TP3: 3,960 – 3,980
Invalidation: Above 4,175
MY VIEW ON GOLD
Gold is in a short-term recovery within a broader bearish trend.
Buyers are building a base, but the key level is 4,110 – 4,130. A breakout could extend gains, while rejection may bring sellers back.
Gold is recovering, but Fibonacci resistance will decide the next move.
Will gold break above 4,130 or face rejection again?
Long 
XAU- Medium-Term Bearish Structure Still Targets Lower LiquidityMASON XAUUSD – Medium-Term Bearish Structure Still Targets Lower Liquidity
XAUUSD is trading around 4,088 after recovering from the recent support area. Although gold is showing a short-term rebound, the medium-term structure remains bearish.
The main trend is still down, and any recovery toward resistance should be treated as a corrective wave unless price breaks back above the major supply structure.
Technical View
Gold is still moving inside a broad bearish structure. The chart shows a clear sequence of lower highs and lower lows from the previous top area, which means sellers are still controlling the medium-term direction.
The latest rebound from the 3,960 support zone is only a technical reaction for now. Price has not broken the main bearish structure, and the recovery is moving back into a previous supply area.
The zone around 4,080–4,130 is important because it sits near the marked DOW secondary wave area. If price fails here and forms bearish rejection, this zone may become the next lower high before another downside continuation.
The 3,960 level is the nearest key support. If gold breaks below this area again, the next downside target is the weekly target around 3,752. A deeper bearish continuation can open the way toward the major target near 3,362.
Fibonacci also supports the bearish roadmap. The 2.618 extension area near 3,752 is marked as the weekly target, while the 3.618 extension near 3,362 is the deeper medium-term target.
Key Zones
Current price: 4,088
Short-term resistance: 4,080–4,130
DOW secondary wave zone: 4,100–4,130
Key support: 3,960
Weekly bearish target: 3,752
Major medium-term target: 3,362
Invalidation for bearish continuation: above 4,350
Trading Plan
Sell Priority: 4,080–4,130
Condition: wait for bearish rejection, failed breakout, or lower high formation around the resistance zone.
SL: above 4,350
TP1: 3,960
TP2: 3,752
TP3: 3,362
Alternative Scenario
If gold breaks above 4,130 and holds, price may continue a deeper corrective rebound toward 4,300–4,350. However, this would still be a correction unless the market breaks the full bearish structure.
Buy View
Buy is not the priority in the medium-term view. A short-term buy reaction may appear above 3,960, but it should be managed as a corrective move, not a confirmed trend reversal.
Final View
Overall, gold remains in a medium-term bearish structure. The current rebound can continue slightly higher, but the cleaner view is to watch for rejection around 4,080–4,130. If 3,960 fails, the next downside focus will be 3,752, followed by the deeper target around 3,362.
Will gold reject from the secondary wave zone, or extend the correction before the next bearish move?
Short 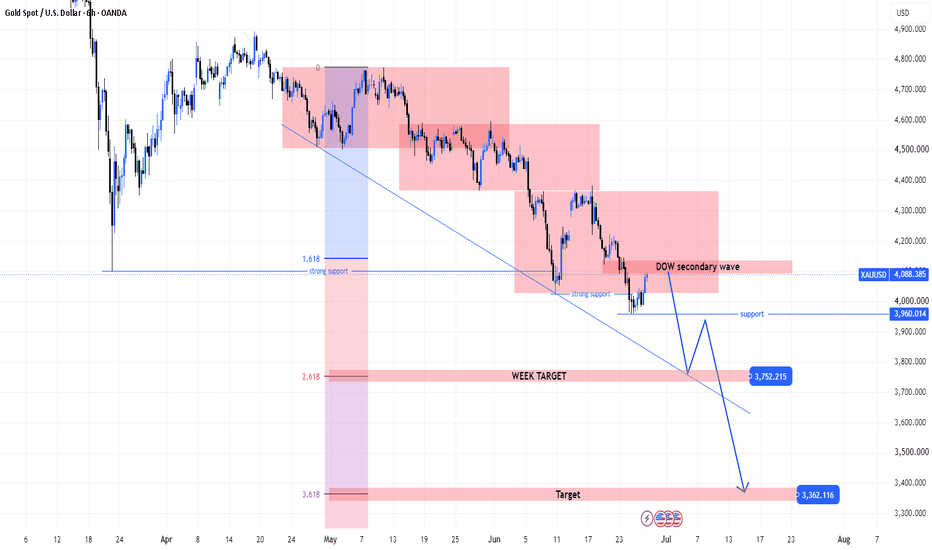
GOLD - Countertrend correction to the liquidity zoneFX:XAUUSD appears to be forming a local bottom and may enter a countertrend correction to build liquidity. However, the broader outlook remains negative, driven by a weak fundamental backdrop, a strong U.S. dollar, and the prevailing bearish trend
Gold remains vulnerable. The technical picture, combined with uncertainty surrounding the security of shipping through the Strait of Hormuz, continues to weigh on prices. In addition, doubts over the durability of the U.S.–Iran peace agreement are keeping buyers on the sidelines.
Technically, the market has printed a new low at 3960, confirming the broader bearish structure that aligns with the global market trend. A corrective move toward 4090–4121 is expected before the downtrend potentially resumes
Resistance levels: 4090, 4121, 4198
Support levels: 3983, 3964, 3915
As part of the countertrend correction, gold may test the 4090–4121 liquidity pool. A short squeeze in this area could trigger another decline toward 3983–3964. However, a deeper correction toward the key liquidity zone at 4198–4200 cannot be ruled out, where another bearish reversal may develop
Best regards,
R. Linda Short 
XAUUSD — EMA Downtrend, Waiting for a Value Pullback
Fundamental Analysis
Gold remains under bearish pressure as price continues to trade below the main EMA structure. Traders are still watching USD momentum, Treasury yields, and upcoming U.S. macro data.
For now, any short-term recovery should be treated as a technical pullback unless price can reclaim the EMA resistance zone with strong confirmation.
Technical Analysis
On the 2H chart, XAUUSD is still trading below EMA 34, EMA 89, and EMA 200. This confirms that the main trend remains bearish, with the EMA structure acting as dynamic resistance above price.
Price is currently around 4,003 after rejecting from the previous recovery area. The chart shows that gold may create a small corrective bounce toward the EMA value zone before continuing lower.
The first sell reaction area is around 4,045 - 4,060. A deeper pullback may reach the stronger sell swing zone around 4,078 - 4,088. If price rejects from these areas, sellers may continue to control the structure.
The main downside target is the psychological liquidity zone around 3,936 - 3,935.
Important Key Levels
Current price area: 4,003
EMA value zone: 4,045 - 4,060
Sell scalping zone: 4,059 - 4,078
Sell swing zone: 4,078 - 4,088
EMA resistance area: 4,044 - 4,126
Invalidation area: above 4,116 - 4,126
Main downside target: 3,936 - 3,935
Trading Scenario
Main Sell Scenario
Entry: 4,059 - 4,088
Stop Loss: 4,126
Take Profit 1: 4,003
Take Profit 2: 3,960
Take Profit 3: 3,936 - 3,935
Sell Condition
The preferred setup is to wait for gold to correct higher into the 4,059 - 4,088 value zone. This area aligns with the EMA reaction zone, Fibonacci structure, and previous sell pressure.
A sell setup becomes more valid if price forms bearish rejection from this zone, such as a long upper wick, bearish engulfing candle, failed breakout, or lower high below the EMA structure.
If price rejects from the sell zone and breaks back below 4,003, the bearish continuation view becomes stronger. The next downside focus would be 3,960, followed by the psychological liquidity target around 3,936 - 3,935.
Entry Conditions
Wait for price to pull back into 4,059 - 4,088.
Look for bearish rejection before entering sell.
Do not sell aggressively at the low without a pullback.
A break below 4,003 confirms stronger downside pressure.
If price breaks and holds above 4,126, the sell setup is invalid.
Overall, the main view remains bearish while XAUUSD trades below EMA 34, EMA 89, and EMA 200. Gold may create a light corrective bounce first, but the preferred plan is to wait for a reaction from the EMA value zone before looking for continuation toward 3,936 - 3,935.
Do you share the same bearish view on gold, or are you waiting for a cleaner pullback into the EMA value zone first?
Short 
XAUUSD: Main Trend Still BearishXAUUSD: Main Trend Still Bearish, Waiting for Confirmation Around 4,008
Market Context
Gold remains under strong bearish pressure after continuing to trade inside a clear downward structure. The latest price action shows that sellers are still controlling the market, while buyers are only trying to build a corrective rebound from the lower liquidity area.
At the moment, the key question is not whether gold has reversed, but whether price can hold above the 4,008 trendline area long enough to create a valid recovery. Without confirmation, any bounce should still be treated as corrective.
Technical Structure
Gold is currently trading around 3,989 after reacting from the strong liquidity zone near 3,964. The main trend remains deeply bearish, supported by the descending trendline and multiple BOS signals on the chart.
The 3,964 area is the major downside level to watch. If price breaks below this zone with strength, bearish continuation may open toward lower liquidity levels.
However, if gold holds above the 4,008 trendline area and forms bullish confirmation, a corrective rebound can happen first. The nearest upside reaction zone is 4,036, followed by the next target around 4,083.
The key sell area above remains the OB zone around 4,180 - 4,200. If price recovers into this zone and rejects, sellers may return again for the next bearish leg.
Key Levels
Current Price: 3,989
Strong Liquidity Support: 3,964
Trendline Confirmation Area: 4,008
Buy-side Liquidity / Sell Order Zone: 4,036
Corrective Rebound Target: 4,083
Major Sell Swing OB Zone: 4,180 - 4,200
Bearish Continuation Level: Below 3,964
Trading Plan
Buy Scenario: Corrective Rebound
Entry: Above 4,008 after bullish confirmation
Stop Loss: Below 3,964
Take Profit 1: 4,036
Take Profit 2: 4,083
Take Profit 3: 4,120
Conditions:
Price must hold above the 4,008 trendline area
Bullish rejection or CHOCH appears on lower timeframe
Price reclaims 4,018 with strength
Buyers defend the 3,964 liquidity zone
Avoid buying if price breaks below 3,964
Sell Scenario: Trend Continuation
Entry: Below 3,964 after confirmed breakdown and retest
Stop Loss: Above 4,008
Take Profit 1: 3,940
Take Profit 2: 3,920
Take Profit 3: 3,900
Conditions:
Price breaks below the 3,964 strong liquidity zone
Retest of the broken level fails
Bearish momentum continues after breakdown
Price remains below the descending trendline
Sellers continue to create lower highs
Alternative Sell Scenario: Sell From OB Zone
Entry: 4,180 - 4,200 after bearish confirmation
Stop Loss: Above 4,220
Take Profit 1: 4,083
Take Profit 2: 4,036
Take Profit 3: 3,964
Conditions:
Price recovers into the OB sell zone
Strong bearish rejection appears
Price fails to hold above the OB zone
Market structure remains bearish
Overall Bias
The main trend is still bearish. Gold is only attempting a corrective rebound from the lower liquidity area, but the recovery needs confirmation above the 4,008 trendline.
If price holds above 4,008, a short-term rebound toward 4,036 and 4,083 may appear. If price breaks below 3,964, bearish continuation becomes the priority again.
For now, the best approach is to wait for confirmation around 4,008 and 3,964 instead of chasing price in the middle.
What do you think — will gold hold above 4,008 for a corrective rebound, or break below 3,964 and continue the main bearish trend?
Long 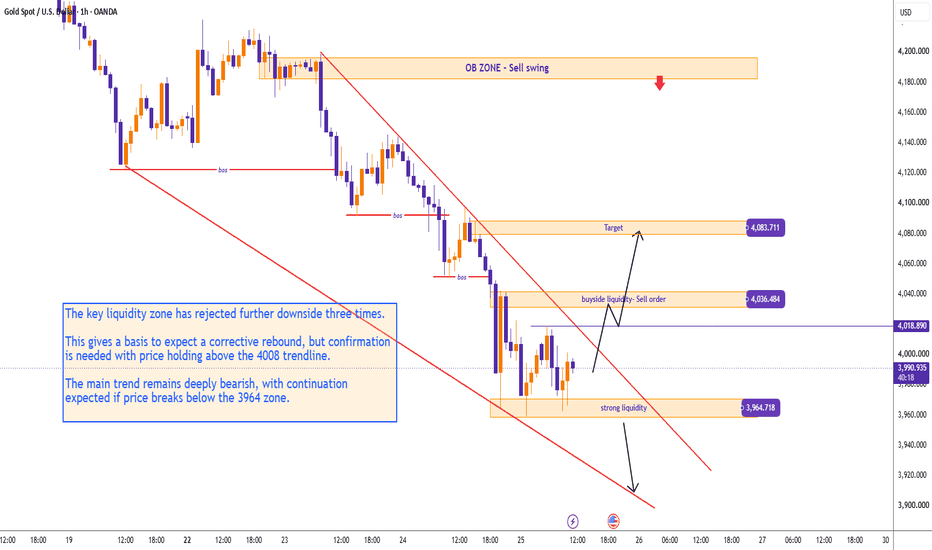
XAUUSD-GOLD | (1D) | Swing Analysis | Prof.TraderTilkiGuys, greetings,
I analyzed XAUUSD-Gold on the daily timeframe.
I detected a harmonic pattern here. These patterns sometimes work, sometimes don’t. Right now, we are at a critical point. If on the daily timeframe price falls below 4159 – 4103 and closes a candle there, the pattern will be invalidated. A wick does not cancel it — only a candle close matters, keep that in mind.
If it’s not invalidated, the pattern targets are:
1st target: 4510
2nd target: 4578
Currently, gold is at 4336.
Remember, fundamental factors are very important, especially geopolitical risks which strongly affect gold. Technical analysis is not as important as fundamentals. Whales and market movers focus mainly on fundamental data.
If 4100 breaks, the decline could extend toward 3990.
Guys, I continue these analyses thanks to your likes. Thanks to all my friends who support with likes. Gold Is Gradually Losing Its Dominance.XAUUSD – M15 Timeframe
🔹 Trend: Price continues to maintain a short-term bearish structure, consistently forming lower highs and remaining compressed beneath the descending trendline.
🔹 Key Resistance Levels:
* 4,019 – 4,020: Near-term resistance and a key level that will likely determine the short-term direction.
* 4,053 – 4,055: Strong resistance zone. A breakout and confirmed candle close above this area would signal a potential bullish reversal.
* 4,098 – 4,100: The next upside target if the breakout is successful.
🔹 Key Support Levels:
* 3,963 – 3,965: Short-term support and the current consolidation low.
* 3,928 – 3,930: Strong Daily timeframe support, serving as the next downside target if price breaks below 3,965.
🔹 Trendline: The descending trendline continues to exert pressure on price. A breakout accompanied by strong momentum and a confirmed candle close could trigger a recovery move toward 4,053–4,098. Conversely, a break below 3,965 would reinforce the bearish trend, targeting 3,930.
⸻
Trading Plan
🟢 BUY GOLD
* Entry: 3,930 – 3,928
* Stop Loss: 3,918
* Take Profit: 200 / 500 / 1000 pips
🔴 SELL GOLD
* Entry: 4,053 – 4,055
* Stop Loss: 4,065
* Take Profit: 200 / 500 / 1000 pips
Risk Management
* Risk no more than 1–2% of account equity per trade.
* Wait for confirmation signals before entering a position.
* Consider moving the stop loss to breakeven once the trade reaches a reasonable profit level to protect capital. Short 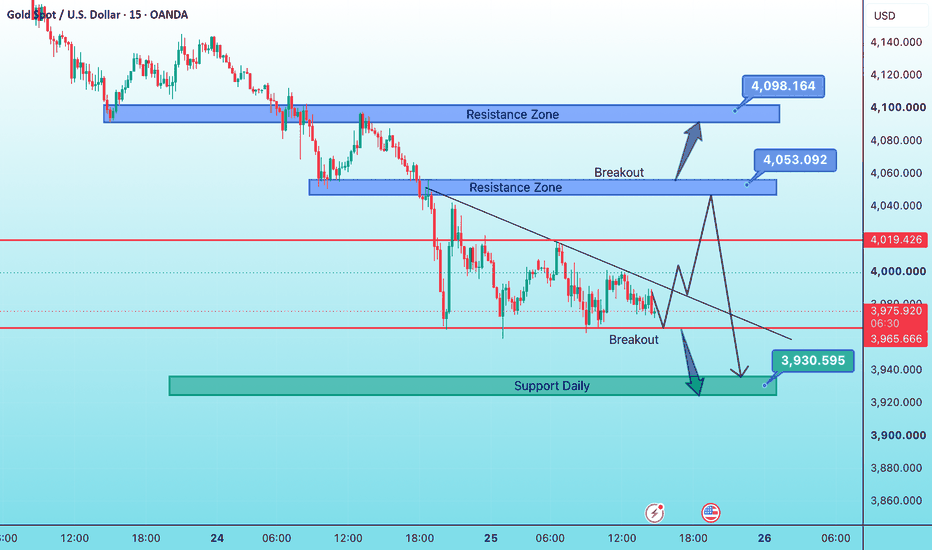
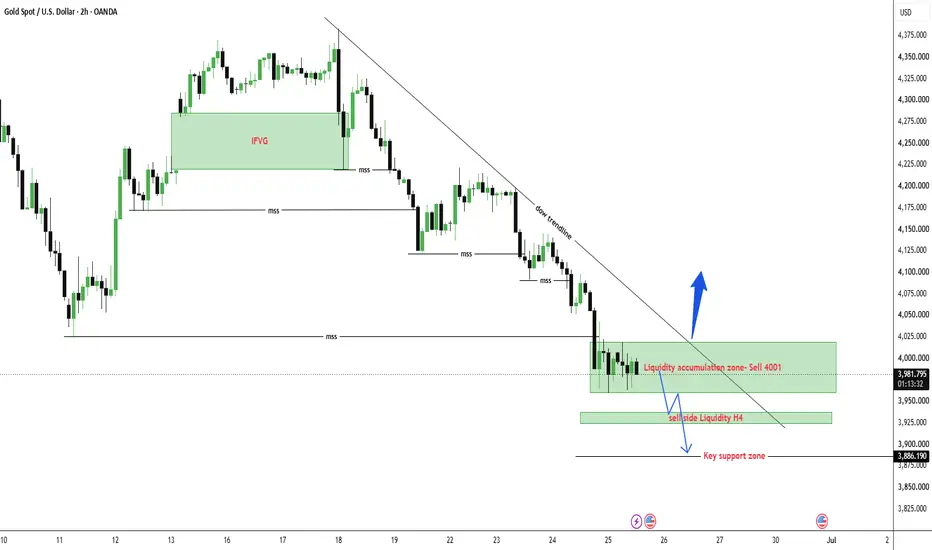
XAUUSD — Bearish Structure Holds, Sell Bias Below 4018
Gold is trading around $3,982 after forming a light accumulation phase near the lower range. Price has slowed down after the recent sell-off, but the main structure is still bearish as long as gold remains below the descending trendline and below the $4,018 invalidation area.
From an SMC perspective, gold has already created multiple MSS confirmations to the downside. The current sideways movement looks more like liquidity accumulation than a clear bullish reversal. This means sellers may still defend the $4,000–$4,018 area if price retests it and fails to break structure.
The key level for today is $4,018. As long as price stays below this level, the sell bias remains valid. A clean break above $4,018 and especially above the descending trendline would be the first signal that gold may shift into a short-term bullish reversal structure.
Sell setup 1
Condition:
Gold retests the liquidity accumulation zone around $4,000–$4,018 and shows bearish rejection with lower timeframe MSS / CHOCH.
Entry: $4,000–$4,018
SL: above $4,035
TP1: $3,950
TP2: $3,925
TP3: $3,886
Sell setup 2
Condition:
If gold breaks below $3,950 and retests this area as resistance, bearish continuation remains valid.
Entry: below $3,950 after retest
SL: above $3,985
TP1: $3,925
TP2: $3,900
TP3: $3,886
Buy setup
Condition:
Buying is not the priority. A buy setup is only valid if gold breaks above $4,018, closes above the descending trendline, and confirms bullish MSS / CHOCH.
Entry: above $4,018 after breakout retest
SL: below $3,980
TP1: $4,050
TP2: $4,085
TP3: $4,120
Key levels
Current price area: $3,982
Liquidity accumulation zone: $3,960–$4,018
Main sell reaction area: $4,000–$4,018
Sell-side liquidity H4: $3,925–$3,935
Key support zone: $3,886
Bearish continuation confirmation: clean break below $3,950
Bullish reversal confirmation: clean break above $4,018 and above the trendline
Bearish invalidation: clean 2H close above $4,018
My current view is that gold is still in a bearish structure while price trades below $4,018. The current accumulation may create short-term noise, but unless price breaks the trendline and confirms a bullish shift, the priority remains selling from resistance toward the lower liquidity zones.
No confirmation, no trade.
Short 
BITCOIN - Consolidation (correction) before the fallBINANCE:BTCUSDT.P remains under pressure. There is no meaningful fundamental support for the market, while the broader bearish trend continues to define the medium-term direction. There are still no clear signs of a market bottom forming
Globally, Bitcoin continues to maintain a bearish trend. Within this trend, the market remains in a consolidation phase with no indications of a reversal. Technically, the downtrend may continue in the medium term.
Fundamentally, the outlook remains weak. Cryptocurrency inflows to exchanges continue, while spot ETF outflows persist. Any attempts to rally are increasingly viewed as potential traps before another leg lower. A retest of 59800 followed by a close below this level would be a strong signal that the market is preparing to move toward 50K
Resistance levels: 63220, 63750
Support levels: 62230, 60750, 59800
Following the distribution phase and the long squeeze below the 62232 support level, a countertrend correction is developing, aimed at hunting liquidity. As part of this correction, Bitcoin may test the 63220–63750 area before resuming its decline. A short squeeze in this zone could trigger a further move lower toward 60800–59800
Best regards,
R. Linda  Short
Short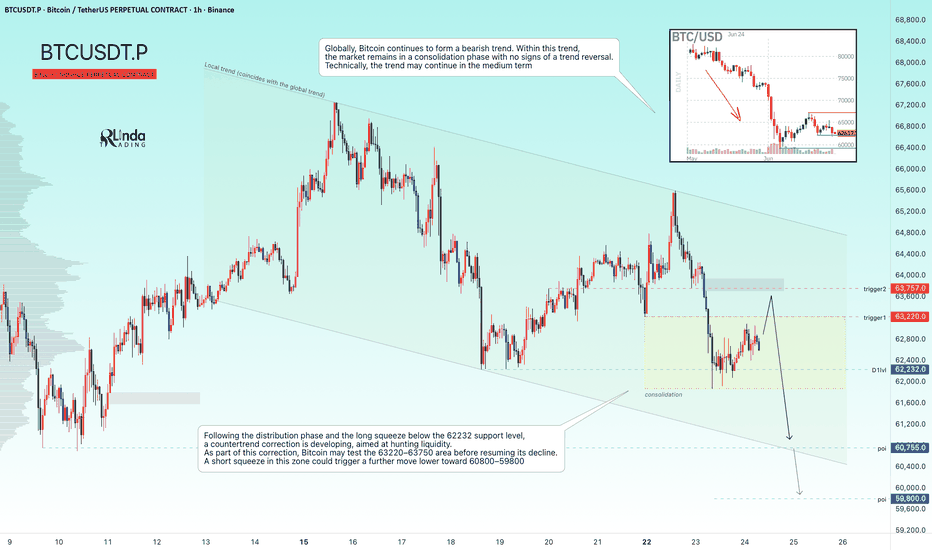
NOTUSDT — Active Bearish Sequence With Liquidity ClearedOKX:NOTUSDT is showing a clean bearish continuation structure on the 30M.
The sequence is still active. B has not been invalidated, and the C target remains unreached. That matters because as long as B holds, the downside objective is still alive.
What makes this setup interesting is not just the bearish sequence itself. It is the liquidity behavior around the trendline.
Price pushed into the BC area, violated the trendline, and created a trap on both sides.
Early sellers were liquidated on the move up.
Then buyers who chased the breakout/reclaim got liquidated when price failed and rotated back down.
After that, we got a breaker block forming near the reaction zone. That gives the structure a clearer invalidation area and keeps the bearish target open.
For me, this is the important part:
The market already collected liquidity.
The sequence is still valid.
The target has not been reached.
Invalidation is clean above B.
Room to C remains.
I am not interested in random shorts. I am interested in moments where price gives structure, liquidity, failure, and a clean objective.
This is one of those moments where the chart is saying:
buyers tried, sellers absorbed, and the downside target is still unfinished.
SmellyTaz — decoding chaos.  Short
Short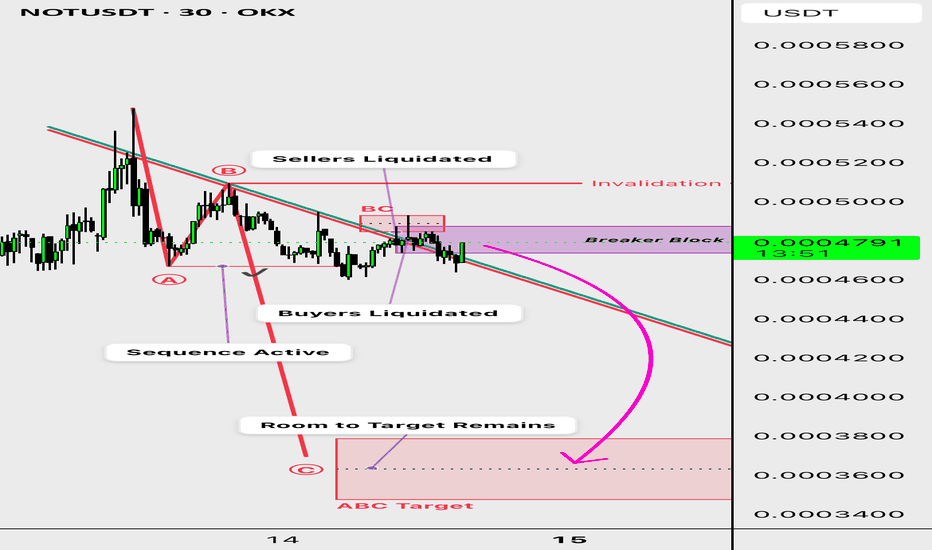
Short 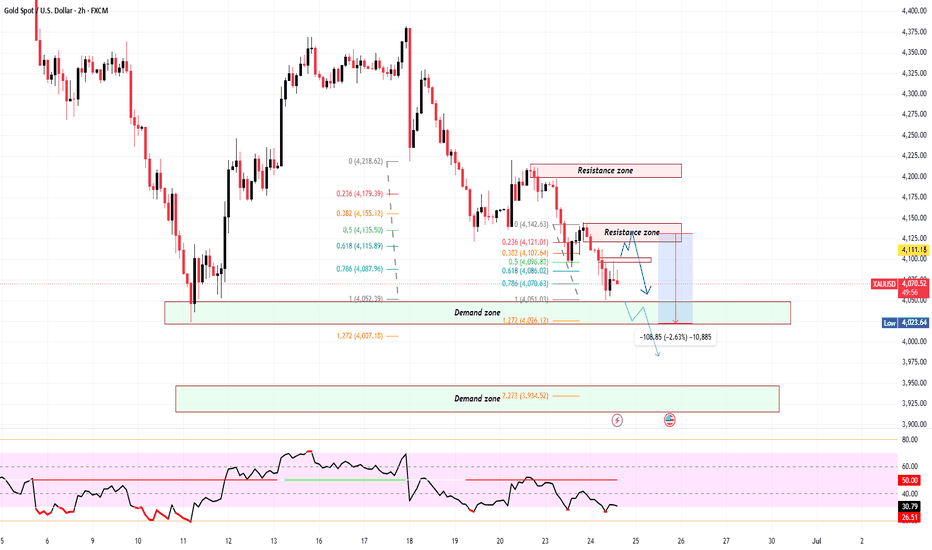
XAUUSD H1 | Bearish Structure Intact Ahead of Key US Data Week
This week, Gold traders are closely watching several high-impact U.S. events:
🔹 Fed Chair Powell Testimony – Markets will look for clues regarding the timing of future rate cuts.
🔹 US Consumer Confidence
A weaker reading could support Gold, while stronger sentiment may strengthen the USD.
🔹 US GDP Final Estimate (Q1)
An upward revision would reinforce economic resilience and potentially pressure Gold.
🔹 Core PCE Price Index (Fed's Preferred Inflation Gauge)
This is the most important event of the week. A hotter-than-expected PCE could delay rate-cut expectations and support Treasury yields and the Dollar.
From a macro perspective, markets remain cautious after last week's FOMC meeting. The Fed maintained a restrictive stance, while easing geopolitical tensions in the Middle East continue to reduce safe-haven demand for Gold.
Key Levels
Immediate Resistance
🔹 4,140 - 4,150 (Current supply zone)
Secondary Resistance
🔹 4,180 - 4,200 (Previous consolidation area)
First Bearish Target
🔹 4,070 - 4,080 (Liquidity pocket)
Major Demand Zone
🔹 4,030 - 4,040 (Institutional demand / discount area)
Primary Scenario
As long as price remains below 4,150, the bearish trend remains valid.
Any retracement into the supply zone may provide fresh selling opportunities targeting: 4,070 → 4,040
The recent BOS confirms that market structure favors continuation lower.
Bullish Invalidation
If buyers reclaim 4,150 and secure an H1 close above the supply zone, downside momentum weakens significantly.
In that case, Gold could attempt a deeper correction toward: 4,180 → 4,200 Long 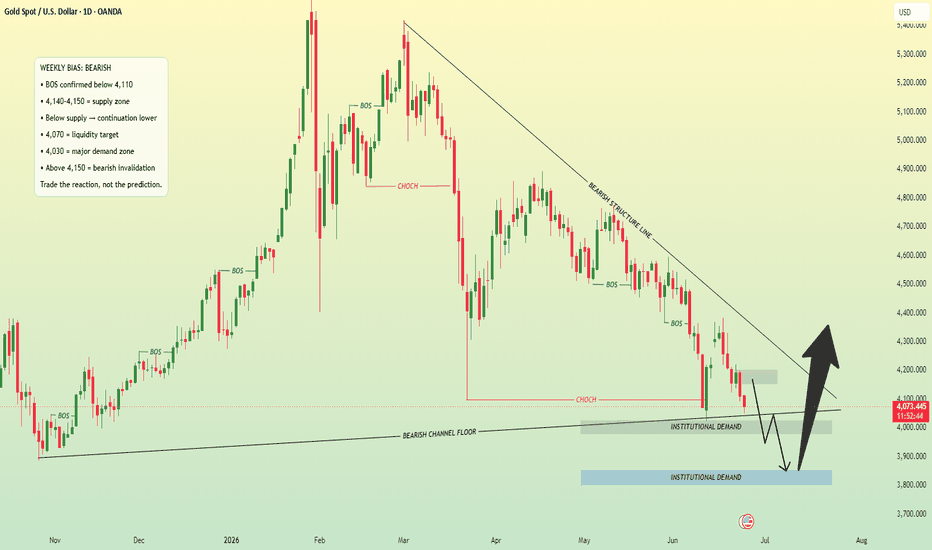
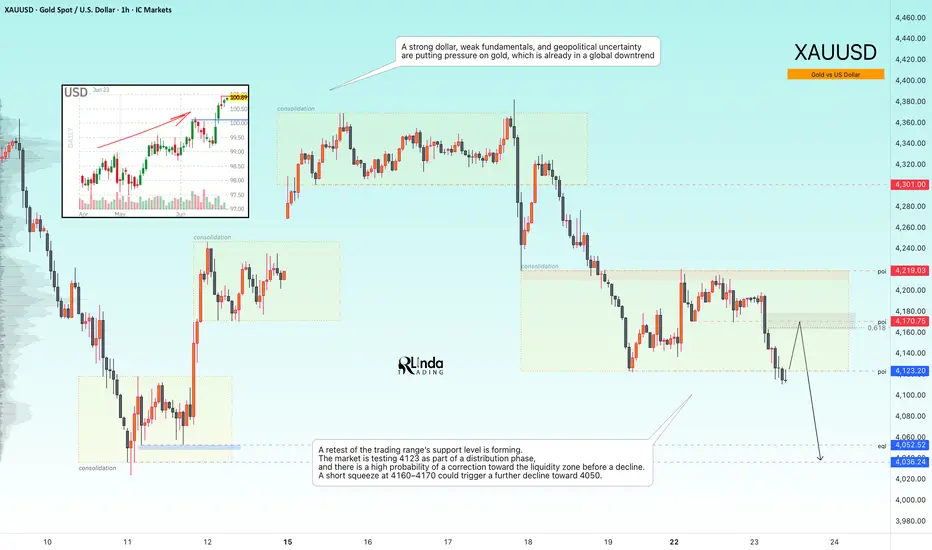
GOLD - A correction before the decline continues toward 4000ICMARKETS:XAUUSD continues to decline and print new lows under pressure from three key factors: a strong U.S. dollar, a weak fundamental backdrop, and ongoing geopolitical uncertainty. In the medium term, the market may remain under bearish control.
Sellers continue to dominate. The dollar remains strong, while expectations of a Federal Reserve rate hike continue to pressure gold as a non-yielding asset. Any rebound is likely to be viewed as an opportunity for fresh selling. Key catalysts ahead include PMI data releases and developments in the Middle East.
Drivers:
Downside: a stronger dollar, hawkish Fed expectations, persistent geopolitical uncertainty, and strong PMI data.
Upside: progress in negotiations, a dovish Fed signal, weak PMI data, and profit-taking on long dollar positions.
Resistance levels: 4170, 4210
Support levels: 4123, 4050
A retest of the trading range support is developing. The market is testing 4123 within the current distribution phase, and there is a high probability of a corrective move toward the liquidity zone before another decline. A short squeeze into the 4160–4170 area could trigger a further move lower toward 4050.
Best regards,
R. Linda Short 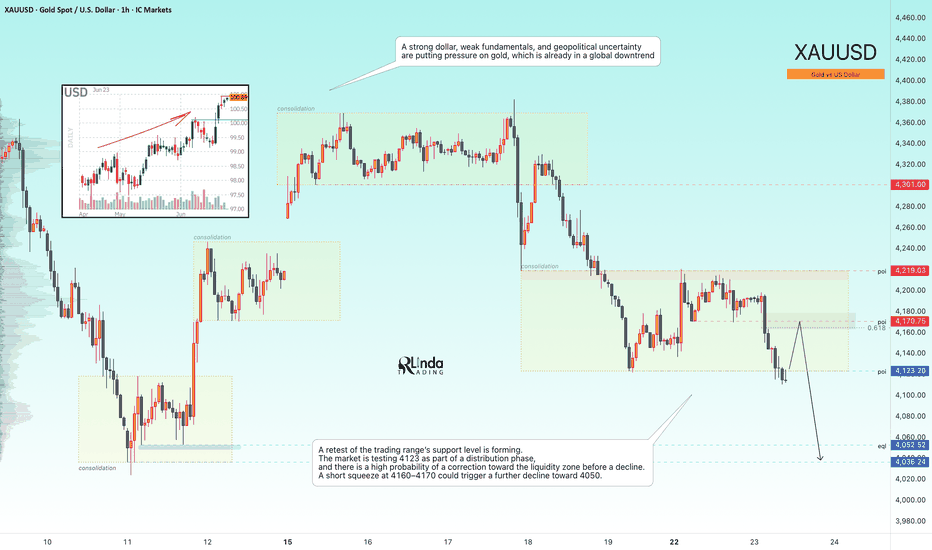
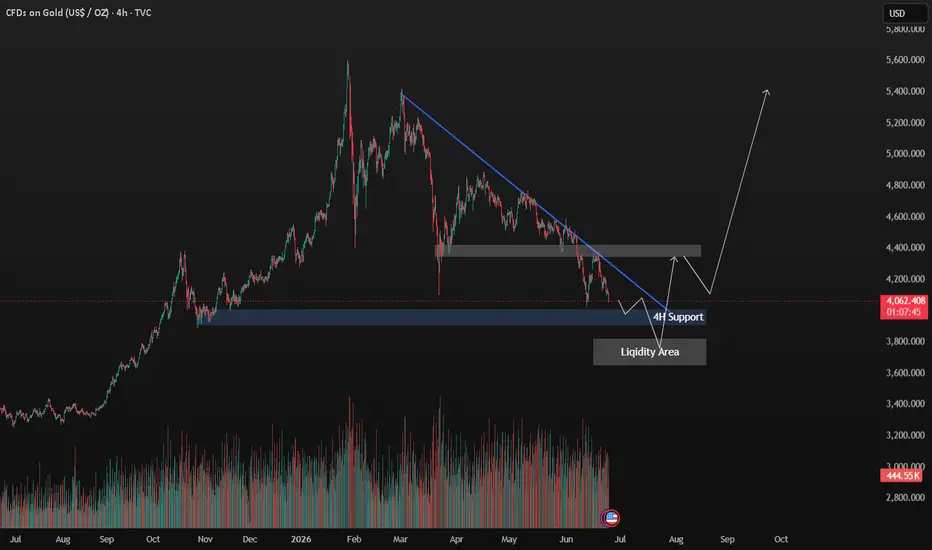
Technical Analysis: Gold (XAU/USD) - 4H TimeframeOANDA:XAUUSD TVC:GOLD
Gold is currently trading at $4,065.328 on the 4-hour timeframe, continuing a significant medium-term correction. After reaching peak highs near the $5,400–$5,600 zone earlier in the year, the asset has established a clear sequence of lower highs and lower lows. The current price action is heavily dictated by a dominant descending trendline that has capped bullish momentum for several months.
Key Technical Observations
Descending Resistance: A steep, unbroken blue trendline highlights the prevailing bearish momentum. Every attempt to rally has been systematically rejected at this dynamic resistance level.
4H Support & Liquidity Zone: There is a critical support block established around the $3,900–$4,000 region, which has recently served as the last line of defense for buyers. Just below this support lies a defined "Liquidity Area." In institutional trading concepts, areas below major swing lows often harbor large clusters of stop-loss orders.
Overhead Resistance: Above the current price action, a structural resistance block rests near the $4,300–$4,400 level. This area must be reclaimed by buyers to shift the macro market structure back to bullish.
Anticipated Price Scenario: The "Liquidity Sweep" Reversal
The path projected by the white arrows on the chart outlines a classic "liquidity sweep" or "spring" setup, which is a common precursor to major trend reversals.
The Flush (Liquidity Grab): The chart anticipates a final, sharp drop below the "4H Support" to sweep the "Liquidity Area." This move is designed to trigger stop-losses and trap breakout traders going short.
The Rejection & Reversal: Following the sweep, a rapid buying response is expected, pushing the price violently back above the $4,000 support level. This V-shaped recovery would indicate that smart money has accumulated positions at a discount.
Trendline & Structure Break: The impulsive move upward is projected to break both the descending blue trendline and pierce through the immediate overhead resistance block near $4,300.
Macro Continuation: After a minor pullback or consolidation at the newly broken resistance (turning it into support), the long-term projection points toward a massive bullish continuation, targeting previous structural highs near $5,400.
Conclusion
The XAU/USD 4H chart indicates that while bears are currently in control, the market is approaching an exhaustion point. Traders should watch closely for a drop into the liquidity zone below $4,000 followed by an immediate, high-volume rejection. A successful liquidity sweep followed by a breakout of the descending trendline would invalidate the bearish structure and signal a strong buying opportunity for the next major leg up. Long 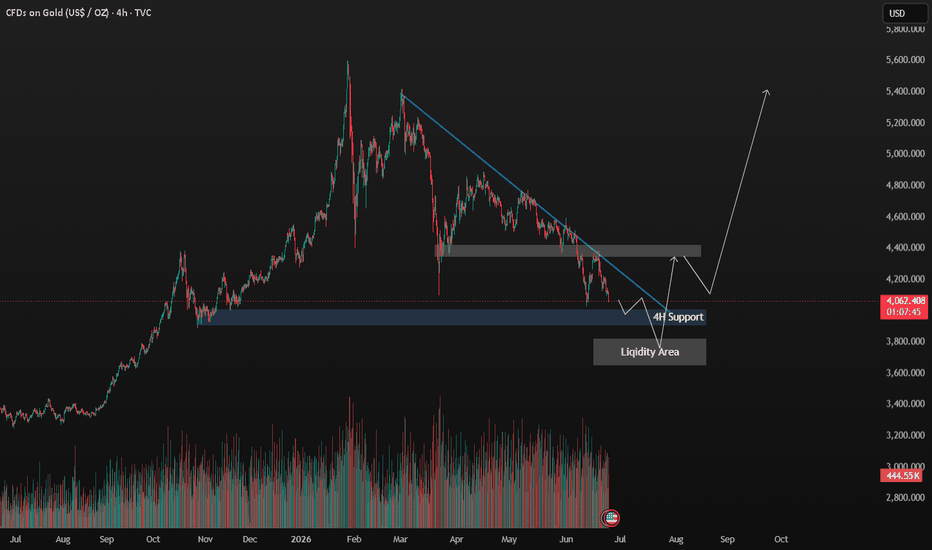
XAUUSD — Bearish Structure Holds Below EMA Resistance
Fundamental Analysis
Gold remains under short-term bearish pressure as price continues to trade below the main EMA structure. Traders are still watching USD momentum, Treasury yields, and upcoming U.S. macro data.
For now, the recovery attempts remain weak while price fails to reclaim the value range above.
Technical Analysis
On the 2H chart, XAUUSD is still trading below EMA 34, EMA 89, and EMA 200. This shows that the bearish structure remains active, with the EMA zone acting as dynamic resistance.
Price recently failed around the value range near 4,200 - 4,220 and then dropped back below short-term support. This rejection confirms that buyers are still not strong enough to reverse the trend.
The key sell reaction zone is around 4,150 - 4,169. This area aligns with the broken short-term structure, Fibonacci reaction level, and the current bearish continuation zone shown on the chart.
If price retests this zone and fails to reclaim it, sellers may continue pushing gold toward the lower Fibonacci and liquidity areas. The next important support is around 4,100, followed by the deeper convergence zone near 4,064 - 4,034.
Important Key Levels
Current price area: 4,139
Sell reaction zone: 4,150 - 4,169
Value range resistance: 4,200 - 4,220
EMA resistance area: 4,201 - 4,241
Short-term support: 4,100 - 4,105
Fibonacci liquidity zone: 4,064 - 4,067
Main bearish target: 4,034
Invalidation area: above 4,201
Trading Scenario
Main Sell Scenario
Entry: 4,150 - 4,169
Stop Loss: 4,201
Take Profit 1: 4,100
Take Profit 2: 4,064
Take Profit 3: 4,034
Sell Condition
The preferred setup is to wait for gold to retest the 4,150 - 4,169 sell reaction zone. This area is important because it aligns with the broken structure and Fibonacci reaction level.
A sell setup becomes more valid if price forms bearish rejection from this zone, such as a long upper wick, bearish engulfing candle, failed breakout, or lower high below the EMA structure.
If price rejects from the sell zone and breaks below 4,100, the bearish continuation view becomes stronger. The next downside focus would be 4,064 - 4,067, followed by the main target around 4,034.
Entry Conditions
Wait for price to retest 4,150 - 4,169.
Look for bearish rejection before entering sell.
A break below 4,100 confirms stronger downside pressure.
If price breaks and holds above 4,201, the sell setup is invalid.
Overall, the main view remains bearish while XAUUSD trades below EMA 34, EMA 89, EMA 200, and the previous value range. The preferred plan is to wait for a retest of 4,150 - 4,169, then look for sell confirmation toward 4,100, 4,064, and 4,034.
Do you share the same bearish view on gold, or are you waiting for a cleaner rejection from the sell reaction zone?
Short 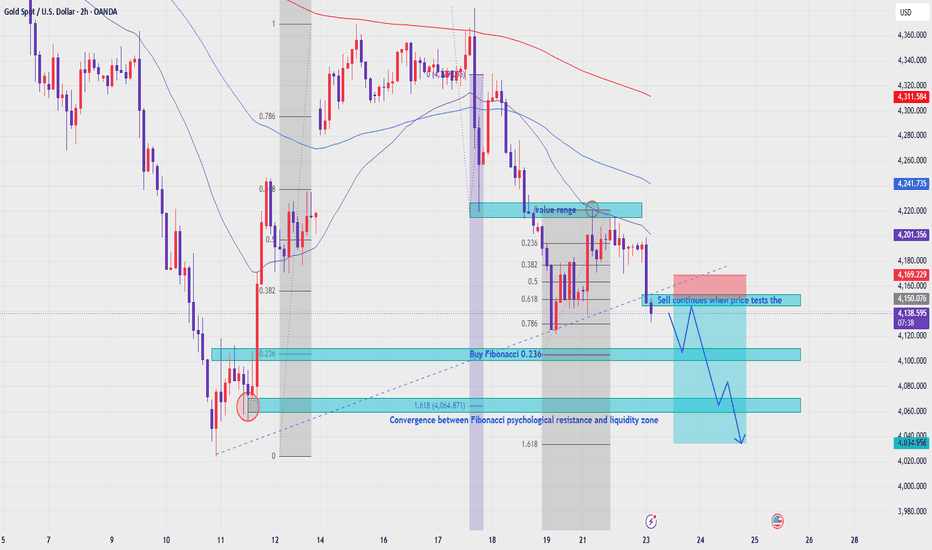
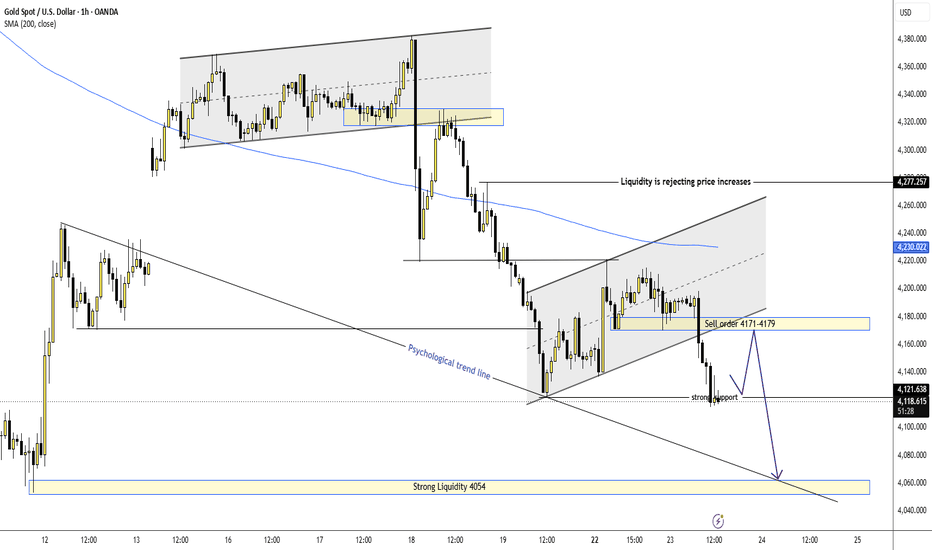
XAUUSD – Hold 4,121 or Break Down to 4,054? XAUUSD – Hold 4,121 or Break Down to 4,054?
Gold is sitting at one of the clearest decision zones on the H1 chart right now.
After failing to build above the recent intraday recovery area, price has dropped back into the 4,121 support zone. This is the kind of level that usually does not stay quiet for long. Buyers either defend it and force a rebound, or a clean breakdown opens the path toward the next strong liquidity area near 4,054.
FUNDAMENTAL ANALYSIS
Gold is still balancing between safe-haven demand and the strength of the U.S. dollar. That keeps the broader tone cautious.
For now, the bigger driver is still technical structure. Price is at a clear decision point, so reaction matters more than prediction. If the support holds, gold can bounce. If it fails, sellers may quickly press lower.
TECHNICAL ANALYSIS – SMC + MARKET STRUCTURE
From a market structure perspective, gold is no longer showing a clean bullish recovery. The recent rally failed to sustain, and price has already started respecting lower highs.
The chart also shows that upside attempts were rejected near liquidity, while the intraday recovery area around 4,171 – 4,179 is now acting as a sell zone. That makes the current support around 4,121 the most important level on the chart.
This is why the setup feels strong and simple.
There are only two key reactions to watch:
* If 4,121 holds, price may bounce back into 4,171 – 4,179 and possibly extend toward the SMA 200 area.
* If 4,121 breaks, the structure becomes much weaker and the next downside draw may open toward 4,054.
That is the story here. One level. Two outcomes. Clear reaction needed.
KEY PRICE ZONES TO WATCH
Current price area: 4,121
Major decision zone / strong support: 4,121
Sell order zone: 4,171 – 4,179
Nearest recovery resistance: 4,179
SMA 200 resistance: 4,230
Liquidity rejection zone: 4,277
Strong liquidity target below: 4,054
Invalidation area for bearish breakdown: Back above 4,179
TRADING SCENARIOS
Buy Scenario – Only If 4,121 Holds
If gold defends 4,121 and prints a clear bullish reaction, I will watch for a rebound setup.
Buy Zone: Around 4,121
Entry Condition: Bullish rejection, liquidity sweep below support, or lower-timeframe bullish CHoCH.
Stop Loss: Below the recent sweep low or below the support invalidation.
Take Profit:
TP1: 4,171 – 4,179
TP2: 4,230
Sell Scenario – Priority If Breakdown Confirms
If gold breaks below 4,121 and confirms weakness, I will watch for bearish continuation toward the lower liquidity area.
Sell Zone: Below 4,121 after confirmation
Entry Condition: Clean breakdown, bearish retest, or strong bearish displacement below support.
Stop Loss: Above the broken level or above the nearest swing high.
Take Profit:
TP1: 4,054
TP2: Lower extension only if bearish momentum expands.
Alternative Sell Scenario
If gold bounces first into 4,171 – 4,179 and shows rejection, that area may offer a cleaner sell reaction.
Sell Condition: Bearish rejection, failed reclaim, or lower-timeframe bearish CHoCH from the sell zone.
Target: 4,121 then 4,054
MY VIEW ON GOLD
This is a high-attention chart because the market is sitting right on a major decision zone.
I do not want the middle of the move here. I only want the reaction.
As long as gold stays pressed against 4,121, this level remains the key. If buyers defend it, a rebound into 4,171 – 4,179 is possible. But if support gives way, the chart becomes much heavier and 4,054 starts to look like the next real draw.
For me, this is not a chart to overcomplicate. It is a chart to watch closely.
Do you think 4,121 will hold and trigger a rebound, or is 4,054 the next stop for gold?
Short