SPCX Elliott Wave AnalysisDouble Zigzag Completed or One More Leg Down Before Wave 3?
SPCX is a newly listed Nasdaq stock with a limited price history, making its wave structure much easier to monitor than older, more complex charts. Since there isn't enough historical data to rely on long-term market cycles, Elliott Wave analysis and price action currently provide one of the clearest frameworks for evaluating the next major move.
As always, this analysis presents probabilities rather than certainties. The market will ultimately decide which scenario becomes valid.
This idea was shared previously, and so far the primary wave count remains intact.
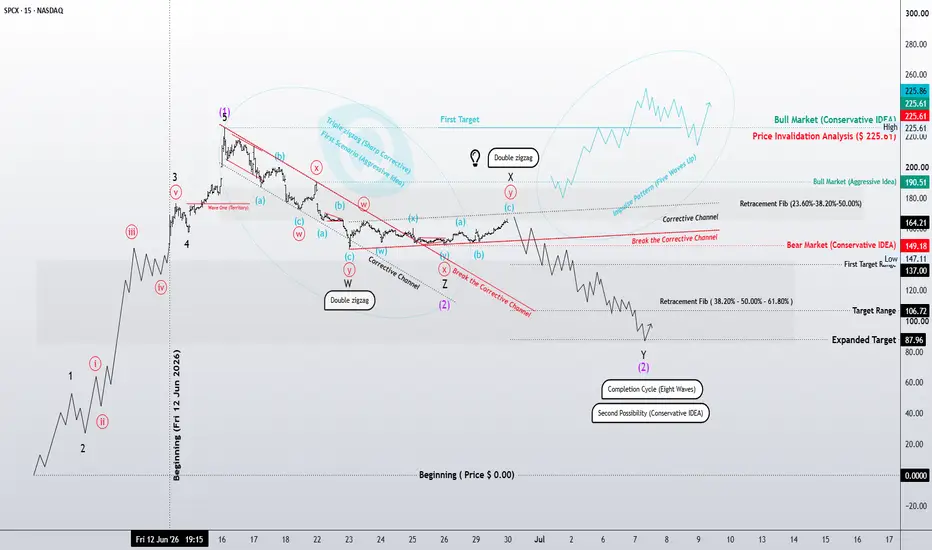
After printing a high at $225.61, price entered a corrective phase. My primary count labels the decline as a Double Zigzag (W-X-Y) consisting of seven swings. The current recovery also appears to be developing as another corrective structure from the Zigzag family, with the potential to evolve into a Triple Zigzag if additional complexity is required.
Should this scenario play out, I expect one more decline after the current correction completes, allowing price to finish a larger corrective sequence and complete the overall eight-wave cycle shown on the chart. The highlighted support zones represent the most likely areas where this correction could terminate.
However, there is another scenario that deserves equal attention.
The entire decline may have already completed as a Triple Zigzag, meaning the market could now be building a series of nested 1-2, 1-2, and 1-2 structures across multiple degrees. If that interpretation proves correct, a confirmed breakout above $225.61, followed by a healthy pullback, would significantly increase the probability that SPCX is entering a higher-degree Wave (3)—typically the strongest and most impulsive phase of an Elliott Wave cycle.
For now, both scenarios remain valid.
The key confirmation level is $225.61. A decisive break above this high would strongly favor the bullish count, while rejection below it would keep the larger corrective structure in play.
As always, let the market confirm the wave count—not the other way around.
Key Levels
🔹 Bullish Confirmation: Above $225.61
🔹 Current Bias: Neutral until confirmation
🔹 Primary Structure: Double Zigzag
🔹 Alternate Structure: Triple Zigzag → Nested 1-2 setup
🔹 Focus: Watch the corrective channel and market reaction around key resistance.
Patterns whisper. I listen.
— Mr. Nobody 🎧📊
Space Exploration Technologies Corp.
3 days ago
SpaceX: Impulsive Breakout or Structural Correction?
 Short
Short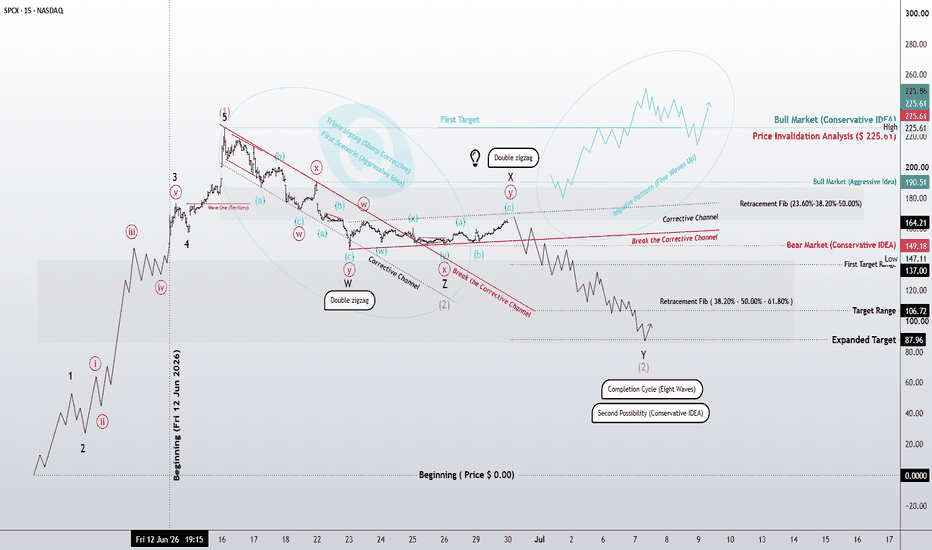
GOLD - The Hunt for Liquidity Before the Crash ICMARKETS:XAUUSD remains under pressure. The key events to watch this week are the Qatar negotiations, new Fed Chair Kevin Warsh's speech at the ECB Forum in Sintra, and the U.S. Non-Farm Payrolls (NFP) report. Any rebound is likely to be viewed as a selling opportunity
Gold starts the week with a bearish bias after posting its fourth consecutive weekly decline and ending a two-day recovery from seven-month lows.
The market remains under pressure from a combination of factors: the Fed's hawkish shift (with nearly a 90% probability of a December rate hike and expectations for two hikes by year-end), a stronger U.S. dollar trading near yearly highs, and record outflows from gold ETFs. The U.S. Dollar Index continues to trade in a strong bullish trend, adding further pressure to gold prices.
Technically, the market is currently developing a corrective phase aimed at hunting liquidity. Key areas of interest are 4090 and 4198.
Resistance levels: 4090, 4121, 4198
Support levels: 3983, 3964, 3920
A short squeeze into the 4090–4121 zone could trigger another leg lower toward 3900–3800. However, a more aggressive countertrend rally toward the 4198 liquidity zone cannot be ruled out before the broader bearish trend resumes
Best regards,
R. Linda  Short
Short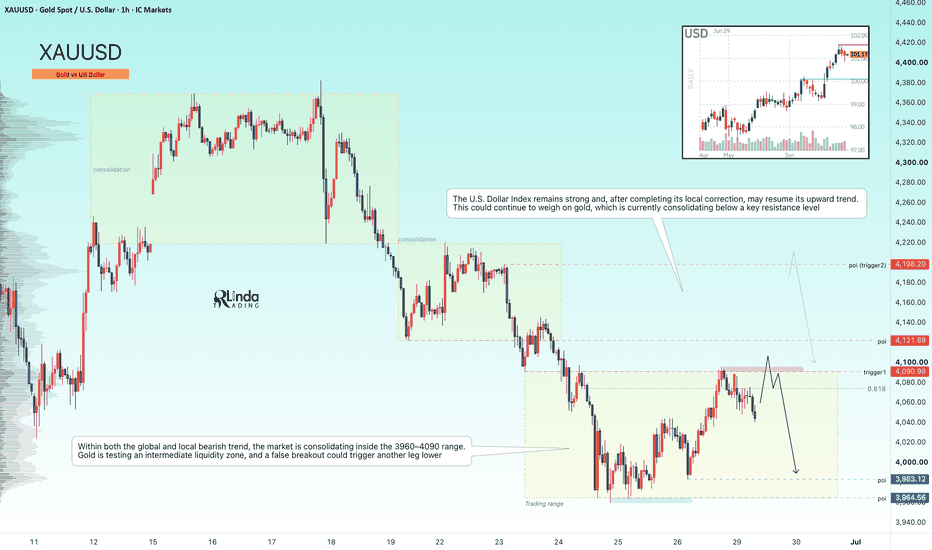
SOLUSDT - Countertrend correction. Waiting for a short squeezeBINANCE:SOLUSDT is developing a countertrend rally against the backdrop of a broader bearish market and a local range, while Bitcoin continues to test a key support zone
Bitcoin remains under heavy pressure from a combination of factors: the Fed's hawkish stance, record institutional outflows, the expiration of $10.6 billion in options, the fading geopolitical risk premium following the U.S.–Iran peace agreement, and capital rotation into AI-related stocks. At the moment, the market lacks meaningful fundamental support, and the medium-term outlook remains bearish
In contrast, Solana is showing relative strength despite Bitcoin's weakness, rebounding by 6–10% on the back of strong interest in tokenized equity trading and increased futures speculation ahead of a potential airdrop
Resistance levels: 74.66, 76.06, 76.63
Support levels: 68.07, 65.86, 64.66
As part of the current countertrend move, Solana is developing an aggressive corrective rally. Technically, this advance may be aimed at building liquidity. Market makers may extend the move toward the 74.66–76.63 area of interest, where a short squeeze could develop before the market resumes its decline toward 68.0–64.6
Best regards,
R. Linda  Short
Short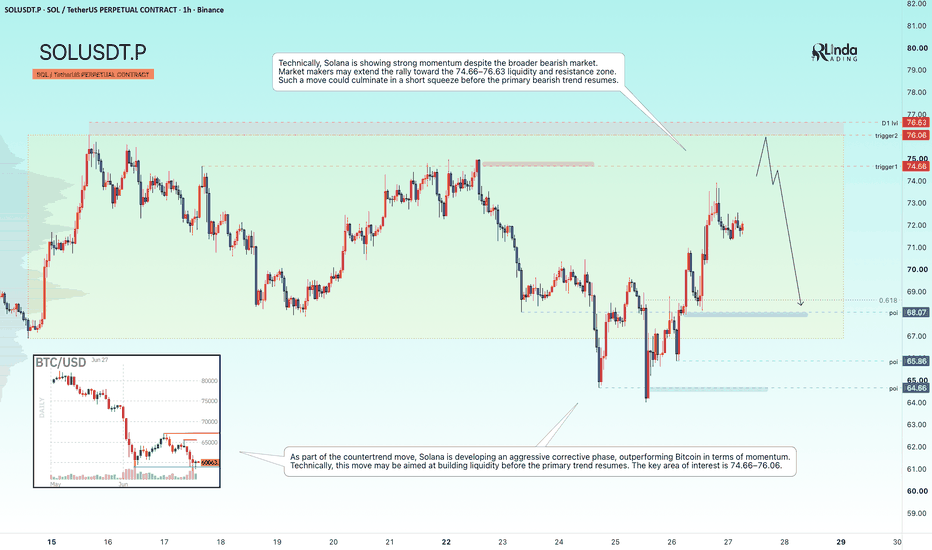
GOLD - Countertrend correction to the liquidity zoneFX:XAUUSD appears to be forming a local bottom and may enter a countertrend correction to build liquidity. However, the broader outlook remains negative, driven by a weak fundamental backdrop, a strong U.S. dollar, and the prevailing bearish trend
Gold remains vulnerable. The technical picture, combined with uncertainty surrounding the security of shipping through the Strait of Hormuz, continues to weigh on prices. In addition, doubts over the durability of the U.S.–Iran peace agreement are keeping buyers on the sidelines.
Technically, the market has printed a new low at 3960, confirming the broader bearish structure that aligns with the global market trend. A corrective move toward 4090–4121 is expected before the downtrend potentially resumes
Resistance levels: 4090, 4121, 4198
Support levels: 3983, 3964, 3915
As part of the countertrend correction, gold may test the 4090–4121 liquidity pool. A short squeeze in this area could trigger another decline toward 3983–3964. However, a deeper correction toward the key liquidity zone at 4198–4200 cannot be ruled out, where another bearish reversal may develop
Best regards,
R. Linda Short 
BITCOIN - Consolidation (correction) before the fallBINANCE:BTCUSDT.P remains under pressure. There is no meaningful fundamental support for the market, while the broader bearish trend continues to define the medium-term direction. There are still no clear signs of a market bottom forming
Globally, Bitcoin continues to maintain a bearish trend. Within this trend, the market remains in a consolidation phase with no indications of a reversal. Technically, the downtrend may continue in the medium term.
Fundamentally, the outlook remains weak. Cryptocurrency inflows to exchanges continue, while spot ETF outflows persist. Any attempts to rally are increasingly viewed as potential traps before another leg lower. A retest of 59800 followed by a close below this level would be a strong signal that the market is preparing to move toward 50K
Resistance levels: 63220, 63750
Support levels: 62230, 60750, 59800
Following the distribution phase and the long squeeze below the 62232 support level, a countertrend correction is developing, aimed at hunting liquidity. As part of this correction, Bitcoin may test the 63220–63750 area before resuming its decline. A short squeeze in this zone could trigger a further move lower toward 60800–59800
Best regards,
R. Linda  Short
Short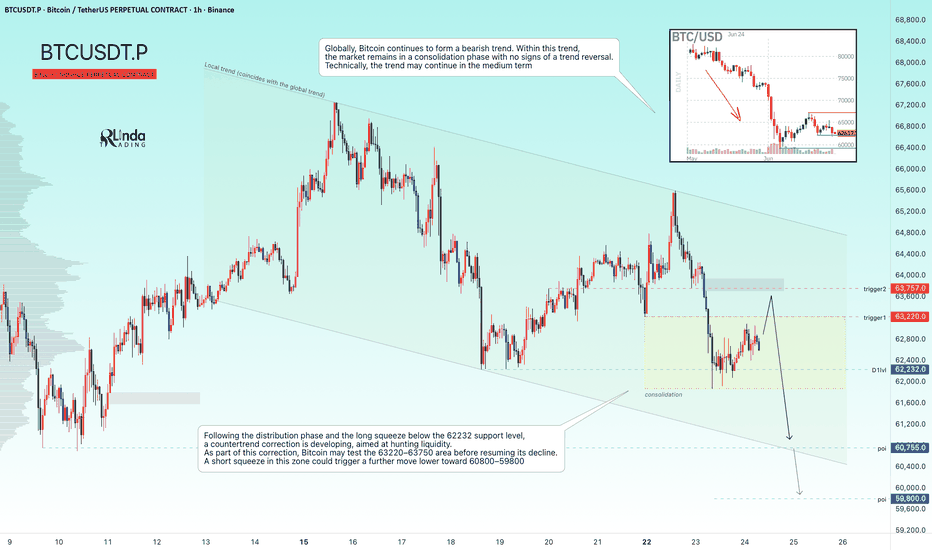
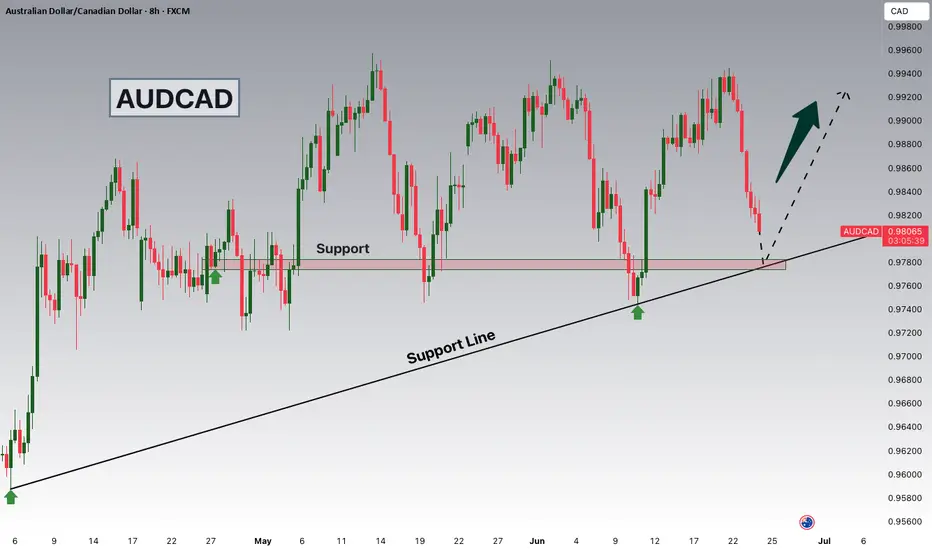
AUDCAD Buy at 0.97700 as Hot Australian CPI Fuels Bulls!Hey Traders,
In today's trading session, we are monitoring AUDCAD for a buying opportunity around the 0.97700 zone. AUDCAD is trading in a strong uptrend and is currently in a correction phase, with price approaching the 0.97700 support and resistance area, a key zone that could provide an attractive opportunity for bullish continuation.
From a fundamental perspective, the Australian Dollar received fresh support after Australia's latest Trimmed Mean CPI accelerated to 3.6%, signaling that underlying inflation pressures remain persistent. The stronger inflation reading has reduced expectations for aggressive policy easing and has strengthened the case for relatively higher interest rates in Australia.
Looking ahead, attention now turns to upcoming Australian economic data. If tonight's releases continue to show resilience in the economy and labor market, markets may further scale back easing expectations, providing an additional boost to the Australian Dollar.
On the other side of the pair, the Canadian Dollar remains vulnerable to fluctuations in global growth sentiment and commodity markets, creating a favorable backdrop for AUD outperformance should Australian data continue surprising to the upside.
With price correcting into the 0.97700 support zone within a broader bullish structure, the current pullback may offer an attractive opportunity for buyers to position in line with the prevailing trend.
As long as price remains above the 0.97700 support zone, the bullish structure remains intact, and we anticipate continuation toward higher resistance levels.
Trade safe,
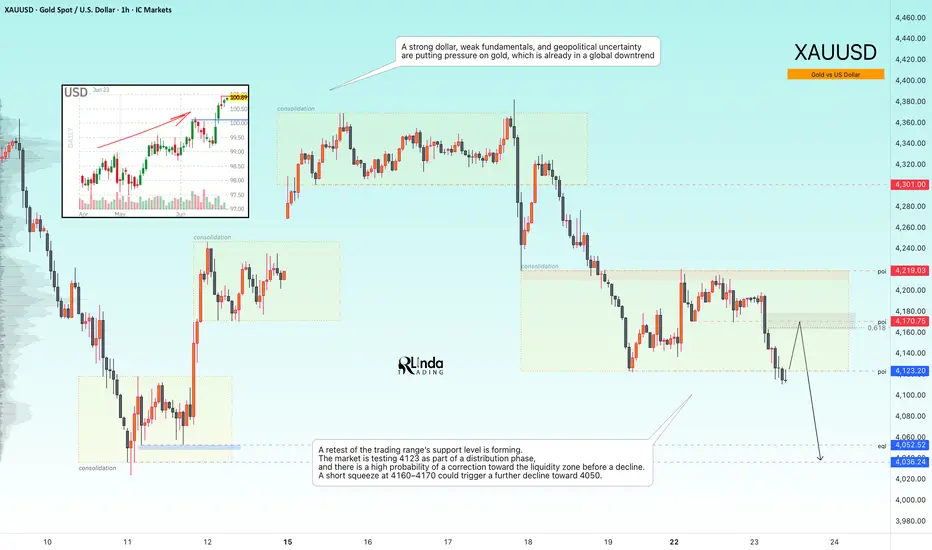
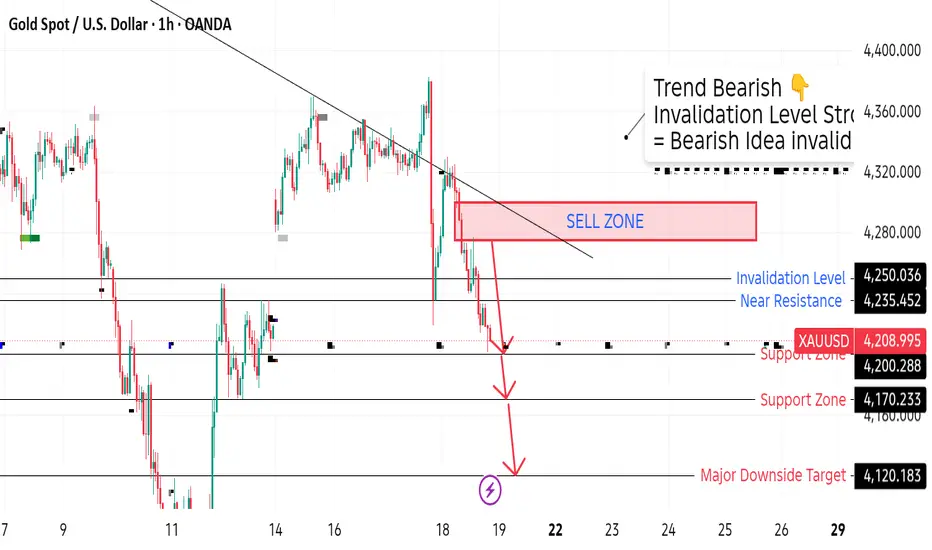
Joe GOLD - A correction before the decline continues toward 4000ICMARKETS:XAUUSD continues to decline and print new lows under pressure from three key factors: a strong U.S. dollar, a weak fundamental backdrop, and ongoing geopolitical uncertainty. In the medium term, the market may remain under bearish control.
Sellers continue to dominate. The dollar remains strong, while expectations of a Federal Reserve rate hike continue to pressure gold as a non-yielding asset. Any rebound is likely to be viewed as an opportunity for fresh selling. Key catalysts ahead include PMI data releases and developments in the Middle East.
Drivers:
Downside: a stronger dollar, hawkish Fed expectations, persistent geopolitical uncertainty, and strong PMI data.
Upside: progress in negotiations, a dovish Fed signal, weak PMI data, and profit-taking on long dollar positions.
Resistance levels: 4170, 4210
Support levels: 4123, 4050
A retest of the trading range support is developing. The market is testing 4123 within the current distribution phase, and there is a high probability of a corrective move toward the liquidity zone before another decline. A short squeeze into the 4160–4170 area could trigger a further move lower toward 4050.
Best regards,
R. Linda Short 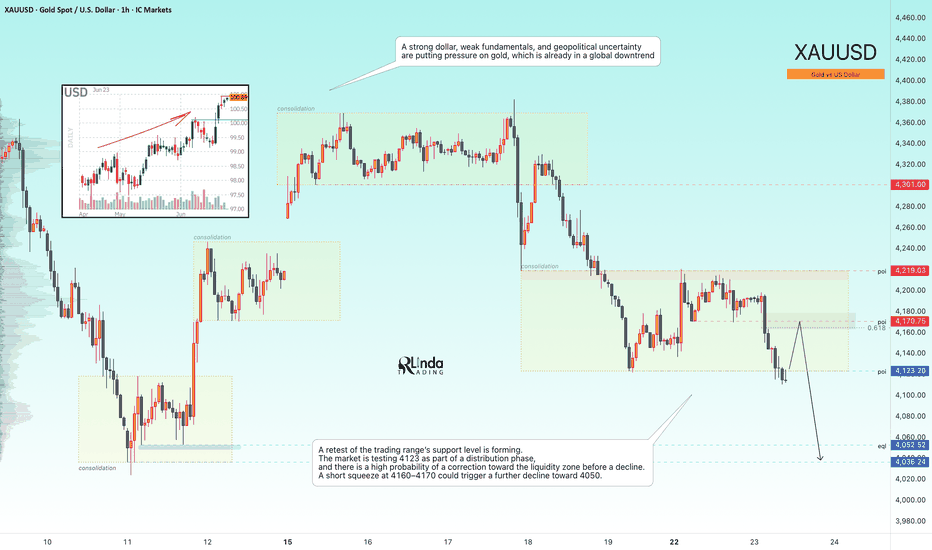
Short 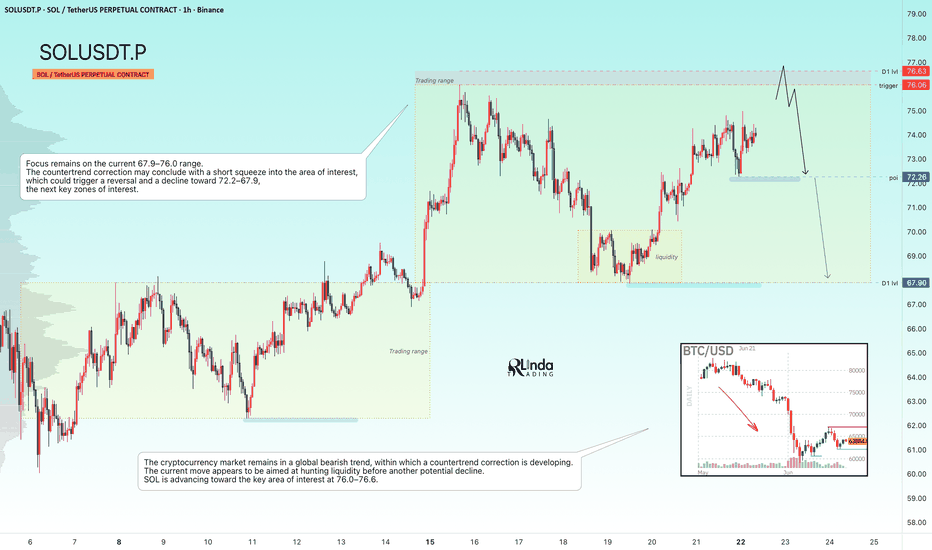
Short 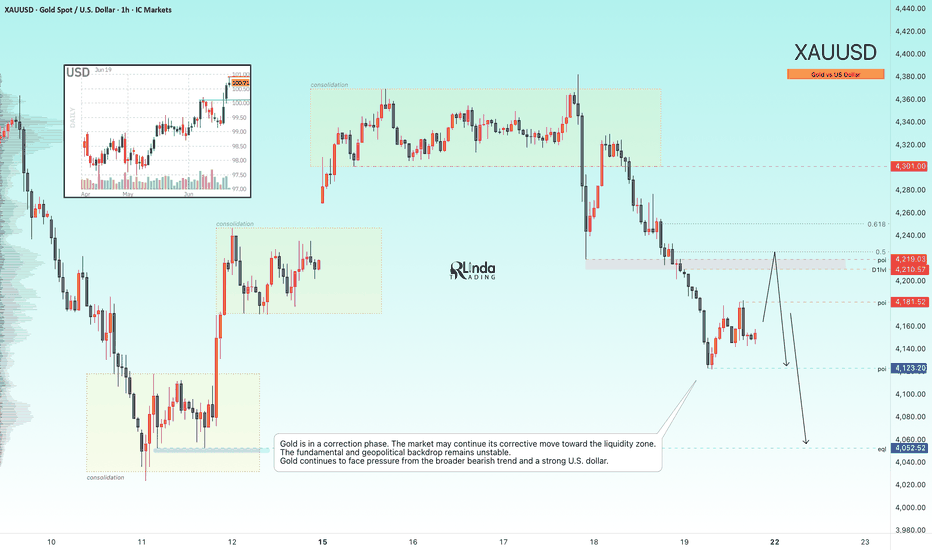
EURJPY Breakout as USDJPY Nears Intervention Zone!Hey Traders,
In today's trading session, we are monitoring EURJPY for a potential selling opportunity around the 186.000 zone. EURJPY was previously trading in an uptrend but has successfully broken market structure and is now in a correction phase, with price approaching the 186.000 retrace area, a key resistance zone that could provide an attractive opportunity for bearish continuation.
From a macro perspective, one of the most important themes in the FX market right now is the growing risk of Japanese intervention.
As USDJPY continues to trade near historically sensitive levels, market participants remain alert to the possibility of action from the Japanese Ministry of Finance or the Bank of Japan. While intervention is never guaranteed, the closer USDJPY moves toward extreme levels, the greater the likelihood of verbal warnings or direct intervention aimed at supporting the Yen.
This matters significantly for EURJPY.
If Japanese authorities decide to intervene, the impact is unlikely to remain isolated to USDJPY. Historically, intervention has triggered broad Yen strength across the market, placing heavy downside pressure on Yen crosses such as EURJPY, GBPJPY, AUDJPY, and CADJPY. In many cases, these moves have been fast and aggressive as traders rush to reduce exposure.
With EURJPY now correcting into the 186.000 resistance zone after breaking its bullish structure, the combination of technical resistance and rising intervention risk creates an attractive environment for sellers.
As long as price remains below the 186.000 resistance zone, the bearish structure remains intact, and we anticipate continuation toward lower support levels.
Trade safe,
Joe
Short 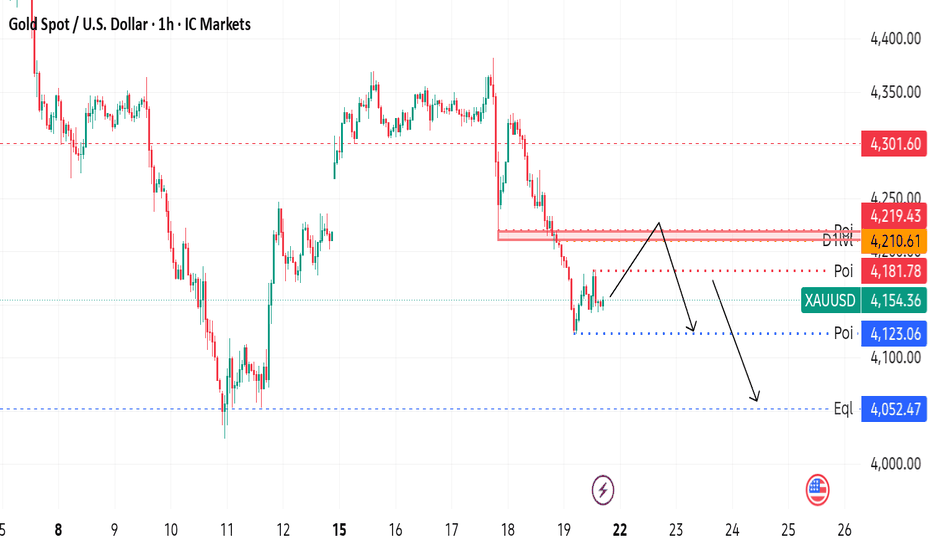
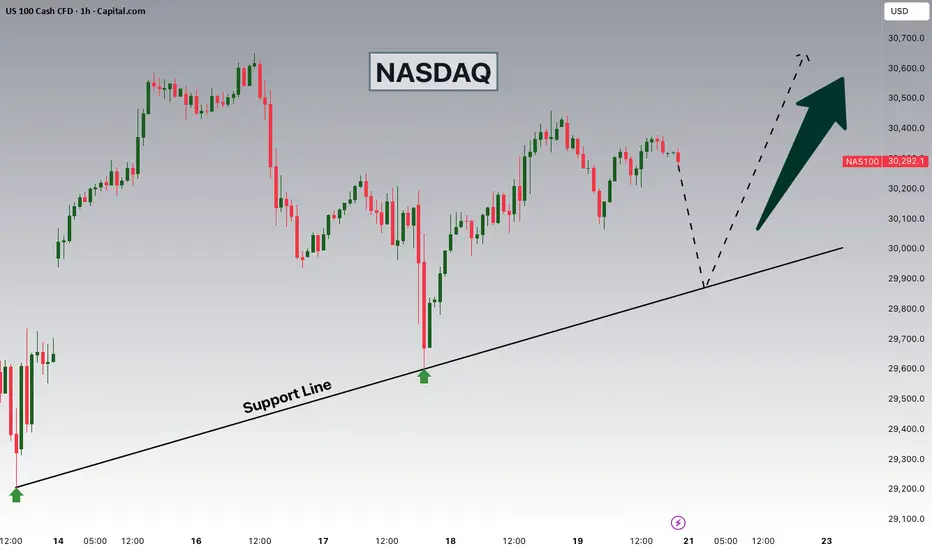
NAS100 Buy Setup at 29,900 | Why This Month Favors NASDAQ Bulls?Hey Traders,
In today's trading session, we are monitoring NASDAQ (NAS100) for a potential buying opportunity around the 29,900 zone. NAS100 remains in a strong uptrend and is currently undergoing a healthy correction, with price approaching the 29,900 support and resistance area, which aligns with a key trendline support zone.
From a technical perspective, the broader bullish structure remains intact, and the current pullback appears to be a retracement within the prevailing uptrend rather than a change in trend.
From a fundamental and seasonal perspective, this setup becomes even more interesting. Historically, this period of the year tends to be favorable for U.S. equities, with the Nasdaq often benefiting from strong seasonal flows, improving market liquidity, and continued institutional positioning into growth and technology stocks.
With price approaching the 29,900 support zone within a well-established bullish trend, the current correction may offer an attractive opportunity for trend-following buyers.
As long as price holds above the 29,900 support area, the bullish structure remains intact, and we anticipate continuation toward higher resistance levels.
Trade safe, Joe.  Long
Long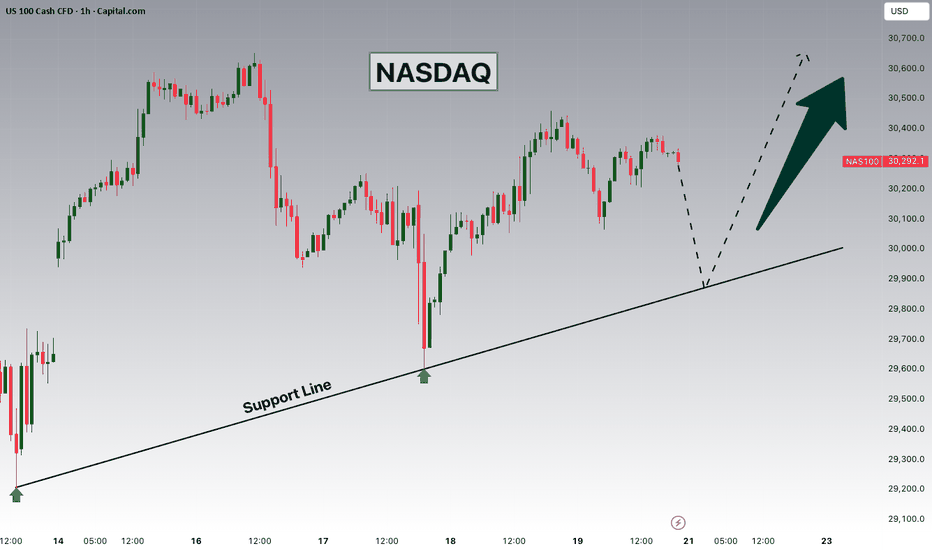
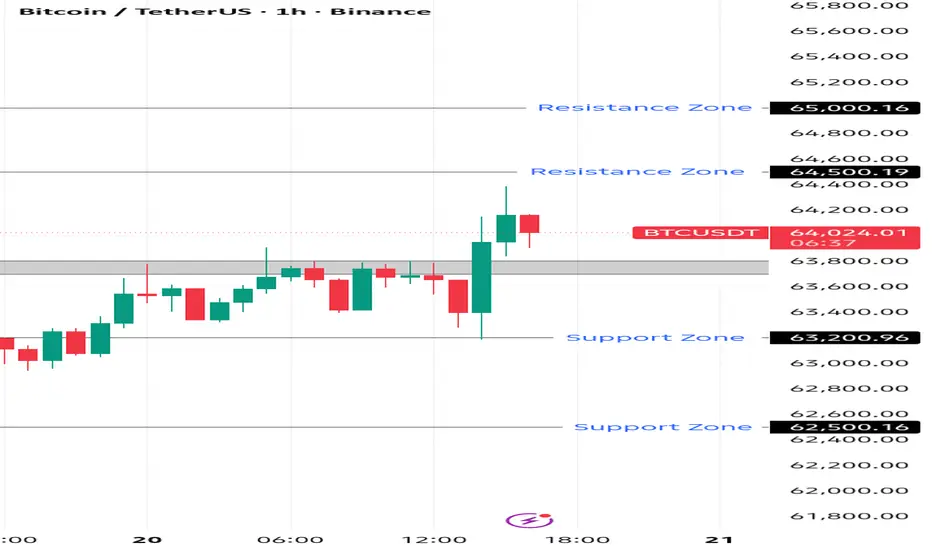
BTCUSDT Analysis (1H Timeframe)📈 Short-Term Bias: Bullish Recovery 📊 Overall Structure: Still Range / Neutral
What I see on the chart:
BTC bounced strongly from the 62,300–62,500 demand zone.
Price has reclaimed 64,000, which is a positive sign for buyers.
The recent candles are forming higher lows, suggesting bullish momentum is building.
However, BTC is still below the major resistance area around 65,000–66,000.
Key Levels
🟢 Support:
63,700 – 63,800
63,200
62,500
🔴 Resistance:
64,500
65,000
66,000
Trading Idea
🚀 BTCUSDT BUY SETUP
Entry Zone: 63,800 – 64,000 Stop Loss: 63,300
🎯 TP1: 64,500 🎯 TP2: 65,000 🎯 TP3: 65,800
Alternative Sell Setup
If price gets rejected around 64,500–65,000 and forms bearish candles:
📉 Sell
Entry: 64,500 – 64,800
SL: 65,200
TP: 63,800 → 63,200
Market Outlook
✅ Above 63,700, buyers have the advantage. ✅ A breakout above 64,500 could open the door toward 65,000–66,000.
For now, the chart looks more bullish than bearish on the 1H timeframe, but confirmation comes only if BTC breaks and holds above 64,500. GOLD - A hunt for liquidity ahead of a drop to 4,400 ICMARKETS:XAUUSD has found itself in a difficult position: the Federal Reserve's hawkish stance and a strong U.S. dollar continue to weigh on the metal. Following the latest advance in the dollar, price has entered a liquidity-hunting phase
On June 17, the first FOMC meeting under new Fed Chair Kevin Warsh took place. The Committee unanimously kept interest rates unchanged within the 3.50%–3.75% range. However, the market is still pricing in one full rate hike this year, and the Fed's hawkish outlook continues to support an already bullish U.S. Dollar Index, creating additional pressure on gold.
Gold is currently trapped between three major forces: the Fed's hawkish pivot, the cancellation of negotiations in Geneva, and the technical breakdown of key support levels.
Technically, the market is forming a countertrend correction toward key liquidity zones before a potential continuation of the broader decline
Resistance levels: 4171, 4200, 4219
Support levels: 4123, 4052, 4000
Following another sharp decline, gold has stabilized around the local support level at 4123. The market may develop a corrective move aimed at sweeping liquidity before the next leg lower. The primary area of interest remains 4200–4220. A short squeeze within this zone could trigger another decline toward 4120–4050
Best regards,
R. Linda Short 
Short 
Short 
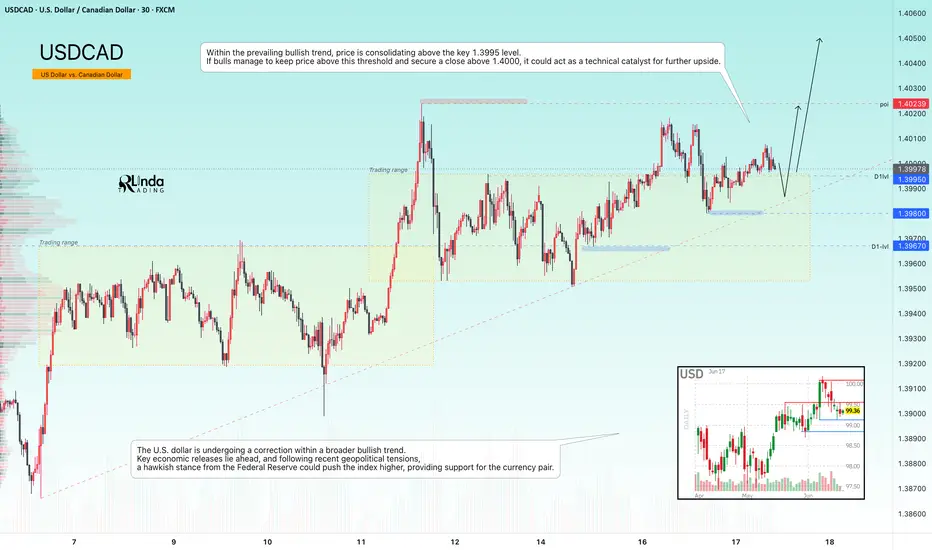
USDCAD - Retest of 1.40. Markets are awaiting the Fed's decisionFX:USDCAD maintains a strong bullish trend and is testing the 1.4000 resistance level while attempting to hold above this key threshold. The Federal Reserve meeting is now in focus
USDCAD has entered a consolidation phase ahead of major news events, with the primary focus on the Fed's interest rate decision and comments from the new Fed Chair
The U.S. dollar is currently correcting within a broader bullish trend. With key economic releases approaching and geopolitical tensions still in the background, a hawkish stance from the Federal Reserve could push the Dollar Index higher, providing additional support for the currency pair.
Resistance levels: 1.4000, 1.4024, 1.4100
Support levels: 1.3995, 1.3980, 1.3967
Within the prevailing bullish trend, price is consolidating above the key 1.3995 level. If bulls manage to defend this area and secure a close above 1.4000, it could become a technical catalyst for further upside
Best regards,
R. Linda GOLD - Consolidation before growth. Positive background?ICMARKETS:XAUUSD is holding above $4,300 on Tuesday after pulling back from the six-day high of $4,369 reached during the previous U.S. trading session. The three-day rally has given way to consolidation, leaving room for further gains
Gold is currently in a phase of strong technical recovery, driven by a combination of geopolitical optimism and a reassessment of inflation risks. The market is entering the upcoming Federal Reserve meeting in a much more balanced position than it was immediately after the jobs report.
The market is awaiting two key events: the June 16–17 Federal Reserve meeting (including the updated dot plot and Chair Warsh’s press conference) and the official signing ceremony of the peace agreement in Geneva on June 19.
If the Fed’s dot plot proves less hawkish than the market expects and Friday’s signing ceremony confirms progress, gold could test 4426–4476 and continue higher. However, if Warsh confirms a high probability of further rate hikes in the second half of the year and the details of the agreement disappoint, gold may enter a corrective phase
Resistance levels: 4363, 4426, 4476
Support levels: 4306, 4268, 4246
A false breakout of 4363 is triggering a correction (the reaction remains weak), while gold continues to consolidate above the key support zone at 4300–4310. Fundamentally, the local backdrop is improving and providing support to the market. A rebound from the 4300 area could lead to a move toward 4426–4476
Best regards,
R. Linda Long 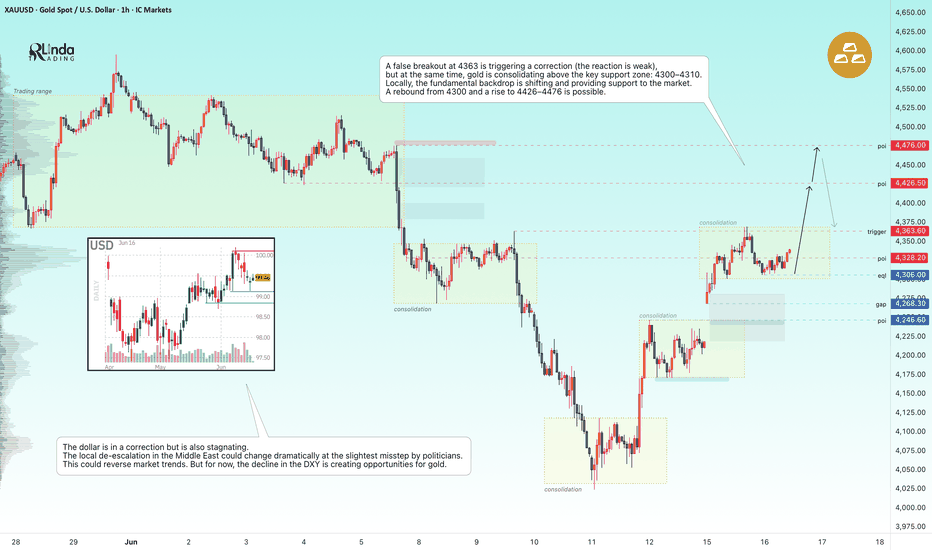
HYPEUSDT - Ready for the trend to continue BINANCE:HYPEUSDT.P continues to maintain its overall bullish trend and appears poised to resume its upward movement following the recent correction. Despite weakness in Bitcoin, the altcoin remains resilient and has a strong chance of retesting its all-time high.
After a period of consolidation during the corrective phase, the market is transitioning back into a rally phase and looks poised to continue higher. The coin continues to demonstrate notable relative strength, and in the medium term, it may challenge its all-time high. The broader weakness across the cryptocurrency market has had limited impact on HYPE, aside from the wave of negative news in early June that triggered panic and capital outflows.
The fundamental outlook for HYPE continues to improve, giving traders an opportunity to target the 70.0–75.0 range.
Resistance levels: 65.80, 70.0, 72.4
Support levels: 64.0, 62.40
Technically, the price remains in a bullish cycle. The key trigger is 65.800—a close above this level could open the door for the rally to continue.
Best regards, R. Linda  Long
Long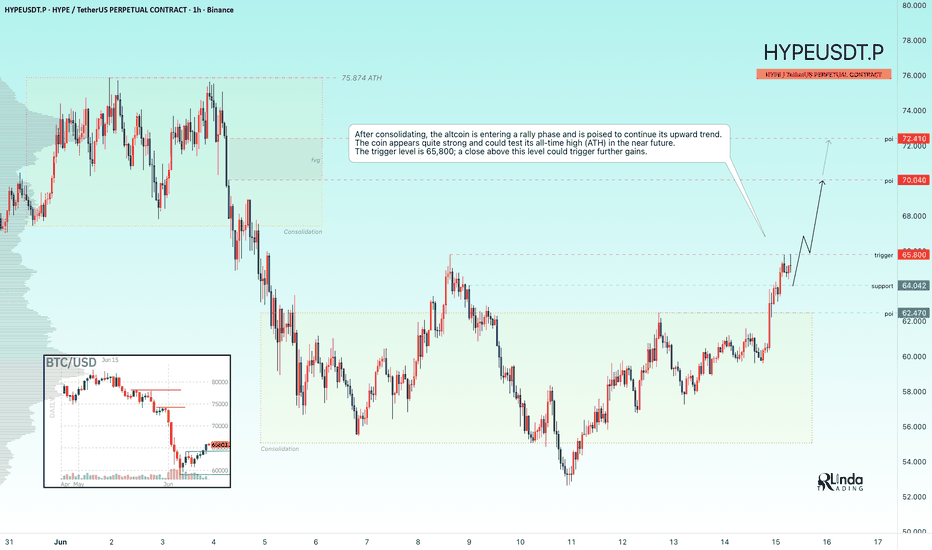
GOLD - Countertrend correction may continueICMARKETS:XAUUSD continues its correction amid a temporary pullback in the U.S. Dollar Index. Technically, this remains a countertrend move. All eyes are now on geopolitical developments and the upcoming Federal Reserve rate decision
Gold is caught between geopolitical support and intense macroeconomic pressure, compounded by the technical break below the 200-day SMA. Wall Street analysts continue to maintain a predominantly bearish outlook.
The U.S. dollar is currently correcting after a false breakout above the 100.0 level. Technically, however, the index remains in a bullish trend, which continues to weigh on gold amid ongoing geopolitical uncertainty.
Against the backdrop of both local and global bearish trends, the market is developing a countertrend corrective phase. The focus remains on the 4246–4170 range. Fundamentally, gold lacks strong support, although a local bullish reaction is currently visible. The market is targeting the 4325–4368 liquidity zone before a potential continuation lower
Resistance levels: 4246, 4315, 4347
Support levels: 4170, 4100, 4057
I expect the local bullish impulse to continue. Before extending higher, gold may retest the 4180–4170 area. A long squeeze could trigger an advance toward 4315–4347. However, a short squeeze around the resistance zone could increase selling pressure and lead to a decline toward 4170–4100.
Best regards,
R. Linda Short 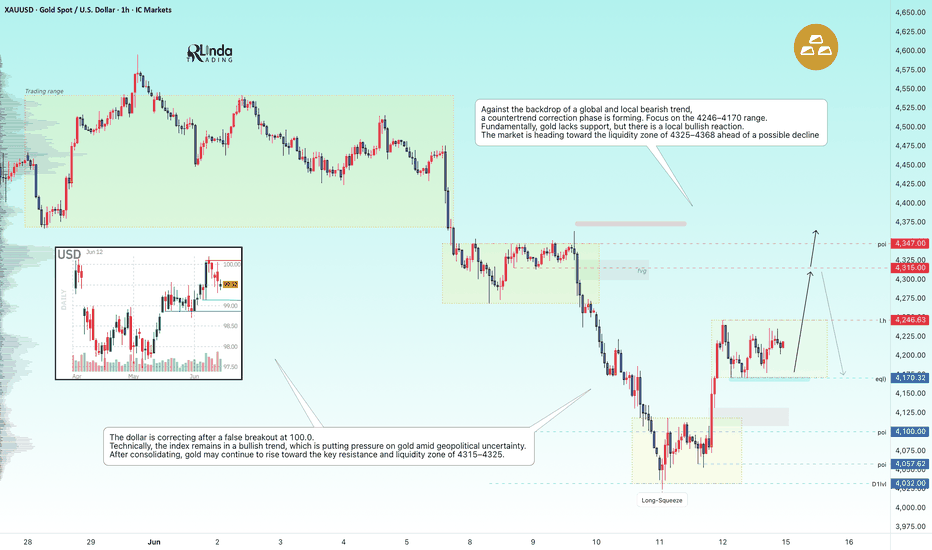
GBPUSD Bearish After Strong US Inflation Data!Hey Traders,
In today's trading session, we are monitoring GBPUSD for a potential selling opportunity around the 1.34500 zone. GBPUSD is trading in a broader downtrend and is currently in a corrective phase, with price approaching the 1.34500 resistance area, a key support-turned-resistance zone that could provide an attractive opportunity for bearish continuation.
From a fundamental perspective, the U.S. Dollar remains well supported following the latest hotter-than-expected CPI release, which reinforced expectations that the Federal Reserve may need to keep interest rates higher for longer. As a result, Treasury yields have remained elevated, providing additional support for the greenback.
Meanwhile, Sterling is struggling to keep pace with the dollar as markets continue to favor currencies backed by stronger yield expectations. The growing policy divergence between the Federal Reserve and other major central banks continues to support USD demand, creating a challenging environment for GBPUSD.
With price now correcting into the 1.34500 resistance zone within a broader bearish structure, rallies continue to look attractive for sellers.
As long as price remains below the 1.34500 resistance zone, the bearish structure remains intact, and we anticipate continuation toward lower support levels.
Trade safe, Joe
GOLD - Countertrend correction to the liquidity zoneFollowing the false breakout below the 4030 support level, ICMARKETS:XAUUSD is rebounding higher, with recent shifts in the geopolitical backdrop adding fuel to the move. However, the market remains bearish overall.
Optimism sparked by Trump's decision to cancel major strikes against Iran and renewed hopes for a deal has been replaced by fresh clashes in the Strait of Hormuz. Geopolitical instability remains elevated. Against this backdrop, the U.S. Dollar Index continues to hold firm, putting pressure on gold. Hotter-than-expected U.S. inflation data has reinforced expectations of a 0.25% Fed rate hike in December. Sellers are therefore likely to remain in control.
Key catalysts ahead include consumer sentiment and inflation expectations data on Friday, as well as the first Federal Reserve meeting under the new Chair, Kevin Warsh, next week. Geopolitics will continue to play a decisive role
Resistance levels: 4246 – 4315 – 4368
Support levels: 4171, 4100, 4060
The market is reacting to the false breakdown of support, resulting in a countertrend correction. Gold is moving toward a key liquidity zone, with the main area of interest located between 4315 and 4368.
A short squeeze within this zone would confirm a liquidity-driven manipulation and could trigger a reversal, leading to a move lower toward the next key areas of interest.
Best regards,
R. Linda Short