Индикатор

Индикатор

Индикатор

Индикатор

Индикатор

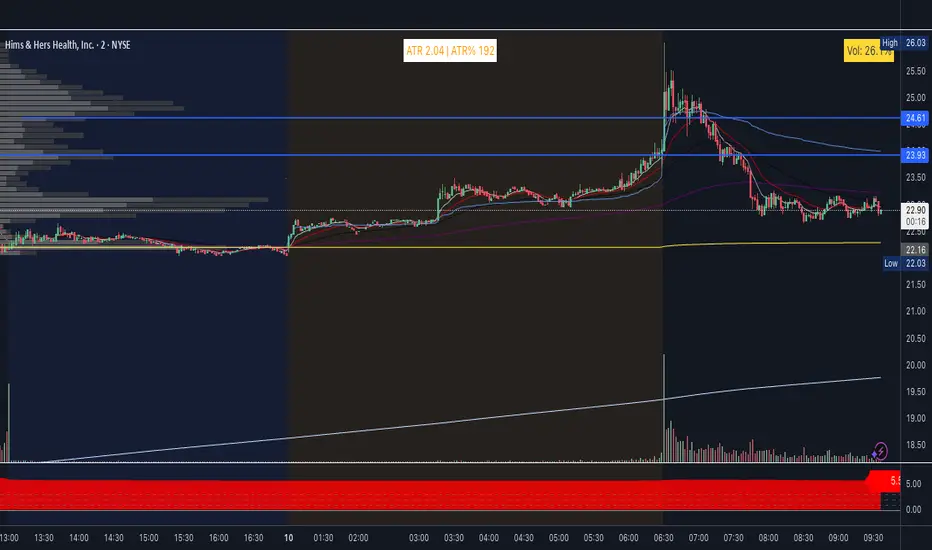
ATR Regime Filter Pro
What this indicator does
-This indicator solves one of the most common and most costly problems in systematic and discretionary trading: entering the market at the wrong time — not because the setup was bad, but because the market's volatility environment was incompatible with the strategy being traded.
-ATR Regime Filter Pro combines two independent, orthogonal filters — a normalised volatility regime classifier and a higher-timeframe EMA slope detector — into a single, real-time dashboard. The output is a clear, three-state market permission signal: Trade, Stay Out, or warning of Extreme conditions.
How it works — the normalised ATR ratio
-The raw Average True Range (ATR) on its own is useful within a single instrument but breaks down the moment you try to compare conditions across assets or even across time on the same asset. A EURUSD ATR of 0.0060 means something completely different in a period of forex calm than in a high-impact macro week.
-To fix this, the indicator normalises the ATR by dividing it by its own Simple Moving Average:
ATR Ratio = ATR(n) / SMA(ATR(n), m)
The result is a dimensionless ratio centred at 1.0 regardless of the asset, timeframe, or price level. A ratio of 1.0 means the current ATR exactly matches its recent average. A ratio of 0.70 means volatility is 30 % below average. A ratio of 2.10 means volatility is 110 % above average.
-Three regimes are classified from this ratio:
1. Dead zone (below the lower threshold, default 0.80)
Volatility is significantly compressed. Spreads and commissions consume a disproportionate share of any move. Mean-reversion traps are common. Breakout signals have a statistically higher failure rate in this environment because price can oscillate within the dead zone for extended periods before any directional resolution occurs. The ATR ratio line turns red, and the pane background turns red. The matrix shows "No Trade."
2. Healthy zone (between the two thresholds)
Volatility is within a normal range relative to recent history. Price moves are large enough to justify risk-reward ratios but not so large that position sizing becomes hazardous. This is the window where most systematic strategies were backtested and are expected to perform. The ATR ratio line turns green. The matrix shows "Trade OK."
3. Extreme zone (above the upper threshold, default 1.80)
Volatility has spiked far above average. This is characteristic of scheduled high-impact news releases, liquidity gaps, and flash events. The danger here is subtle: a stop set at 1× ATR during normal conditions may now represent less than 0.5× the actual daily range, exposing the position to far greater risk than the model assumed. The ATR ratio line turns yellow. The matrix shows "Extreme."
Three static reference lines are drawn at the lower threshold, at 1.0 (the long-term average), and at the upper threshold, giving the ratio line a meaningful visual frame of reference at all times.
The higher-timeframe EMA slope
-Even when the volatility regime is healthy, entering against the dominant trend on a higher timeframe dramatically reduces win rate on most strategies. The second filter measures the slope of an EMA on a user-selected higher timeframe (HTF) and classifies it into three directional states.
-The slope is computed as:
Slope (%) = (EMA − EMA ) / close × 100
Expressing slope as a percentage of price normalizes it across instruments — a 50-pip EMA shift on a 1.1000 pair is not the same directional signal as a 50-pip shift on a 0.6500 pair. Dividing by close makes the signal scale-invariant.
-Three EMA states are classified:
- Bullish: slope percentage above +0.05. The HTF trend is rising. Long setups have macro wind behind them.
- Bearish: slope percentage below −0.05. The HTF trend is falling. Short setups have macro wind behind them.
- Flat: slope percentage between −0.05 and +0.05. The HTF EMA has no meaningful directional conviction. Counter-trend and mean-reversion environments are more likely. The matrix flags this as a warning state (yellow), and the composite permission signal switches to "Stay Out" regardless of ATR regime.
The flat threshold of ±0.05 % is intentionally conservative. It is designed to keep the indicator out of the many false-directional periods that appear during consolidations on higher timeframes, where a technically rising EMA is in fact moving so slowly that its directional claim is economically meaningless.
The composite market permission
-The two filters are combined into a single boolean condition:
Market Permission = ATR in Healthy zone AND EMA slope is NOT flat
When both conditions are true simultaneously, the bottom row of the matrix shows "Trade" in green. Any violation — dead ATR, extreme ATR, or flat EMA slope — sets the bottom row to "Stay Out" in red.
-This AND logic is the core of the indicator's value. Either filter alone is a useful volatility or trend-direction tool available in the public library. The deliberate combination creates something different: a pre-trade environment check that requires the market to be moving in a predictable direction and at a predictable pace before it grants permission. Traders who apply this filter will notice that many losing trades in their existing system occur during exactly the windows this filter would have flagged red.
Originality and how it differs from standard ATR indicators
-Standard ATR indicators display the raw ATR value. Comparing a raw ATR value across different days, instruments, or timeframes requires the user to manually assess whether the current reading is high or low relative to history. This indicator removes that cognitive load entirely by normalizing the value and classifying it into actionable regimes automatically.
-The second point of originality is the EMA slope calculation. A standard EMA displayed on a higher timeframe tells you direction visually, but it does not tell you how strong or weak that direction is in normalised terms. Computing the slope as a percentage of price creates a universally comparable metric. A slope of +0.10 % on a gold futures chart and a +0.10 % slope on a currency pair carry the same relative meaning, which allows consistent threshold values across all markets without requiring per-asset tuning.
-The composite filter — the AND logic combining volatility regime and slope strength — does not exist as a standalone, configurable, dashboard-style indicator in the public library in this form.
How to use it
Step 1 — Set up the ATR parameters for your instrument.
The default ATR length of 14 and average of 50 work well for most liquid markets on timeframes of 15 minutes and above. For very fast scalping timeframes (1–5 minutes), consider shortening the average to 20–30 to make the baseline adapt faster. For weekly or monthly swing trading, lengthening the average to 100 or 200 gives a more stable baseline.
Step 2 — Choose a higher timeframe that makes structural sense.
If you trade on the 15-minute chart, a 4-hour HTF EMA captures the session-level bias. If you trade on the 1-hour chart, Daily or Weekly captures the swing bias most institutional participants track. The HTF should be at least 4× larger than your trading timeframe to avoid redundancy.
Step 3 — Look only at the bottom row of the matrix before entering any trade.
If the bottom row says "Trade" in green, both conditions are met. If it says "Stay Out" in red, investigate the reason by reading the ATR Regime row and EMA Slope row individually — the colour of each tells you which filter triggered.
Step 4 — Use the ATR Ratio line as a continuous volatility context tool, not just a binary filter.
A ratio at 0.85 is close to the no-trade boundary — the regime is borderline, and entries taken here carry higher statistical risk of false breakouts. A ratio at 1.40 sits comfortably in the healthy zone and has historically been associated with cleaner trend-following performance. A ratio pushing toward the upper threshold warns you that a spike is beginning and position size should be pre-emptively reduced.
Step 5 — Configure alerts.
Nine alert conditions are included. The most operationally useful are "Market Permission: TRADE" and "Market Permission: STAY OUT," which fire exactly once when the composite status changes — eliminating the need to watch the indicator continuously.
Alerts included
The following alert conditions are available under the "Create Alert" dialog:
• ATR entered No-Trade zone — triggers when the ratio crosses below the lower threshold.
• ATR exited No-Trade zone — triggers when the ratio recovers above the lower threshold.
• ATR entered Extreme zone — triggers when the ratio crosses above the upper threshold.
• ATR exited Extreme zone — triggers when the ratio drops back below the upper threshold.
• EMA slope turned Flat — triggers once when the HTF slope loses directional conviction.
• EMA slope turned Bullish — triggers once when the HTF slope turns upward.
• EMA slope turned Bearish — triggers once when the HTF slope turns downward.
• Market Permission: TRADE — triggers once when both filters become green simultaneously.
• Market Permission: STAY OUT — triggers once when either filter turns red or yellow.
Input parameters reference
-ATR Length (default 14)
The lookback for the raw ATR calculation. Standard Wilder length. Hover each setting in the indicator panel to read the built-in tooltip.
-ATR Average Length (default 50)
The SMA length applied to the raw ATR to produce the normalisation baseline.
-ATR Lower Threshold (default 0.80)
The ATR Ratio below which the regime is classified as dead/no-trade.
-ATR Upper Threshold (default 1.80)
The ATR Ratio above which the regime is classified as extreme.
-EMA Length — Higher Timeframe (default 200)
The EMA period evaluated on the HTF.
-EMA Slope Lookback (default 10 bars)
How many HTF bars back the slope is measured from.
-Higher Timeframe for EMA (default 4H)
The timeframe on which the EMA is calculated. Should be higher than the chart's timeframe.
-Show Background on Extreme ATR (default off)
Toggles a semi-transparent yellow pane background during extreme volatility.
-Show Background on Healthy ATR (default off)
Toggles a semi-transparent green pane background during healthy-regime bars.
Suitable markets and trading styles
-This indicator is instrument-agnostic and has been designed to work on any liquid market: forex, crypto, equities, commodities, futures, and indices. The normalised ATR ratio ensures the thresholds carry the same meaning regardless of the asset's price level or typical daily range.
Timeframe and style suitability:
-Intraday scalping (1–15 minute charts): The filter is especially valuable here because low-volatility compression periods on intraday charts frequently produce stop-hunt price action that destroys scalping performance. Scalpers using this filter should consider tightening the ATR average length to 20–30 and selecting a 1H or 4H HTF EMA. This is systematic, volatility-filtered scalping — not news trading and not random entry scalping. The filter identifies periods where price has enough kinetic energy to reach a target without reverting before the position is filled.
-Day trading (30-minute to 4-hour charts): The composite filter is very natural here. The ATR regime identifies session-level volatility windows (for example, the first two hours of the London–New York overlap) where conditions are rich enough to trade, while the HTF EMA slope confirms the broader session bias.
-Swing trading (daily charts, 4H charts): The EMA slope filter on Weekly or Monthly adds a macro trend context layer that prevents swing entries against the dominant institutional flow. The ATR filter removes entries during holiday-period compression or pre-earnings illiquidity. This is not buy-and-hold investing; it is active swing trading with a hold period of several days to a few weeks.
-Position trading and investing (weekly or monthly charts): Useful for identifying macro volatility expansion and contraction phases, though the EMA slope filter at this timeframe scale will naturally be slower to react.
Disclaimer
This indicator is a market environment filter, not a standalone trading signal generator. It does not produce buy or sell signals. It identifies conditions where a strategy's edge is statistically more or less likely to hold, based on the two criteria described above. All trading decisions remain the full responsibility of the trader. Past performance of any filter applied to historical data does not guarantee future results. Trading involves substantial risk of loss. Use proper position sizing and risk management at all times.
Индикатор

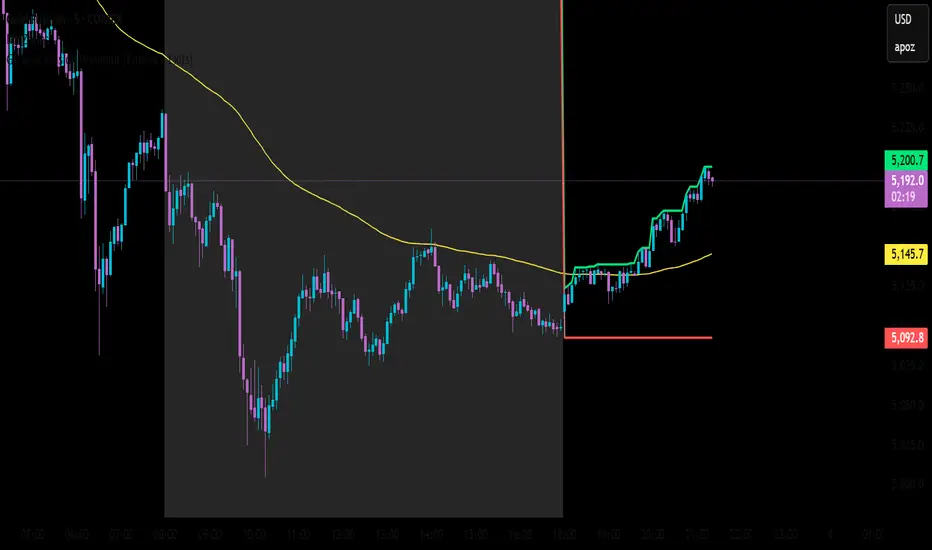
ATR Trend Strategy with Moving Average | Fixed TP/SL version📈 ## ATR Trend Strategy with Moving Average
# Overview
This strategy combines a **Moving Average trend filter** with an **ATR-based breakout channel** to identify directional market movements. It is designed for traders who prefer **systematic trend-following strategies with clearly defined risk management**.
The script builds an adaptive channel around a selected Moving Average using **Average True Range (ATR)**. When price moves beyond the ATR band and the move is confirmed for a defined number of bars, a trend state is established. Trade entries can then occur either on the initial breakout or on a pullback to the Moving Average.
The strategy also includes **fixed percentage Take Profit and Stop Loss levels**, allowing users to evaluate performance under consistent risk parameters.
---
⚙️ # Key Features
• **Multiple Moving Average types**
Supports EMA, SMA, WMA, Hull MA, VWMA, RMA, and TEMA.
• **ATR-based dynamic channel**
Uses ATR to create adaptive upper and lower boundaries around the Moving Average.
• **Two entry methods**
Users can choose between breakout entries or Moving Average pullback entries.
• **Trend confirmation filter**
Signals are confirmed only after a configurable number of bars remain beyond the ATR boundary.
• **Built-in risk management**
Includes fixed percentage Take Profit and Stop Loss levels.
• **Trade visualization**
Displays the TP/SL zone directly on the chart for each trade.
• **Performance statistics panel**
Shows key strategy metrics such as:
* Total trades
* Win rate
* Profit factor
* Net profit
* Expectancy
* Average R
* Maximum drawdown
---
🧠 # Strategy Logic
The strategy follows a simple **trend-following structure** :
1️⃣ A Moving Average defines the market's baseline trend.
2️⃣ An ATR multiplier builds a dynamic volatility channel around the Moving Average.
3️⃣ When price breaks above or below this channel and remains there for a specified number of bars, a trend is confirmed.
4️⃣ Entries can occur via:
**Breakout Mode**
* Long when price breaks above the upper ATR band.
* Short when price breaks below the lower ATR band.
**MA Cross Mode**
* After a confirmed trend, entries occur on pullbacks that cross the Moving Average.
5️⃣ Risk is controlled using **fixed percentage Take Profit and Stop Loss levels**.
---
⚙️ # Inputs
Moving Average
* MA Type
* MA Length
* MA Source
ATR Signal
* ATR Type
* ATR Length
* ATR Multiplier
Trend Confirmation
* Number of confirmation bars
* Confirmation price source (Close or High/Low)
Entry & Risk Management
* Entry method (Breakout or MA Cross)
* Take Profit (%)
* Stop Loss (%)
---
📊 ## Usage Notes
This strategy is designed for **trend-following market conditions** and may perform best in environments with sustained directional movement.
Users are encouraged to **experiment with different Moving Average types, ATR multipliers, and confirmation settings** to adapt the strategy to different markets and timeframes.
---
⚠️ ## Disclaimer
This script is provided for **educational and research purposes only**.
Past performance does not guarantee future results.
---
Стратегия

Adaptive Volatility Matrix [JOAT]Adaptive Volatility Matrix
Introduction
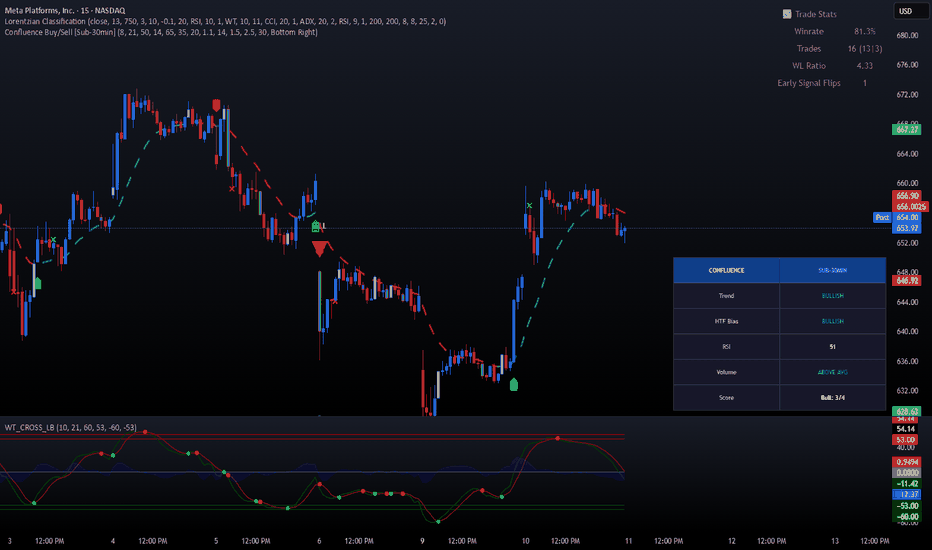
The Adaptive Volatility Matrix (AVM) is an advanced open-source volatility regime classification indicator that combines Bollinger Band Width Percentile (BBWP), ATR percentile analysis, regime transition prediction, volatility clustering detection, and historical regime statistics to classify market conditions into distinct volatility regimes. This indicator helps traders adapt their strategies to current market conditions by systematically identifying when volatility is expanding, contracting, or transitioning between regimes.
Unlike basic volatility indicators that simply plot ATR or Bollinger Bands, AVM employs a sophisticated dual-metric system that combines BBWP (measuring price range compression/expansion) with ATR percentile (measuring absolute volatility) to create a combined volatility score (0-100%). The indicator then classifies this score into five distinct regimes and predicts regime transitions through momentum analysis.
Why This Indicator Exists
This indicator addresses the challenge of adapting trading strategies to volatility conditions. Different market regimes require different approaches - mean reversion works in low volatility, breakout strategies work in expansion, and risk management becomes critical in extreme volatility. AVM systematically reveals:
BBWP Analysis: Measures Bollinger Band width percentile to identify compression/expansion cycles
ATR Percentile: Tracks normalized ATR percentile to measure absolute volatility levels
Combined Volatility Score: Weighted average (60% BBWP, 40% ATR) for robust regime classification
Regime Classification: Five distinct regimes (Extreme Expansion, Expansion, Normal, Contraction, Extreme Contraction)
Transition Prediction: Momentum-based forecasting of next regime with probability
Volatility Clustering: Detects sustained high/low volatility periods
Historical Statistics: Tracks regime duration and frequency for context
Each component provides unique intelligence. BBWP shows compression cycles, ATR shows absolute volatility, combined score provides robust classification, regime system categorizes conditions, transition prediction anticipates changes, clustering detects persistence, and statistics provide historical context.
Core Components Explained
1. BBWP (Bollinger Band Width Percentile) Calculation
BBWP measures where current Bollinger Band width ranks relative to historical width:
f_calculate_bbwp(int length, int lookback) =>
float basis = ta.sma(close, length)
float dev = ta.stdev(close, length)
float bb_width = (dev * 2) / basis * 100
// Calculate percentile rank
int count = 0
for i = 1 to lookback
if bb_width > nz(bb_width )
count += 1
float bbwp = (count / lookback) * 100
BBWP ranges from 0-100%:
- 0-20%: Extreme compression (volatility squeeze)
- 20-40%: Contraction (below average volatility)
- 40-60%: Normal (average volatility)
- 60-80%: Expansion (above average volatility)
- 80-100%: Extreme expansion (volatility breakout)
2. ATR Percentile Analysis
ATR percentile measures where current normalized ATR ranks historically:
f_atr_percentile(int period, int lookback) =>
float atr_val = ta.atr(period)
float natr = close > 0 ? (atr_val / close) * 100 : 0.0
float percentile = ta.percentrank(natr, lookback)
Normalized ATR (NATR) accounts for price level differences, making volatility comparable across different price ranges. Percentile ranking shows where current volatility sits in historical distribution.
3. Combined Volatility Score & Regime Classification
The combined score weights BBWP more heavily than ATR percentile:
float combined_score = (bbwp_value * 0.6) + (atr_percentile * 0.4)
f_classify_regime(float bbwp_val, float atr_perc, float exp_th, float con_th, float ext_th) =>
string regime = "Normal"
int regime_code = 0
if bbwp_val >= ext_th or atr_perc >= ext_th
regime := "Extreme Expansion"
regime_code := 4
else if bbwp_val >= exp_th or atr_perc >= exp_th
regime := "Expansion"
regime_code := 3
// Additional classifications...
Five regime classifications:
1. Extreme Contraction (code 1): Both metrics <30%, volatility squeeze
2. Contraction (code 2): One metric <40%, below average volatility
3. Normal (code 0): Both metrics 40-60%, average conditions
4. Expansion (code 3): One metric >70%, above average volatility
5. Extreme Expansion (code 4): Both metrics >85%, volatility breakout
4. Regime Transition Prediction
AVM predicts next regime through momentum analysis:
float regime_momentum = combined_score - combined_score
string momentum_direction = regime_momentum > 2 ? "Accelerating" :
regime_momentum < -2 ? "Decelerating" : "Stable"
string predicted_regime = regime_code == 4 and regime_momentum < -5 ? "→ Expansion" :
regime_code == 3 and regime_momentum < -3 ? "→ Normal" :
// Additional predictions...
"Stable"
float transition_prob = math.min(math.abs(regime_momentum) * 10, 100)
Transition probability (0-100%) based on momentum magnitude. >50% probability triggers warning.
5. Volatility Clustering Detection
Clustering identifies sustained high/low volatility periods:
int cluster_lookback = 20
float cluster_threshold = 70.0
int high_vol_count = 0
for i = 0 to cluster_lookback - 1
if combined_score >= cluster_threshold
high_vol_count += 1
float cluster_ratio = high_vol_count / cluster_lookback * 100
bool in_vol_cluster = cluster_ratio >= 60 // 60% of bars are high vol
string cluster_strength = cluster_ratio >= 80 ? "Strong" :
cluster_ratio >= 60 ? "Moderate" :
cluster_ratio >= 40 ? "Weak" : "None"
Clusters indicate persistent volatility conditions that tend to continue.
6. Historical Regime Statistics
AVM tracks regime history for context:
var array regime_history = array.new_int(0)
var array regime_durations = array.new_int(0)
if regime_changed
array.push(regime_history, regime_code)
array.push(regime_durations, bars_in_regime)
// Calculate statistics
float avg_expansion_duration = exp_sum / exp_cnt
float avg_contraction_duration = con_sum / con_cnt
float duration_ratio = bars_in_regime / avg_expansion_duration
bool regime_extended = duration_ratio > 1.5
Statistics show if current regime is extended (>1.5x average duration), suggesting potential transition.
Visual Elements
Combined Score Line: Main plot (0-100%) with regime-based coloring
ATR Percentile Overlay: Circles showing ATR percentile for comparison
Histogram: Gradient-colored bars showing volatility score with regime colors
Reference Lines: 70% (expansion), 50% (neutral), 30% (contraction), 85% (extreme)
Background Zones: Regime-colored backgrounds (purple for expansion, yellow for contraction)
Transition Warnings: ⚠ symbols when transition probability >50%
BBWP Percentile Bands: 20th, 50th, 80th percentile circles for context
Dashboard: Real-time metrics including regime, score, BBWP, ATR%, trend, duration, momentum, transition prediction, cluster status, duration ratio, historical stats
Input Parameters
BBWP Parameters:
BBWP Length: Bollinger Band period (default: 13)
BBWP Lookback: Historical comparison period (default: 252)
ATR Analysis:
ATR Period: ATR calculation period (default: 14)
ATR Percentile Lookback: Historical ranking period (default: 100)
Regime Classification:
Expansion Threshold: Score for expansion regime (default: 70%)
Contraction Threshold: Score for contraction regime (default: 30%)
Extreme Threshold: Score for extreme regimes (default: 85%)
Visualization:
Show Regime Zones: Toggle background coloring
Show Histogram: Toggle volatility histogram
Show ATR Overlay: Toggle ATR percentile circles
How to Use This Indicator
Step 1: Identify Current Regime
Check dashboard "Regime" row. Adjust strategy based on classification.
Step 2: Monitor Combined Score
Score >70% = expansion (use breakout strategies)
Score <30% = contraction (use mean reversion)
Score 40-60% = normal (use balanced approach)
Step 3: Check Momentum Direction
"Accelerating" = volatility increasing
"Decelerating" = volatility decreasing
"Stable" = no significant change
Step 4: Watch for Transition Warnings
⚠ symbols indicate >50% probability of regime change. Prepare to adjust strategy.
Step 5: Assess Cluster Status
"Strong" or "Moderate" cluster = persistent conditions likely to continue
Step 6: Consider Duration Ratio
Ratio >1.5x = extended regime, higher probability of mean reversion
Best Practices
Use regime classification to select appropriate trading strategies
Extreme contraction often precedes volatility breakouts - prepare for expansion
Extreme expansion often mean-reverts - reduce position sizes
Transition warnings provide early signal to adjust risk management
Volatility clusters suggest persistence - don't fight the regime
Extended regimes (>1.5x average) have higher reversal probability
BBWP and ATR percentile divergence suggests regime uncertainty
Historical statistics provide context for current regime duration
Combine with directional indicators - AVM shows conditions, not direction
Indicator Limitations
Regime classification is backward-looking - transitions lag actual changes
BBWP calculation is computationally intensive on large lookback periods
Transition predictions are probabilistic, not deterministic
Extreme regimes can persist longer than expected during major events
Historical statistics require sufficient data (50+ regime changes)
Clustering detection has fixed lookback - may miss longer-term patterns
Combined score weighting (60/40) may not be optimal for all instruments
Regime thresholds may need adjustment for different markets
Technical Implementation
Built with Pine Script v6 using:
Custom BBWP calculation with percentile ranking
ATR percentile analysis with normalized ATR
Weighted combined score (60% BBWP, 40% ATR)
Five-tier regime classification system
Momentum-based transition prediction with probability
Volatility clustering detection (20-bar lookback)
Historical regime tracking with arrays (last 50 regimes)
Duration ratio calculation vs historical averages
BBWP percentile bands (20th, 50th, 80th)
Adaptive background coloring based on regime and duration
Comprehensive dashboard with 12 metrics
The code is fully open-source and can be modified to suit individual trading styles.
Originality Statement
This indicator is original in its comprehensive volatility regime classification approach. While BBWP and ATR are established concepts, this indicator is justified because:
It combines BBWP and ATR percentile into weighted combined score for robust classification
The five-tier regime system provides granular volatility categorization
Momentum-based transition prediction with probability quantification is unique
Volatility clustering detection identifies persistent regime conditions
Historical regime statistics provide context for current regime duration
Duration ratio calculation identifies extended regimes with mean reversion potential
BBWP percentile bands add additional context layers
Adaptive background intensity based on regime stability
Each component contributes unique information: BBWP shows compression cycles, ATR shows absolute volatility, combined score provides robust classification, regime system categorizes conditions, transition prediction anticipates changes, clustering detects persistence, statistics provide context, and duration ratio identifies extremes. The indicator's value lies in presenting these complementary perspectives simultaneously with unified regime framework.
Disclaimer
This indicator is provided for educational and informational purposes only. It is not financial advice. Regime classifications do not guarantee future volatility behavior. Trading involves substantial risk of loss. Past performance does not guarantee future results. Always use proper risk management and never risk more than you can afford to lose.
-Made with passion by officialjackofalltrades Индикатор

Индикатор
Индикатор

Индикатор

Automat Off detector (ATR + Volume Collapse + Still Price)🤖 AutomatOff v2 – Detect When Algo Traders Step Away
Ever notice how some stocks go completely dead for a few minutes — tiny candles, zero volume, price barely moving? That's often a sign that algorithmic traders (automats) have paused or switched off. This indicator helps you spot those moments.
─────────────────────────────────────────
🔍 WHAT IT DETECTS
─────────────────────────────────────────
The indicator watches three things simultaneously:
📉 ATR Collapse — ATR (Average True Range) measures how much price normally moves per bar. When it drops to a fraction of its usual level, the market has gone unusually quiet. Threshold 0.75 means "flag when ATR is below 75% of its recent average."
📦 Volume Collapse — When volume drops far below its rolling average, it suggests nobody is trading. Threshold 0.6 means "flag when volume is below 60% of average."
📏 Price Range — Checks if the actual high-low range of each bar is suspiciously small. Useful on tight instruments where even 0.02 PLN of silence is meaningful.
You can enable any combination of these three, and choose whether ALL must fire together (more precise) or ANY one is enough (more sensitive).
─────────────────────────────────────────
⚙️ HOW IT WORKS
─────────────────────────────────────────
The indicator runs on your current chart timeframe and shows:
🟠 Orange line — ATR ratio (1.0 = normal, lower = quieter)
🩵 Teal line — Volume ratio (1.0 = normal, lower = quieter)
🟣 Purple line — Bar price range (when price range detection is on)
⚫ Grey line — The 1.0 baseline (normal level reference)
🔴 Red dashed — ATR collapse threshold
🔵 Blue dashed — Volume collapse threshold
When conditions are met for a minimum number of consecutive bars (default: 3), an alert fires:
⚠️ A red label appears with exact ATR%, volume% and range values
🔴 The pane background turns red for the duration of the collapse
─────────────────────────────────────────
🕐 HIGHER TIMEFRAME SUMMARY (HTF MODE)
─────────────────────────────────────────
This is where it gets powerful. Add the indicator to a 1h chart and set it to scan the 5min timeframe. Whenever a 5min alert occurred inside a given 1h bar, that exact 1h bar gets highlighted in orange — just that one bar, nothing more.
This lets you scan a whole week on 1h in seconds and immediately spot which hours had suspicious algo pauses — then zoom into 5min for details.
🔧 Enable HTF summary mode → ON
🔧 Lower timeframe to scan → 5
🔧 Min consecutive bars (lower TF) → 3
Important: on the 5min chart you see red alerts only. On the 1h chart you see orange highlights only. Clean separation, no cross-contamination.
─────────────────────────────────────────
🎨 FULL VISUAL CUSTOMISATION
─────────────────────────────────────────
Everything is configurable:
ATR line — colour + thickness
Volume line — colour + thickness + transparency
Baseline (1x) — colour + thickness
Alert labels — colour + transparency (set 100 to hide)
Volume reference labels — show/hide + transparency
Alert background — colour + transparency
ATR fill area — colour + transparency
─────────────────────────────────────────
📅 DATE RANGE FILTER
─────────────────────────────────────────
Enable to limit detection to a specific date range. Useful on free TradingView accounts with limited bar history, or when you only want to scan a specific period.
─────────────────────────────────────────
✅ RECOMMENDED SETTINGS
─────────────────────────────────────────
For 5min chart:
ATR threshold: 0.75
Volume threshold: 0.60
Price range: 0.02 (enabled)
Mode: ALL
Min bars (current TF): 3
For 1h chart (HTF overview):
HTF mode: ON
Lower TF to scan: 5
Min bars (lower TF): 3
All other settings same as above
─────────────────────────────────────────
💡 PRO TIP
─────────────────────────────────────────
Use ALL mode with all three conditions enabled for the cleanest, rarest signals. Switch to ANY if you want to catch subtler early signs of slowing activity. Start with the recommended settings and tune thresholds to your instrument — tighter spreads need smaller price range values.
─────────────────────────────────────────
⚠️ DISCLAIMER
─────────────────────────────────────────
This indicator is a pattern detection tool, not a trading signal. Algo pauses don't guarantee a breakout — always combine with your own analysis.
─────────────────────────────────────────
🛠️ BUILT WITH PINE SCRIPT v6
─────────────────────────────────────────
Open source. Suggestions and bug reports welcome in the comments. Индикатор

Ragi's ATR Value BoxThis indicator displays the Average True Range (ATR) on your chart in a customizable table box. You can choose the box position from the corners or the top/bottom middle of the chart. Key features include:
Custom ATR length – Set the period for ATR calculation.
High ATR threshold – Highlights ATR values above a user-defined level in a different color.
Customizable colors – Set the background, normal ATR color, and high ATR color to match your chart theme.
Text size options – Choose from Small, Normal, Large, or Huge for readability.
Flexible positioning – Display the ATR box at Top Left, Top Right, Bottom Left, Bottom Right, Top Middle, or Bottom Middle.
Perfect for quickly monitoring volatility levels without cluttering your chart. Индикатор

Aura Mean Reversion Envelopes [Pineify]Aura Mean Reversion Envelopes
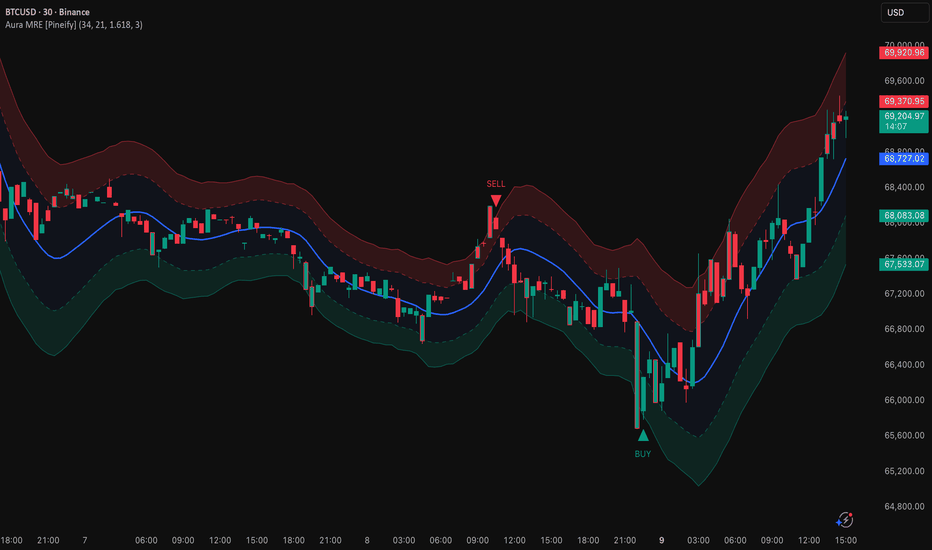
The Aura Mean Reversion Envelopes is a volatility-adaptive envelope indicator designed to identify high-probability mean reversion trade setups. It combines a Hull Moving Average (HMA) baseline with ATR-based dynamic envelopes to detect when price has reached statistically extreme levels and is likely to revert back toward its fair value. Unlike static channel indicators, this tool continuously adapts its bands to current market volatility, making it effective across different instruments and timeframes.
Key Features
Hull Moving Average (HMA) as the central mean — provides a smooth, low-lag baseline that closely tracks the "fair value" of price.
ATR-based dynamic envelopes — four bands (inner and outer, upper and lower) that automatically expand and contract with market volatility.
Wick rejection reversal signals — BUY and SELL markers triggered only when price pierces the exhaustion zone but closes back inside with a confirming candlestick pattern.
Visual cloud zones — color-filled regions between bands clearly delineate overbought, oversold, and neutral mean-reversion corridors.
Extreme candle coloring — optional bar coloring highlights candles closing beyond the inner bands for at-a-glance identification of stretched price action.
Built-in alert conditions — configurable alerts for both bullish and bearish reversal signals so you never miss a setup.
How It Works
The indicator is built on the principle of mean reversion — the statistical tendency for price to return to its average after moving to an extreme. The core calculation pipeline is:
A Hull Moving Average (HMA) of the closing price over a user-defined period (default: 34) is computed. HMA was chosen over SMA or EMA because it dramatically reduces lag while maintaining smoothness, giving a more accurate representation of the current mean.
Market volatility is measured using the Average True Range (ATR) over a separate lookback period (default: 21). ATR captures the true range of each bar — including gaps — providing a robust, adaptive volatility metric.
Four envelope bands are constructed symmetrically around the HMA baseline by adding and subtracting ATR multiplied by two configurable multipliers: an inner multiplier (default: 1.618, the golden ratio) and an outer multiplier (default: 3.0). The inner bands define the boundary of normal price oscillation, while the outer bands mark exhaustion zones where price has deviated significantly.
Reversal signals are generated using a wick rejection pattern: a bullish signal fires when the bar's low pierces below the lower outer band, but the candle closes bullishly (close > open) and above the outer band. This pattern indicates that sellers pushed price to an extreme but were overwhelmed by buyers. The bearish signal uses the mirror logic on the upper side.
Trading Ideas and Insights
Mean reversion strategies work best in ranging and oscillating markets. Here are some practical ways to use this indicator:
Fade the extremes: When a BUY or SELL signal appears at the outer exhaustion band, consider entering a position targeting the central HMA mean line as your take-profit level. The mean line acts as a natural magnet for price.
Use the inner bands as a filter: If price is between the inner bands and the mean, the market is in "normal" territory — avoid counter-trend entries. Wait for price to reach the outer bands before looking for reversal setups.
Combine with trend context: On higher timeframes, determine the dominant trend direction. Then on your trading timeframe, only take signals that align with the higher-timeframe trend (e.g., only BUY signals in an uptrend) for higher win rates.
Watch for candle coloring clusters: Multiple consecutive colored candles beyond the inner band suggest sustained momentum — a reversal signal after such a cluster can be particularly powerful.
How Multiple Indicators Work Together
This indicator integrates two distinct technical concepts into a unified framework:
Hull Moving Average (trend/mean tracking) — The HMA serves as the anchor point, representing the current equilibrium price. Its low-lag property ensures the mean line stays close to actual price action rather than trailing behind, which is critical for accurate envelope placement.
Average True Range (volatility measurement) — ATR dynamically sizes the envelope bands. During high-volatility periods, the bands widen to avoid false signals; during low-volatility periods, they tighten to capture smaller but still meaningful deviations.
The synergy between these two components is what makes the indicator adaptive: the HMA tracks where price should be, while the ATR determines how far is too far. Together, they create a self-adjusting framework that does not require manual recalibration across different market conditions.
The reversal signal logic adds a third layer — candlestick pattern confirmation — by requiring a wick rejection at the outer band. This prevents signals from firing during strong breakouts where price legitimately moves beyond the envelope.
Unique Aspects
HMA over EMA/SMA: Most envelope indicators use simple or exponential moving averages, which introduce significant lag. The Hull Moving Average virtually eliminates this lag, resulting in more accurately centered envelopes.
Dual-layer envelope design: The inner and outer band structure creates distinct zones (normal, extended, exhaustion) rather than a single binary overbought/oversold threshold, giving traders more nuanced context.
Golden ratio default: The inner band multiplier defaults to 1.618 (the Fibonacci golden ratio), a mathematically significant threshold that aligns with natural price clustering behavior observed across many markets.
Wick rejection confirmation: Signals require both a pierce beyond the outer band AND a confirming close back inside with a bullish/bearish candle body, filtering out many false signals that plague simpler band-touch systems.
How to Use
Apply the indicator to your chart. It overlays directly on the price chart with the HMA mean line, four envelope bands, and color-filled zones.
Watch for BUY triangles below bars at the lower outer band and SELL triangles above bars at the upper outer band. These are the primary reversal signals.
Use the colored candles as an early warning — when candles start coloring, price is in the extended zone and approaching potential reversal territory.
Set alerts via the built-in alert conditions ("Bullish Mean Reversion" and "Bearish Mean Reversion") to receive notifications when signals fire.
Target the central HMA mean line for take-profit on reversal trades, or use the inner band on the opposite side for more aggressive targets.
Customization
Mean Tracking Period (default: 34): Controls the HMA lookback. Lower values make the mean more responsive to recent price; higher values produce a smoother, slower-moving baseline. Adjust based on your trading timeframe.
Volatility (ATR) Period (default: 21): Controls the ATR lookback for band sizing. Shorter periods make bands more reactive to recent volatility spikes; longer periods smooth out the band width.
Inner Band Multiplier (default: 1.618): Defines the boundary between normal and extended price zones. Increase for wider normal zones (fewer colored candles); decrease for tighter zones.
Outer Band Multiplier (default: 3.0): Defines the exhaustion zone threshold. Higher values produce fewer but more extreme signals; lower values generate more frequent signals.
Color Candles at Extremes: Toggle on/off the candle coloring feature for candles closing beyond the inner bands.
All colors (bullish, bearish, mean line) are fully customizable via the Aesthetics & Colors settings group.
Conclusion
The Aura Mean Reversion Envelopes combines the precision of the Hull Moving Average with ATR-adaptive volatility bands and candlestick-confirmed reversal signals to create a comprehensive mean reversion trading tool. Its dual-layer envelope design provides clear visual zones for identifying when price is normal, extended, or at exhaustion — helping traders time entries at statistically favorable levels where price is most likely to revert toward its mean. Whether you trade forex, crypto, stocks, or futures, this indicator adapts to your market's volatility and provides actionable signals with built-in confirmation logic. Индикатор
Индикатор

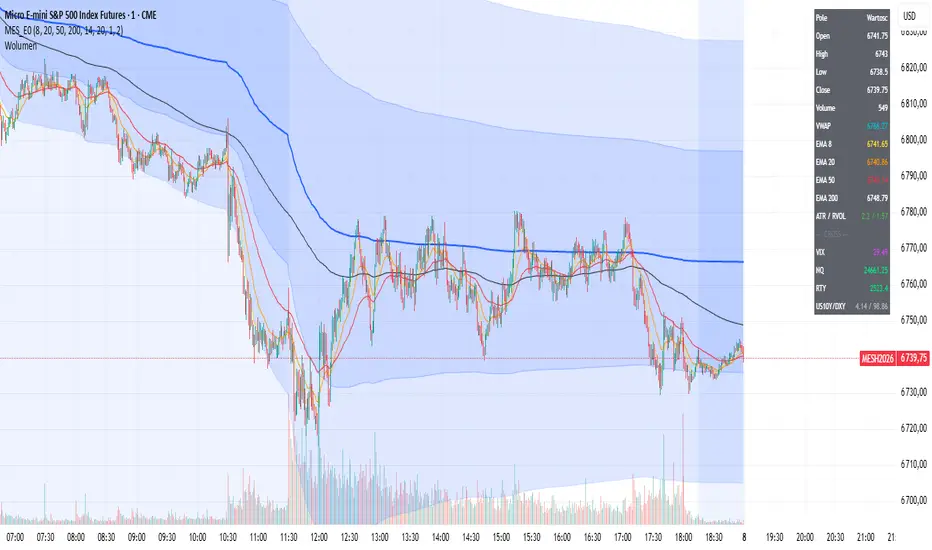
MES Etap 0EN:
One indicator replacing seven. Designed for learning to read the market and exporting clean data for AI analysis.
What's inside:
Session VWAP with standard deviation bands (1σ, 2σ)
EMA 8, 20, 50, 200 with proper column names in CSV export
ATR(14) and RVOL (relative volume) in Data Window
Cross-asset data: VIX, NQ, RTY, US10Y, DXY on every candle
Live data table in the top-right corner (optional)
Why this exists:
TradingView's CSV export labels default EMA indicators as "Plot". Four EMAs = four "Plot" columns and you can't tell which is which. This indicator solves that: every column has a readable name (EMA_8, EMA_20, VWAP, ATR_14, VIX, NQ...). One export = complete data record ready for analysis.
Who it's for:
MES/ES traders building an R&D system with AI. Readers of the "Bractwo Rynku" book series. Anyone who wants clean, labeled data exports from TradingView.
Editable parameters:
EMA, ATR, RVOL periods, VWAP band multipliers, toggle table and bands on/off.
Takes 1 indicator slot. On Essential plan (limit 5) you still have room for Volume and more.
Open source. Repo: github.com/Badmike81/bractworynku-etap0
Индикатор

Стратегия

Индикатор
Индикатор

PnL Ruler [NLR]Know your dollar targets at a glance — no mental math.
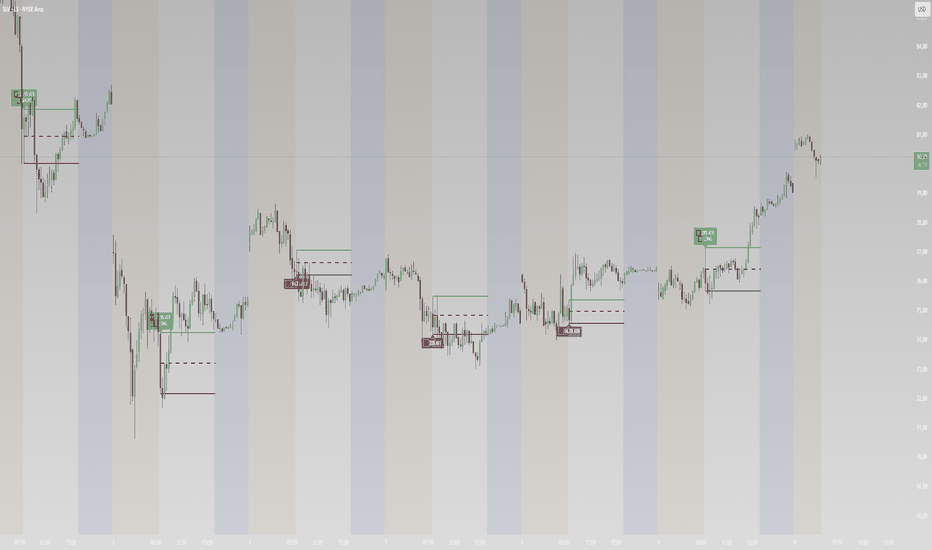
PnL Ruler overlays a dollar-value scale on your chart, anchored to an ATR-based trailing trend line.
The trend line marks your ideal entry zone ($0 reference) — to plan high-quality entry. Labeled levels above and below show exactly where each profit and loss target sits in price terms.
Having dollar targets defined before the trade removes the guesswork and the emotional pressure of deciding in the moment.
Futures-aware: automatically detects tick value per instrument, so dollar levels are accurate out of the box on ES, NQ, MES, MNQ, CL, GC, and others.
Also plots the extreme close of the current trend leg — the highest close in an uptrend, lowest in a downtrend — as a visual reference for how far price has extended.
Settings
ATR Length / Trend Factor / Error Margin — controls the ATR-based trailing trend line
Contracts — scales all PnL levels by your position size
PnL Step ($) — dollar increment between levels (e.g. $200 → shows ±$200, ±$400…)
Levels Each Side — how many levels above and below zero (max 20)
Lookback Bars — how far left the lines extend into past price action
EMA Length / HMA Length — period for each moving average. EMA follows trend direction color (dashed); HMA uses blue/orange based on its own slope
Credits
Trend line based on the Follow Line Indicator by Dreadblitz. Индикатор

Volatility-Adjusted Rate of Change [QuantAlgo]🟢 Overview
The Volatility-Adjusted Rate of Change (VA-ROC) is a momentum oscillator that normalizes price changes against current market volatility, helping traders identify meaningful momentum shifts, spot overbought/oversold extremes, and filter out noise caused by changing volatility regimes. By measuring how large a price move is relative to what's normal for the instrument, this indicator reveals genuine directional pressure that raw momentum readings often obscure.
🟢 How It Works
The indicator begins by calculating the single-bar price change and dividing it by the Average True Range over a configurable lookback period. This normalization step ensures that the same oscillator reading carries equal significance whether applied to a low-volatility blue chip or a highly volatile cryptocurrency, a concept absent from traditional rate of change indicators.
price_momentum = ta.change(close) / ta.atr(atr_length)
When price rises by an amount that is large relative to recent volatility, the normalized momentum produces a strong positive reading. Conversely, a decline that is modest in absolute terms but significant relative to the current ATR environment will register appropriately. This volatility-adjustment prevents the oscillator from generating inflated signals during high-volatility regimes or muted signals during quiet markets.
A sensitivity multiplier then scales the normalized value, allowing traders to compress or amplify the oscillator's range to suit their instrument and timeframe:
va_roc = calc_ma(price_momentum * sensitivity, ma_length, ma_type)
The scaled momentum is then smoothed using a configurable moving average (supporting SMA, EMA, WMA, RMA, HMA, VWMA, DEMA, and TEMA), which filters bar-to-bar noise while preserving the shape of genuine momentum waves. The smoothed output is the final VA-ROC value, plotted against a system of four threshold levels that define bullish, bearish, neutral, and extreme zones.
Momentum state is determined by the oscillator's position relative to these thresholds:
is_bullish = va_roc > upper_threshold
is_bearish = va_roc < lower_threshold
Crossings into bullish or bearish territory, zero-line crosses, and entries into extreme zones each generate distinct signals and corresponding alerts.
🟢 Key Features
The indicator is built around a threshold-based momentum framework with gradient-colored visualization, preset configurations, and a full alert system, all designed to give traders immediate clarity on momentum conditions without manual tuning.
1. Volatility Normalization: Unlike traditional ROC or momentum oscillators that produce raw price differences, VA-ROC divides every price change by the ATR, creating a dimensionless reading that remains consistent across instruments, timeframes, and volatility regimes. A reading of +1.0 always means "price moved one ATR's worth in a single bar", whether you're trading forex, equities, or crypto. This eliminates the need to recalibrate threshold levels when switching between assets.
2. Adaptive Threshold Zones: Four configurable levels (Upper Extreme, Upper Threshold, Lower Threshold, and Lower Extreme) divide the oscillator into five distinct momentum zones. The neutral zone between the upper and lower thresholds represents normal market fluctuation. Crossings above the upper threshold confirm bullish momentum, while crossings below the lower threshold confirm bearish momentum. The extreme levels mark climactic conditions where momentum is unusually powerful, often coinciding with exhaustion points or the early stages of a strong trend continuation.
3. Preset Configurations: Three built-in presets automatically optimize the sensitivity, ATR lookback, MA type, and smoothing length for different trading styles. Default provides balanced readings suited for swing trading on 4H and daily charts. Fast Response amplifies small moves with minimal smoothing for intraday scalping. Smooth Trend compresses the oscillator and applies heavier smoothing to highlight only significant directional moves for position trading.
4. Built-in Alert System: Comprehensive alerts covering all key momentum events, including bullish and bearish momentum confirmation, zero-line crossovers in both directions, and entries into upper and lower extreme zones. A combined momentum direction change alert is also included. All alerts carry exchange, ticker, and interval placeholders for seamless integration with notification workflows.
5. Visual Customization: Choose from 5 color presets (Classic, Aqua, Cosmic, Cyber, Neon) or create a fully custom color scheme using individual bullish, bearish, and neutral color pickers. Optional price bar coloring overlays the oscillator's momentum colors directly onto your main chart candles, tinting bars bullish or bearish based on the current threshold state while leaving neutral bars uncolored, providing instant trend confirmation without switching panels.
Индикатор

Стратегия

Стратегия