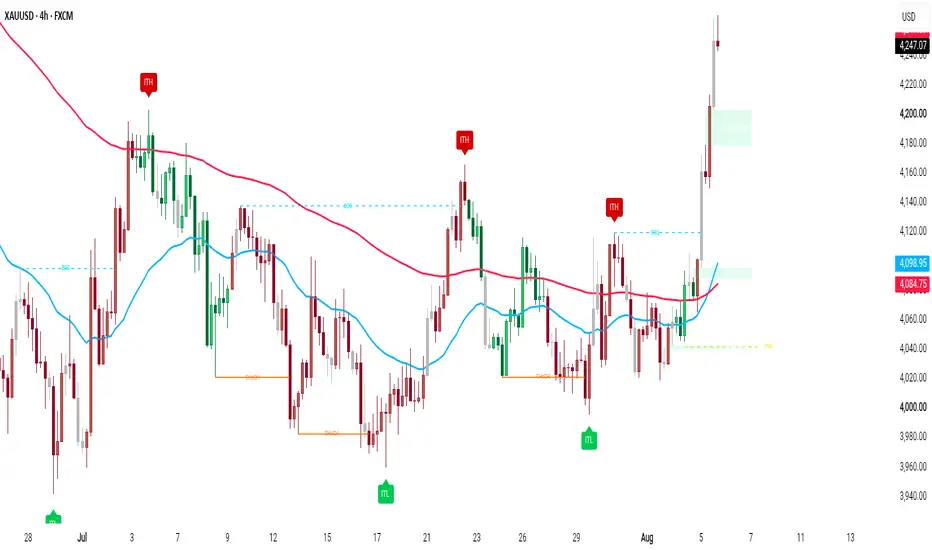
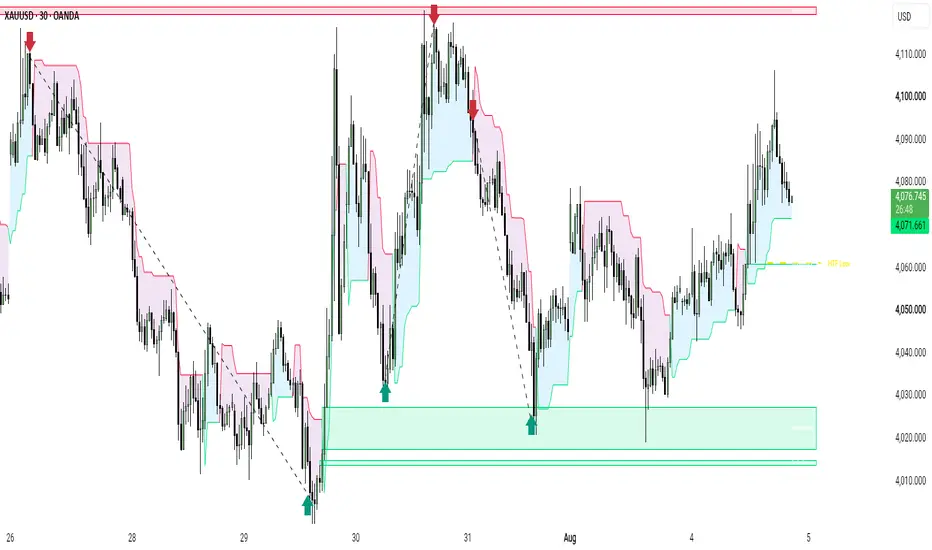
Adaptive Trend Pulse Pro [JPT]🔷 OVERVIEW
Adaptive Trend Pulse Pro is a professional trend-following and trade-management indicator designed to help traders identify confirmed market direction, filter weaker setups, and structure potential trades with predefined Entry, Stop Loss, and Take Profit levels.
The system combines an adaptive trend engine, EMA confirmation, RSI momentum, volume analysis, candle momentum, signal scoring, ATR-based risk management, and multi-market monitoring into one streamlined TradingView indicator.
It is designed for traders who want a cleaner way to evaluate trend transitions without relying on a single indicator or isolated signal.
🔷 CORE CONCEPT
The indicator follows a simple principle:
Detect the trend → Confirm the setup → Score the signal → Define risk → Manage the trade.
Instead of treating every trend change as an immediate trading opportunity, the system applies additional confirmation filters before displaying a potential LONG or SHORT setup.
This helps make the signals more selective and provides a structured framework for discretionary trading.
🔷 SIGNAL ENGINE
The Adaptive Trend Engine continuously evaluates price movement and volatility to determine the current market direction.
🟢 LONG Environment
A bullish environment is identified when the adaptive trend structure shifts upward.
Additional confirmation can come from:
Price above the EMA
RSI bullish momentum
Above-average volume
Bullish candle momentum
Confirmed candle close
🔴 SHORT Environment
A bearish environment is identified when the adaptive trend structure shifts downward.
Additional confirmation can come from:
Price below the EMA
RSI bearish momentum
Above-average volume
Bearish candle momentum
Confirmed candle close
🔷 SIGNAL SCORE
The indicator includes a Signal Score designed to help distinguish stronger setups from weaker ones.
The score evaluates multiple conditions rather than relying on trend direction alone.
Higher score = stronger confirmation.
Users can adjust the Minimum Signal Score depending on their preferred trading style.
Suggested approach
3/4 — Balanced
More opportunities while still requiring confirmation.
4/4 — Strict
Fewer signals with stronger confirmation requirements.
🔷 ENTRY SYSTEM
When a confirmed LONG or SHORT setup appears, the indicator automatically establishes an approximate trading entry based on the confirmed signal candle.
LONG
LONG → Entry → Stop Loss → TP1 → TP2 → TP3
SHORT
SHORT → Entry → Stop Loss → TP1 → TP2 → TP3
The levels are dynamically calculated from current market volatility.
🔷 STOP LOSS
The Stop Loss is calculated using ATR-based volatility.
This allows the distance to adapt to the market rather than using one fixed number of points.
The Stop ATR Multiplier can be adjusted according to the market and timeframe.
A higher multiplier provides a wider volatility allowance.
A lower multiplier creates a tighter risk level.
🔷 TAKE PROFIT SYSTEM
The indicator provides three structured targets:
🎯 TP1 — 1R
First objective.
🎯 TP2 — 2R
Second objective.
🎯 TP3 — 3R
Extended objective.
The R-multiple is based on the distance between Entry and the initial Stop Loss.
Example:
Entry = 100
Stop = 98
Risk = 2 points.
Therefore:
TP1 = 102
TP2 = 104
TP3 = 106
🔷 BREAK-EVEN MANAGEMENT
After TP1 is reached, the indicator can move the active Stop Loss toward the original Entry level.
This allows traders to protect the position after the first objective has been reached.
TP1 → Break-Even → TP2 → TP3
This feature can be enabled or disabled from the settings.
🔷 ATR TRAILING STOP
After TP2, an optional ATR trailing mechanism can be activated.
The trailing stop dynamically follows price based on current volatility.
This is intended to help protect open profit while allowing the trend enough room to continue.
🔷 RISK / REWARD ZONES
The chart can display visual risk/reward areas around an active setup.
The zones help traders immediately see:
🟢 Potential reward area
🔴 Risk area
⚪ Entry level
This makes it easier to visually evaluate the trade structure before taking action.
🔷 MULTI-ASSET SCANNER
The dashboard can monitor multiple markets simultaneously.
Example:
BTCUSDT — LONG
ETHUSDT — LONG
SOLUSDT — NEUTRAL
EURUSD — SHORT
XAUUSD — LONG
This allows traders to quickly compare market conditions without opening multiple charts.
🔷 PERFORMANCE DASHBOARD
The indicator includes a compact dashboard showing information such as:
Signal Score
Win Rate
Wins
Losses
Break-Even trades
Closed Trades
Current Trade Status
The dashboard is intended as a reference tool rather than a guarantee of future performance.
🔷 ALERT SYSTEM
Alerts are available for important events including:
🔔 LONG confirmation
🔔 SHORT confirmation
🔔 TP1 reached
🔔 TP2 reached
🔔 TP3 reached
🔔 Stop level reached
This allows traders to monitor setups without constantly watching the chart.
🔷 CONFIRMED SIGNAL LOGIC
The indicator uses confirmed-bar logic for its primary LONG and SHORT signals.
Signals are therefore intended to be confirmed at candle close rather than triggering from an unfinished candle.
However, this does not eliminate normal market risk or guarantee that every historical signal will behave the same way in live trading.
🔷 RECOMMENDED MARKETS
The system can be tested on a variety of liquid markets, including:
🥇 XAUUSD / Gold
₿ BTCUSDT
♦️ ETHUSDT
🟣 SOLUSDT
💵 EURUSD
📈 Major indices
The optimal settings can vary significantly between instruments and timeframes.
🔷 RECOMMENDED SETUP
Balanced Configuration
Amplitude: 12
ATR Length: 100
Channel Multiplier: 2.0
EMA: 200
RSI: 14
Minimum Score: 3/4
Cooldown: 5 bars
Stop ATR: 1.5
TP1: 1R
TP2: 2R
TP3: 3R
Break-Even: ON
ATR Trailing: ON
These are starting settings, not guaranteed optimal settings. Backtesting and forward testing should be performed for each market/timeframe.
🔷 HOW TO USE
🟢 LONG
Wait for the adaptive trend to turn bullish.
Wait for the confirmation score to meet your minimum requirement.
Wait for the confirmed LONG signal.
Review Entry and Stop Loss.
Evaluate the risk/reward structure.
Monitor TP1, TP2 and TP3.
Use Break-Even and trailing management if desired.
🔴 SHORT
Wait for the adaptive trend to turn bearish.
Wait for the confirmation score.
Wait for the confirmed SHORT signal.
Review Entry and Stop Loss.
Evaluate risk/reward.
Monitor TP1, TP2 and TP3.
Manage the position according to your risk plan.
🔷 IMPORTANT
Adaptive Trend Pulse Pro is a technical analysis tool, not a guaranteed-profit system.
No indicator can guarantee a specific win rate or eliminate losing trades. Market conditions, volatility, spreads, liquidity and timeframe can all affect results.
Always test the indicator on your preferred market and timeframe and use appropriate risk management.
Adaptive Trend Pulse Pro
Detect the trend • Confirm the setup • Define the risk • Manage the move Индикатор

Daily ATR BoxDaily ATR Box
A compact stats table — ATR, gap size, pre-market volume, and how much of the stock's typical daily range is already used — in one glance instead of eyeballing the chart and doing the math yourself. Renders in its own pane, not as an overlay on price.
What it shows
ATR(N) — the stock's N-day average true range (default 14), pulled from the daily timeframe.
Gap — today's gap vs. the prior session's close, in price and as a % of ATR. Live against last price during pre-market; freezes at the official 9:30 open print once the regular session starts, so the number stops drifting once the real open is in.
PM Vol — pre-market volume as a % of average daily volume (ADV, default 20-day lookback). Color-coded green at 30%+ ADV, yellow at 10%+ — rough thresholds for "is this actually in play" pre-market. Needs an intraday chart with extended-hours data on; reads 0 on an RTH-only chart, and is only as complete as your feed's extended-hours reporting.
Used — % of the stock's typical daily range (ATR) already consumed by today's regular-session high-low range. Green under 50%, yellow 50–79%, red 80%+, as a heads-up for when the day's typical move is mostly spent.
Left — remaining ATR in absolute price terms (floored at zero).
vs O — current price change vs. today's regular-session open.
Notes on accuracy
Range and gap tracking reset at the daily rollover rather than at the 9:30 session start, so pre-market always reflects the current day instead of showing yesterday's stale numbers. Prior close is tracked from the last regular-session bar actually seen rather than a fixed one-bar lookback on the daily series, which avoids the gap reading against the wrong day around weekends and holidays.
Inputs: ATR length, ADV lookback (days), table position, text size.
Индикатор

ORB + New High/Low AlertsORB + Trail Exit Alerts (v2)
Opening-range breakout alerts with a hold-through confirmation filter and a matching trail-exit signal — built to solve one specific problem: most ORB alerts fire on the very first candle that pokes past the range, which is often the chasing entry, not the real signal.
How it works
Opening range — tracks the high/low of the first N minutes of the regular session (default 15m, configurable to 5/15/30).
Confirm timeframe — once the range is set, the script watches candle closes on a separate confirm timeframe (default 5m) rather than the chart's own timeframe. This keeps the signal consistent regardless of what resolution you're currently viewing.
Hold-through filter — a single close beyond the range is not enough. The script requires N consecutive confirm-timeframe closes beyond the level (default 2) before alerting. A close that fails back inside the range resets the count to zero. This filters the single-bar fakeouts that a naive "close beyond the range" alert fires on.
Trail-exit alert — once an ORB alert has fired, the script tracks an EMA (default length 5) computed on the same confirm-timeframe closes, and fires a second alert the first time price closes back across it. This gives a defined, non-discretionary exit signal instead of leaving the trail decision to be made under pressure mid-trade.
New-high pings — optional supplementary alerts for fresh 5m/15m highs, pause-filtered so a steady trend doesn't spam an alert on every bar.
Setup
All alert conditions use alert() calls — create a TradingView Alert on this indicator with condition "Any alert() function call" to receive them. Inputs let you switch between "close" mode (filters wick fakeouts, recommended) and "touch" mode (fires on any wick through, no confirmation), adjust the opening-range length, confirm timeframe, required confirm bars, and trail EMA length.
Notes
This is a signal/alert tool, not a strategy backtest — it does not place trades or account for slippage, commissions, or position sizing. Alerts mark when the rule conditions are met; whether and how to act on them is a discretionary decision. Past price action shown by the indicator is not indicative of future results. Индикатор

Butterworth Spectral Trend [QuantAlgo]🟢 Overview
The Butterworth Spectral Trend is a trend-following indicator built on a 2-pole Butterworth SuperSmoother rather than fixed moving averages or crossover logic. It extracts a low-noise spectral trend path from price, optionally stretches or compresses that path’s cutoff from residual signal-to-noise conditions, then converts filter slope into direction with hysteresis and hold controls so traders can separate genuine trend turns from short-lived noise across every timeframe and market.
🟢 How It Works
The foundation of the indicator is a classic 2-pole Butterworth SuperSmoother. Coefficients are derived from the live cutoff period and a damping factor (√2 by default for the maximally flat Butterworth response), then applied recursively to the selected price source, with an optional Nyquist average of the current and prior sample to suppress 2-bar oscillation:
butterworth_coefficients(float period, float damping) =>
float safe_period = math.max(period, 2.0)
float argument = damping * math.pi / safe_period
float alpha = math.exp(-argument)
float c2 = 2.0 * alpha * math.cos(argument)
float c3 = -alpha * alpha
float c1 = 1.0 - c2 - c3
A provisional filter always runs at the base cutoff. Residual energy (price minus provisional filter) and provisional slope energy are tracked with EMA-style RMS estimates. Their ratio maps market conditions into a noise weight that lengthens the cutoff when residuals dominate and shortens it when directional slope energy is cleaner:
float residual = price_source - provisional_filter
float signal_to_noise = residual_rms > 0 ? slope_rms / residual_rms : 10.0
float noise_weight = 1.0 / (1.0 + math.min(math.max(signal_to_noise, 0.05), 10.0))
float target_cutoff = min_cutoff + (max_cutoff - min_cutoff) * noise_weight
float desired_cutoff = adaptive_cutoff ? base_cutoff * (1.0 - adapt_strength) + target_cutoff * adapt_strength : float(base_cutoff)
The live cutoff is blended toward that target with a smoothing factor so period changes do not jump bar to bar. The final spectral filter is then computed from those adaptive coefficients. When adaptivity is disabled, the filter always uses the fixed base cutoff period.
Direction is read from the spectral filter’s slope, not from price-versus-line crossovers. Optional hysteresis requires opposite slope to exceed a multiple of its typical recent magnitude before a flip is allowed, and a minimum hold bar count enforces a cooldown after each flip:
float filter_slope = spectral_filter - nz(spectral_filter , spectral_filter)
float deadband = hysteresis * typical_slope
bool opposite_move = slope_direction != 0 and slope_direction != trend_direction
bool clears_deadband = abs_filter_slope > deadband or hysteresis == 0.0
bool hold_complete = bars_since_flip >= min_hold_bars
if opposite_move and clears_deadband and hold_complete
trend_direction := slope_direction
bars_since_flip := 0
This design means the trend path is spectral (period-based smoothing), while state flips are slope-gated. Clean directional conditions can tighten the cutoff for faster response; noisy conditions can lengthen it for more stability. Hysteresis and hold bars further reduce clustered flips without changing the underlying filter math.
Direction state is tracked through an integer trend direction, with signal conditions derived from comparing the current and prior bar states:
turned_bullish = trend_direction == 1 and trend_direction != 1
turned_bearish = trend_direction == -1 and trend_direction != -1
trend_changed = turned_bullish or turned_bearish
🟢 Signal Interpretation
▶ Bullish Trend (Green/Bullish palette): When spectral filter slope turns positive and clears any active hysteresis and hold constraints, the indicator enters bullish mode with bullish colouring applied across the SuperSmoother line, optional spectral bodies, gradient fill, and BUY label. This state persists until slope reverses with enough strength (and after enough bars) to satisfy the signal filters, allowing shallow noise wiggles in the filter to occur without flipping direction.
▶ Bearish Trend (Red/Bearish palette): When spectral filter slope turns negative under the same constraints, the indicator enters bearish mode with bearish colouring across all visual elements. A confirmed opposite slope move is required to exit this state and print a SELL signal.
🟢 Features
▶ Preconfigured Presets: Three parameter sets cover different trading approaches. "Default" targets swing trading on 1-hour to daily charts with a balanced base cutoff, moderate residual adaptivity, and lookback. "Fast Response" shortens the cutoff and strengthens adaptivity for intraday charts from 5-minute to 1-hour, where earlier turns matter more than flip sparsity. "Smooth Trend" lengthens the cutoff, softens adaptivity, and adds light hysteresis plus a short hold for position trading on daily and weekly timeframes, where false flips are more costly than delayed ones. Selecting a preset overrides the corresponding core, adaptivity, and signal inputs.
▶ Built-in Alerts: Three alert conditions cover all directional states. "Bullish Trend Signal" fires on the bar where trend direction confirms bullish. "Bearish Trend Signal" fires on the bar where it confirms bearish. "Any Trend Change" combines both into a single condition for traders who want a unified notification regardless of direction. Alerts continue to work even when signal labels are hidden.
▶ Visual Customisation: Six colour presets (Classic, Aqua, Cosmic, Cyber, Neon, and Custom) apply coordinated bullish and bearish colour schemes across the SuperSmoother line, spectral bodies, gradient fill, signal labels, and optional bar and background colouring. Bar colouring tints price candles with the active trend colour at a configurable transparency level, and background colouring extends the directional tint across the full chart pane.
Индикатор

Tubbsie's Chop Warning Indicator**Chop Warning**
A simple, at-a-glance indicator that tells you whether the market is trending cleanly or chopping sideways around a moving average — the kind of environment where breakouts fail, stops get hunted, and most trend-following setups don't work.
**How it works**
The indicator picks a reference EMA (13 by default) and counts how often each candle's high–low range contains that EMA. When price is trending, most candles sit cleanly above or below the moving average and the count stays low. When price is chopping, the EMA sits inside candle after candle and the count rises.
Two views are reported side by side:
- **Rolling** — the percentage of crosses over the last N candles, showing what's happening right now
- **Session** — the percentage across the whole trading session, showing the character of the day as a whole
Both figures appear in a small on-chart table, colour-coded green (clean), amber (mixed), or red (choppy). A single verdict line at the top summarises the current state in plain English.
**Settings**
Everything is configurable: EMA length, rolling window size, the two thresholds that define "clean" and "choppy", which view drives the warning (rolling, session, or either), the session window and timezone, table position and size, colours, and optional background shading when a warning is active. Alerts fire when chop is detected and when the market cleans up again.
**How to use it**
Works on any market and any timeframe. Add it to your chart alongside your existing setup and treat a red verdict as a filter — a signal to stand aside, reduce size, or wait for the environment to improve before taking a trend-based trade.
Индикатор

Alpha Trend Hunter | PropTraderzOverview
Alpha Trend Hunter is an overlay trend-analysis indicator designed to identify directional transitions by requiring agreement between two independent components:
a custom smoothed synthetic price structure derived from OHLC data;
an ATR-based SuperTrend filter.
The indicator does not generate a Buy or Sell label from either component independently.
A signal is created only when both modules agree on direction and the combined directional state changes.
The intended workflow is therefore:
Price Smoothing → Synthetic Trend Direction → Volatility Trend Confirmation → Directional Signal
The underlying concepts of exponential moving averages, synthetic Heikin-Ashi-style calculations, ATR and SuperTrend are established technical-analysis concepts. The implementation focuses on combining them into a two-stage confirmation framework intended to reduce isolated directional transitions that are not supported by both price structure and volatility-adjusted trend.
1. Smoothed OHLC Foundation
The first stage of the indicator applies an exponential moving average independently to:
Open
High
Low
Close
The default smoothing period is:
14 bars
This creates four smoothed OHLC series:
smoothed open;
smoothed high;
smoothed low;
smoothed close.
The purpose of this initial stage is to reduce some of the short-term noise present in raw candles before the synthetic trend structure is calculated.
A larger HA Period produces more smoothing and slower reactions.
A smaller HA Period keeps the synthetic structure closer to raw price and therefore makes it more responsive.
2. Custom Synthetic Heikin-Ashi-Style Structure
After the OHLC series are smoothed, the script calculates a synthetic typical value:
Synthetic Typical =
(Smoothed Open + Smoothed High + Smoothed Low + Smoothed Close) / 4
A recursive synthetic open is then calculated.
On initialization:
Synthetic Open =
(Smoothed Open + Smoothed Close) / 2
After initialization:
Synthetic Open =
(Previous Synthetic Open + Previous Synthetic Typical) / 2
This recursive calculation creates a smoother directional structure that carries information forward from previous bars.
It should be understood as a custom Heikin-Ashi-style synthetic calculation, rather than the standard Heikin Ashi candle series supplied directly by TradingView.
3. Synthetic High and Low
The script constructs synthetic upper and lower values using the smoothed high/low together with the synthetic open and synthetic typical value.
Synthetic High
The maximum of:
smoothed high;
synthetic open;
synthetic typical.
Synthetic Low
The minimum of:
smoothed low;
synthetic open;
synthetic typical.
These values define the working synthetic price range used by the trend-line calculation.
4. Synthetic Mid-Line
The midpoint of the synthetic range is calculated as:
Mid-Line = Synthetic Low +
(Synthetic High − Synthetic Low) / 2
This is equivalent to the midpoint between the custom synthetic high and low.
The mid-line is then smoothed again using an EMA.
The default secondary smoothing length is:
2 bars
The result is plotted as the primary visible trend line.
5. Trend-Line Direction
The color of the main trend line is determined by the relationship between:
synthetic open;
synthetic typical price.
Bullish synthetic structure
When:
Synthetic Open < Synthetic Typical
the structure is interpreted as bullish.
Bearish synthetic structure
When:
Synthetic Open > Synthetic Typical
the structure is interpreted as bearish.
The trend line therefore provides a continuous visual representation of the direction calculated from the custom synthetic price series.
6. Secondary Smoothing
The Smooth parameter controls the final EMA applied to the synthetic midpoint.
Default:
2
Lower value
Produces:
faster trend-line response;
closer tracking of short-term movement;
potentially more directional changes.
Higher value
Produces:
smoother trend line;
slower reaction;
stronger filtering of small changes.
This parameter affects the displayed synthetic trend line.
It is separate from the HA Period used to smooth the original OHLC values.
7. SuperTrend Confirmation Filter
The second major component is TradingView's ATR-based SuperTrend calculation.
The SuperTrend uses two user-configurable parameters:
ATR Period
Factor
Default values:
ATR Period = 2
Factor = 2.0
SuperTrend constructs volatility-adjusted trailing boundaries around price.
The active trend direction changes when price moves sufficiently through the corresponding volatility boundary.
8. SuperTrend Direction
The script interprets the SuperTrend direction as:
Bullish
stDir < 0
Bearish
stDir > 0
The active bullish or bearish SuperTrend line is plotted independently.
A lightly shaded area between candle midpoint and the active SuperTrend boundary provides additional visual context.
9. ATR Period
The ATR Period controls how quickly the volatility measurement reacts to changing market conditions.
The default value is relatively short:
2 periods
Smaller ATR Period
Generally creates:
faster volatility adaptation;
more responsiveness to recent price movement.
Larger ATR Period
Generally creates:
smoother ATR values;
slower adaptation;
less sensitivity to individual short-term volatility changes.
Because the default setting is intentionally responsive, users should test longer ATR periods when applying the indicator to noisier instruments or lower timeframes.
10. SuperTrend Factor
The Factor controls the distance of the SuperTrend boundary from price.
Conceptually:
SuperTrend distance ∝ ATR × Factor
Therefore:
Lower Factor
Generally produces:
tighter SuperTrend boundaries;
faster trend changes;
more frequent directional transitions;
increased sensitivity to noise.
Higher Factor
Generally produces:
wider boundaries;
slower trend changes;
fewer transitions;
stronger filtering of smaller price movements.
So, similar to the Sensitivity concept in the previous indicators:
Higher Factor = generally fewer/slower SuperTrend transitions.
Lower Factor = generally more/faster transitions.
11. Dual-Confirmation Signal Logic
Signals require directional agreement between the synthetic price structure and SuperTrend.
Bullish agreement
A bullish state exists when:
synthetic open is below synthetic typical;
AND SuperTrend is bullish.
In simplified form:
Synthetic Bullish + SuperTrend Bullish = Long State
Bearish agreement
A bearish state exists when:
synthetic open is above synthetic typical;
AND SuperTrend is bearish.
In simplified form:
Synthetic Bearish + SuperTrend Bearish = Short State
Neither condition alone produces a signal.
12. Buy Signals
A Buy label appears when the indicator transitions into a new bullish agreement state.
This requires:
bullish synthetic trend;
bullish SuperTrend;
the combined bullish condition was not active on the previous bar;
the previous stored signal state was not already bullish.
Once the bullish state is recorded, repeated Buy labels are suppressed until the indicator first transitions into the opposite directional state.
This prevents the indicator from printing a Buy label on every bullish candle.
13. Sell Signals
A Sell label follows the inverse logic.
It requires:
bearish synthetic trend;
bearish SuperTrend;
a new bearish agreement state;
the previous stored state not already being bearish.
The persistent signal-state variable therefore allows the indicator to mark directional transitions rather than continuous conditions.
14. Why Two Trend Components Are Used
The two components measure trend differently.
Component Main role
Smoothed OHLC Reduces raw candle noise
Synthetic structure Measures directional price relationship
Synthetic trend line Visualizes smoothed structural direction
ATR/SuperTrend Volatility-adjusted trend confirmation
State engine Prevents duplicate signals
Buy/Sell labels Marks changes in confirmed direction
The synthetic component is derived primarily from smoothed price structure.
SuperTrend is driven by price plus volatility.
Requiring agreement therefore attempts to avoid treating a change in either calculation alone as sufficient confirmation.
15. Example Bullish Interpretation
Suppose the synthetic trend changes bullish.
That condition alone does not immediately require a Buy label.
The indicator also evaluates SuperTrend.
If SuperTrend remains bearish, the two systems disagree and no bullish signal is generated.
When both eventually satisfy:
Synthetic Trend = Bullish
and
SuperTrend = Bullish
a new bullish combined state can generate a Buy signal.
This structure is intended to filter some early synthetic transitions that occur before volatility-adjusted trend confirmation.
16. Example Bearish Interpretation
The same process applies inversely.
A bearish synthetic trend is insufficient by itself.
The SuperTrend direction must also be bearish.
Once both components agree and the indicator transitions from its previous state, a Sell signal can be displayed.
17. Signal Frequency
Signal frequency depends primarily on three parameters.
HA Period
Controls initial OHLC smoothing.
Higher values generally produce slower synthetic directional changes.
Smooth
Controls final smoothing of the synthetic midpoint trend line.
Higher values produce a smoother displayed trend line.
SuperTrend Factor
Controls volatility-boundary distance.
Higher values generally require a larger price movement before SuperTrend changes direction.
Because these parameters affect different parts of the framework, they should not be interpreted as interchangeable sensitivity controls.
18. Suggested Starting Parameters
The default configuration is:
HA Period: 14
Smooth: 2
ATR Period: 2
Factor: 2.0
These values provide a relatively responsive configuration.
Users working with particularly noisy instruments or very short timeframes may wish to test:
longer HA Periods;
longer ATR Periods;
larger SuperTrend Factors.
Users wanting faster response can experiment with smaller values.
No parameter combination is universally optimal.
19. Trend Line vs Signal
The main synthetic trend line and the Buy/Sell signals should not be interpreted as the same feature.
The trend line continuously reflects the synthetic structure.
Signals require additional SuperTrend agreement.
Therefore, the trend line can change directional state before a Buy or Sell label appears.
This difference is intentional.
20. Alerts
The indicator provides two alert conditions:
Buy Signal
Sell Signal
The Buy alert corresponds to a new bullish combined state.
The Sell alert corresponds to a new bearish combined state.
Alerts indicate only that the programmed conditions have been met.
They do not constitute independent trade recommendations.
21. Real-Time Behavior
The indicator evaluates information from the currently developing candle.
Consequently, conditions can evolve while a live candle is still open.
For traders who require confirmed signals, the safest interpretation is to evaluate the signal after the corresponding chart candle has closed.
The indicator should therefore not be marketed as universally non-repainting without additional restrictions or testing.
Historical conditions are naturally evaluated using completed bars, while a live candle can still change before closure.
22. No Higher-Timeframe Data Dependency
The current version does not request external symbols or higher-timeframe series.
Its calculations are based on the OHLC and volatility information of the chart on which it is applied.
This makes the indicator simpler than a multi-timeframe framework, but its behavior will still differ substantially according to the selected chart timeframe.
23. Timeframe Considerations
On lower timeframes:
market noise is greater;
synthetic trend changes may occur more frequently;
short ATR periods are more reactive;
SuperTrend reversals can occur more often.
On higher timeframes:
signals generally develop more slowly;
each transition represents a larger amount of underlying price movement.
Parameter values should therefore be evaluated independently for each timeframe and market.
24. Limitations
Alpha Trend Hunter is a reactive trend indicator.
It does not predict future price.
The underlying calculations use:
historical price;
current price;
moving averages;
ATR;
recursive synthetic values.
These calculations inherently react after price information becomes available.
A stronger degree of smoothing generally decreases noise but also increases lag.
25. Sideways-Market Limitation
The indicator is fundamentally trend-oriented.
During sideways or rapidly alternating conditions, both synthetic trend calculations and SuperTrend can produce repeated directional transitions.
The dual-confirmation requirement can reduce some isolated changes, but it cannot eliminate whipsaw risk.
The indicator does not contain a dedicated ADX or market-regime filter in its current version.
26. Risk Management
The indicator does not calculate:
position size;
account risk;
stop-loss placement;
reward/risk targets;
portfolio exposure.
Users must determine risk independently.
A Buy or Sell label indicates only a transition in the indicator's defined directional state.
27. What Alpha Trend Hunter Does Not Do
Alpha Trend Hunter does not:
execute orders;
connect to a brokerage account;
manage positions;
guarantee profitable signals;
predict exact tops or bottoms;
guarantee trend continuation;
identify institutional activity;
determine appropriate leverage;
determine individualized risk.
It is a technical-analysis and trend-visualization tool.
28. Intended Use
A practical workflow is:
use the synthetic trend line to observe the underlying smoothed direction;
observe the SuperTrend volatility regime;
wait for agreement between both components;
use the Buy/Sell transition as confirmation that a new combined state has formed;
evaluate market structure and personal risk independently before making any trading decision.
The indicator is designed to answer:
“Are smoothed price structure and volatility-adjusted trend currently pointing in the same direction?”
rather than:
“Will the next trade be profitable?”
Educational Purpose
Alpha Trend Hunter is intended for technical analysis, research and educational use.
Users should independently consider:
price structure;
volatility;
liquidity;
economic events;
timeframe;
execution conditions;
risk management.
Historical signals do not guarantee future results. Индикатор

DNSE VN301!, Bollinger Bands Break Out Strategy "Bollinger Bands Breakout with SMA Trend Filter" is a volatility breakout strategy designed to capture strong directional price movements when price breaks outside its recent trading range. The strategy uses Bollinger Bands, constructed from an SMA(20) and two standard deviations, to identify bullish breakouts when price closes above the upper band and bearish breakouts when price closes below the lower band.
To improve signal quality, the strategy incorporates an optional SMA(200) trend filter, allowing Long trades only when the SMA is rising and Short trades only when it is falling. By combining volatility-based breakout signals with long-term trend confirmation, the strategy seeks to reduce false breakouts during ranging markets while participating in sustained intraday trends. It also includes configurable stop loss, take profit, trading session filters, automatic end-of-day position closure, and trend reversal exits for disciplined risk management.
Strategy settings and configuration:
Chart timeframe: recommended 5-minute chart
Position size: 3 contracts
Bollinger Bands length: 20
Bollinger Bands multiplier: 2.0
SMA length: 200
Stop loss: 10 points
Take profit: disabled
SMA trend filter: On / Off
Take profit: On / Off
Time filter: On / Off
Trading session: 09:00 – 14:30
Trade direction: Long / Short / Both
Default script settings:
The strategy calculates Bollinger Bands using the SMA(20) of the closing price. The upper and lower bands are created by adding or subtracting two standard deviations around the middle line.
When volatility increases, the Bollinger Bands expand. When the market is quiet or moving sideways, the bands contract.
When the closing price breaks above the upper Bollinger Band, buying pressure may be taking control. When the closing price breaks below the lower Bollinger Band, selling pressure may be taking control.
When the SMA(200) trend filter is enabled, the script only allows Long trades when SMA(200) is rising and only allows Short trades when SMA(200) is falling. When the SMA filter is disabled, the strategy can trade both directions based only on Bollinger Bands breakout signals.
Users can add the built-in Bollinger Bands indicator on TradingView with Length 20 and Multiplier 2.0 to visually monitor the signal on the price chart.
Entry and exit rules:
Long entry:
Closing price > upper Bollinger Band
AND SMA(200) is rising, if the SMA filter is enabled
AND the signal appears during the trading session
AND trade direction allows Long entries
Long exit:
Stop loss: 10 points from entry price
Take profit: disabled by default
Closing price touches or breaks below the lower Bollinger Band
SMA(200) turns downward, if the SMA filter is enabled
Reversal when a valid Short signal appears
Automatic position close at the end of the trading session
Short entry:
Closing price < lower Bollinger Band
AND SMA(200) is falling, if the SMA filter is enabled
AND the signal appears during the trading session
AND trade direction allows Short entries
Short exit:
Stop loss: 10 points from entry price
Take profit: disabled by default
Closing price touches or breaks above the upper Bollinger Band
SMA(200) turns upward, if the SMA filter is enabled
Reversal when a valid Long signal appears
Automatic position close at the end of the trading session
Risk disclaimer:
Futures trading involves a high level of risk and prices can move sharply. This script is provided for reference, research, and backtesting purposes only. Users should fully understand derivatives trading, their own risk tolerance, and the strategy logic before applying it to live trading.
All investment decisions are the responsibility of the user. phaisinh.online is not responsible for any losses arising from the use of this strategy in real trading. Past performance does not guarantee future results.
____________________________________________________________________
"Bollinger Bands Breakout với Bộ lọc Xu hướng SMA" là một chiến lược giao dịch theo xu hướng dựa trên sự bứt phá của biến động giá, được thiết kế nhằm nắm bắt các chuyển động mạnh theo một hướng khi giá vượt ra khỏi vùng dao động gần nhất. Chiến lược sử dụng Bollinger Bands, được xây dựng từ SMA(20) và 2 độ lệch chuẩn, để xác định tín hiệu mua khi giá đóng cửa vượt lên trên dải trên và tín hiệu bán khi giá đóng cửa xuống dưới dải dưới.
Để nâng cao chất lượng tín hiệu, chiến lược tích hợp bộ lọc xu hướng SMA(200) (có thể bật hoặc tắt), chỉ cho phép mở vị thế Long khi SMA đang dốc lên và vị thế Short khi SMA đang dốc xuống. Bằng cách kết hợp tín hiệu bứt phá theo biến động của Bollinger Bands với xác nhận xu hướng dài hạn, chiến lược hướng tới việc giảm thiểu các tín hiệu phá vỡ giả trong giai đoạn thị trường đi ngang, đồng thời tận dụng các xu hướng intraday kéo dài. Ngoài ra, chiến lược còn bao gồm các tùy chọn Stop Loss, Take Profit, bộ lọc khung thời gian giao dịch, cơ chế tự động đóng toàn bộ vị thế khi kết thúc phiên, cùng với điều kiện thoát lệnh khi xu hướng SMA đảo chiều, nhằm đảm bảo quản trị rủi ro một cách chặt chẽ và có kỷ luật.
Cài đặt & cấu hình chiến lược:
Biểu đồ: khuyến nghị khung 5 phút
Khối lượng giao dịch: 3 hợp đồng
Chu kỳ Bollinger Bands: 20
Hệ số nhân Bollinger Bands: 2.0
Chu kỳ SMA: 200
Cắt lỗ: 10 điểm
Chốt lời: tắt
Bộ lọc xu hướng SMA: Bật / Tắt
Dùng chốt lời: Bật / Tắt
Bộ lọc giờ: Bật / Tắt
Khung giờ giao dịch: 09:00 – 14:30
Chiều giao dịch: Mua / Bán / Cả hai
Cài đặt mặc định của script:
Chiến lược tính toán Bollinger Bands dựa trên đường SMA(20) của giá đóng cửa. Dải trên và dải dưới được tạo bằng cách cộng hoặc trừ hai độ lệch chuẩn quanh đường giữa.
Khi biến động tăng mạnh, hai dải Bollinger Bands sẽ mở rộng. Khi thị trường đi ngang hoặc biến động thấp, hai dải sẽ co hẹp lại.
Khi giá đóng cửa vượt lên trên dải trên Bollinger Bands, lực mua có thể đang chiếm ưu thế. Khi giá đóng cửa phá xuống dưới dải dưới Bollinger Bands, lực bán có thể đang chiếm ưu thế.
Khi bật bộ lọc xu hướng SMA(200), script chỉ cho phép lệnh Mua khi SMA(200) dốc lên và chỉ cho phép lệnh Bán khi SMA(200) dốc xuống. Khi tắt bộ lọc SMA, chiến lược có thể giao dịch cả hai chiều chỉ dựa trên tín hiệu breakout của Bollinger Bands.
Người dùng có thể thêm chỉ báo Bollinger Bands có sẵn trên TradingView với tham số Length 20 và Multiplier 2.0 để quan sát tín hiệu trực quan trên biểu đồ giá.
Điều kiện vào và thoát lệnh:
Vào lệnh Mua:
Giá đóng cửa > dải trên Bollinger Bands
VÀ SMA(200) dốc lên, nếu bật bộ lọc SMA
VÀ tín hiệu xuất hiện trong khung giờ giao dịch
VÀ chiều giao dịch cho phép lệnh Mua
Thoát lệnh Mua:
Cắt lỗ: 10 điểm từ giá vào lệnh
Chốt lời: không dùng theo mặc định
Giá đóng cửa chạm hoặc phá xuống dải dưới Bollinger Bands
SMA(200) đảo chiều xuống, nếu bật bộ lọc SMA
Đảo chiều khi xuất hiện tín hiệu Bán hợp lệ
Tự động đóng lệnh khi hết khung giờ giao dịch
Vào lệnh Bán:
Giá đóng cửa < dải dưới Bollinger Bands
VÀ SMA(200) dốc xuống, nếu bật bộ lọc SMA
VÀ tín hiệu xuất hiện trong khung giờ giao dịch
VÀ chiều giao dịch cho phép lệnh Bán
Thoát lệnh Bán:
Cắt lỗ: 10 điểm từ giá vào lệnh
Chốt lời: không dùng theo mặc định
Giá đóng cửa chạm hoặc phá lên dải trên Bollinger Bands
SMA(200) đảo chiều lên, nếu bật bộ lọc SMA
Đảo chiều khi xuất hiện tín hiệu Mua hợp lệ
Tự động đóng lệnh khi hết khung giờ giao dịch
Tuyên bố rủi ro:
Giao dịch hợp đồng tương lai có mức độ rủi ro cao và giá có thể biến động mạnh. Script này chỉ phục vụ mục đích tham khảo, nghiên cứu và kiểm thử. Người dùng cần hiểu rõ giao dịch phái sinh, khẩu vị rủi ro cá nhân và logic của chiến lược trước khi áp dụng vào giao dịch thực tế.
Mọi quyết định đầu tư thuộc trách nhiệm của người dùng. phaisinh.online không chịu trách nhiệm cho bất kỳ khoản lỗ nào phát sinh từ việc sử dụng chiến lược này trong giao dịch thực tế. Hiệu quả trong quá khứ không đảm bảo kết quả trong tương lai.
Стратегия

Automated Liquidity & Key Levels Matrix PROAutomated Liquidity & Key Levels Matrix PRO
Automated Liquidity & Key Levels Matrix PRO is an advanced, multi functional technical analysis script designed for quantitative traders and technical analysts. It automatically isolates high probability support and resistance zones, tracks real time market structure breakouts with split line clarity, highlights high volume expansion candles, and provides an attractive glowing trend wave layer.
Key Features Overview
1. Ultra Attractive Glowing Trend Wave
Includes a smooth dynamic trend wave with adjustable halo glow effects, line width, and colors to easily visualize dynamic trend direction.
2. Clean Split Line Market Structure Signals
Features refined Break of Structure and Change of Character signals. The structure line splits cleanly around the centered label, leaving a gap so the text stands out clearly without line overlap.
3. Text Free Clean Major Swing Badges
Isolates major macro swing high and low extremes using text free, solid color directional badges to keep chart visuals clean and minimal.
4. Dynamic Support and Resistance Zones
Automatically maps key supply and demand ranges across price action. To keep your chart clean and easy to read, broken or mitigated zones automatically disappear as soon as price breaks through them.
5. Volume Weighted Smart Candlestick Heatmap
Combines dynamic structural trend direction with volume expansion detection. High volume expansion bars render in distinct neon pink highlights for instant volatility identification.
6. Comprehensive Customization Panel
Includes independent controls for line thickness, text colors, line colors, font sizes, wave parameters, and zone fill opacity.
How to Use
Step 1: Trend Identification
Observe the Glowing Trend Wave and Volume Weighted Smart Candlestick theme to gauge underlying trend direction.
Step 2: Monitor Dynamic Key Zones
Look for price interactions around active, unmitigated support and resistance zones.
Step 3: Analyze Clean Structure Signals
Watch for Break of Structure and Change of Character signals displayed with split lines and centered labels.
Settings Overview
Glowing Wave Settings
- Show Glowing Wave Layer: Toggle display of the dynamic trend wave.
- Wave Period & Line Thickness: Adjust wave sensitivity and visual halo glow.
Market Structure Settings
- Show Breakout Signals: Toggle structural lines and labels.
- Independent Colors & Sizes: Customize BOS/CHoCH line colors, text colors, and font sizes separately.
Support and Resistance Settings
- Show Dynamic Support & Resistance: Toggle zone rectangles.
- Zone Fill Transparency: Customize fill opacity from 0 to 100.
Major Swing Settings
- Show Clean Major Swing Badges: Toggle text free ITH/ITL pivot badges.
Disclaimer
This script is built strictly for educational, analytical, and charting enhancement purposes. It does not provide financial advice, trade recommendations, or guaranteed results. Always practice proper risk management. Индикатор

Morne's Multi-TF Fib + MA + BB + StochasticMulti-Timeframe Fibonacci + MA + Bollinger Bands + Stochastic
OVERVIEW
An all-in-one overlay that combines two independent, timeframe-locked Fibonacci
grids with a standard trend and momentum toolkit, so you can read higher-timeframe
structure without leaving your working chart.
WHAT IT PLOTS
- Annual Fibonacci (yellow) — anchored to the PREVIOUS full calendar year's high
and low, sourced from a configurable timeframe (Weekly by default). Recalculates
once a year and then stays fixed, giving you the macro yearly range.
- Weekly Fibonacci (red, or a per-level palette) — anchored to the CURRENT rolling
week's high and low, sourced from H4 by default. Updates live through the week.
- Both grids auto-detect direction (whether the high or the low formed first) and
plot the full set: 0, 23.6, 50, 61.8, 78.6, 88.6, 100, plus 127 / 161.8 and
-127 / -161.8 extensions.
- Two moving averages (21 & 100 by default; SMA / EMA / SMMA / LWMA selectable).
- Bollinger Bands (20, 2 deviations).
- Stochastic oscillator (50, 24, 1) in a separate lower pane.
Because the two Fib layers are locked to their source timeframes, they render
correctly on ANY chart timeframe — view an H1 chart and still see the weekly- and
H4-derived grids, correctly scaled.
HOW TO USE IT
Treat the yearly grid as macro structure and the weekly grid as intraweek structure.
Confluence — where a yearly level, a weekly level, a moving average, or a band edge
line up — is where these levels are most worth watching. The MAs and Stochastic add
trend and momentum context around them.
SETTINGS
Every layer has independent on/off toggles, colour, line width, line style, label
size, and left/right bar extension. The Weekly grid can be a single colour or a
per-level palette. All periods and methods are editable via inputs.
NOTES
The weekly reset uses a Monday 00:00 UTC boundary; adjust the source timeframes to
suit your instrument. This script is an analysis tool, not financial advice. Индикатор

Индикатор

Efficiency Ratio Adaptive Moving Average (ERAMA)Efficiency Ratio Adaptive Moving Average (ERAMA)
Efficiency Ratio Adaptive Moving Average (ERAMA) is a smooth adaptive moving average that uses Kaufman's Efficiency Ratio to shift between fast and slow EMA behavior. It then applies WMA and EMA smoothing followed by length-adjusted lag reduction.
The objective is to combine three useful properties in one line: adapt to the directional efficiency of recent price movement, maintain a visually stable baseline, and recover part of the delay introduced by smoothing. ERAMA adjusts the balance between smoothness and responsiveness using current and historical data.
How ERAMA Is Calculated
1. Efficiency Ratio
ERAMA first measures how efficiently the selected Source has moved over the ER Length:
Change = |Source − Source from ER Length bars ago|
Volatility = Sum of |Source − Previous Source| over the ER Length
ER = Change ÷ Volatility
The Efficiency Ratio is bounded between 0 and 1:
• ER near 1 — most movement contributed to net progress in one direction
• ER near 0 — price traveled back and forth with little net progress
Because both Change and Volatility scale with price movement, ER is independent of the instrument's nominal price level.
2. Efficiency-Adaptive EMA Blend
The Fast and Slow lengths create two conventional EMAs of the selected Source:
Fast EMA = EMA(Source, Fast Length)
Slow EMA = EMA(Source, Slow Length)
ERAMA blends these two lines using the current Efficiency Ratio:
Adaptive = Slow EMA + ER × (Fast EMA − Slow EMA)
When ER is high, Adaptive moves closer to the Fast EMA. When ER is low, it stays closer to the Slow EMA. Intermediate ER values produce a proportional blend between the two.
This construction uses Kaufman's Efficiency Ratio as an adaptive weight, but it is not the standard recursive Kaufman Adaptive Moving Average (KAMA) formula.
3. WMA and EMA Smoothing
The adaptive blend passes through two smoothing stages:
WMA Base = WMA(Adaptive, WMA Smooth Length)
Smoothed = EMA(WMA Base, EMA Smooth Length)
The WMA gives greater weight to recent observations. The following EMA softens residual variation and determines the main output horizon. Higher values create a steadier line but also introduce more delay.
4. Length-Adjusted Lag Reduction
ERAMA compares the Smoothed line with an EMA-smoothed version of itself:
Responsiveness Scale = Min(1, 50 ÷ EMA Length)^Responsiveness Length Decay
Effective Responsiveness = Responsiveness × Responsiveness Scale
ERAMA = Smoothed + Effective Responsiveness ×
The difference between Smoothed and EMA(Smoothed) acts as a DEMA-style lag correction. A Responsiveness value of 0 disables this correction. A value of 1 applies the full correction before length scaling.
For EMA lengths of 50 or less, Responsiveness Scale equals 1. Above 50, the scale decreases gradually according to Responsiveness Length Decay. This keeps one Responsiveness setting practical across short and long EMA lengths. A decay value of 0 disables length-based scaling.
The Mathematical Idea
ERAMA separates adaptation, smoothing, and lag reduction into distinct stages.
The Efficiency Ratio controls the position between two already-defined EMA responses. WMA and EMA then create a stable output baseline. Finally, a partial DEMA-style correction restores part of the response lost to smoothing. The correction is reduced progressively for longer EMA lengths, where the distance between a line and its second EMA can otherwise become disproportionately large.
This is a causal construction: every stage uses only current and past data. The lag-reduction term can increase turning sensitivity and may create overshoot at aggressive settings, but the Responsiveness and Responsiveness Length Decay controls make that tradeoff explicit.
Characteristics and Advantages
• Efficiency-based adaptation using a bounded 0-to-1 ratio
• Interpretable Fast and Slow EMA anchors
• WMA and EMA smoothing for a stable visual baseline
• Adjustable partial-DEMA lag reduction
• Automatic responsiveness scaling for longer EMA lengths
How to Read ERAMA
Read ERAMA through its slope, its position relative to price, and the behavior of price around the line.
Slope
A rising ERAMA indicates that the smoothed adaptive baseline is moving higher. A falling ERAMA indicates that it is moving lower. A flattening line suggests weaker directional progress or a transition between trend phases.
Price Position
Price holding above a rising ERAMA supports a bullish directional interpretation. Price holding below a falling ERAMA supports a bearish interpretation. Repeated crossings often occur when price is rotating around the adaptive baseline or directional control is weak.
Distance and Reversals
A widening distance between price and ERAMA can reflect strong momentum or extension from the baseline. The lag-reduction stage helps ERAMA respond sooner when the smoothed path turns.
Understanding the Settings
Source
Selects the price series used by ERAMA. The default is HLCC4: the average of High, Low, Close, and Close.
ER Length
Controls the period used to measure directional efficiency. Lower values react to recent path changes sooner. Higher values evaluate efficiency over a broader window.
Fast Length
Sets the Fast EMA used by the adaptive blend. Lower values make the high-efficiency response faster. Fast Length must be lower than Slow Length.
Slow Length
Sets the Slow EMA used by the adaptive blend. Higher values make the low-efficiency response more conservative. Slow Length must be higher than Fast Length.
Responsiveness
Controls the strength of the lag-reduction term. A value of 0 uses the fully smoothed line. Higher values reduce more lag but can increase turning sensitivity and overshoot.
Responsiveness Length Decay
Controls how strongly Responsiveness decreases for EMA lengths above 50. Higher values apply more reduction to long-period lines. A value of 0 uses the same Responsiveness at every EMA length.
WMA Smooth Length
Controls the first smoothing stage. Higher values produce a steadier line with more delay.
EMA Smooth Length
Controls the primary output horizon and the period used by the lag-reduction EMA. Higher values create a smoother, slower baseline.
Default Configuration
Source: HLCC4
ER Length: 10
Fast Length: 2
Slow Length: 30
Responsiveness: 0.88
Responsiveness Length Decay: 0.15
WMA Smooth Length: 12
EMA Smooth Length: 20
Practical Use
ERAMA can serve as an adaptive trend baseline, directional filter, pullback reference, or trade-management guide. It is intended for traders who prefer to interpret slope and price structure directly.
Responsiveness can be tuned to emphasize steadier trend tracking or earlier reactions to short-term changes. The settings can be adapted to the instrument, timeframe, and intended holding period.
---
Efficiency Ratio Adaptive Moving Average (ERAMA)
Efficiency Ratio Adaptive Moving Average(效率比率自適應移動平均線)是一條平滑的自適應移動平均線。它利用考夫曼效率比率(Efficiency Ratio),在快速與慢速 EMA 之間調整,再依次套用 WMA、EMA 平滑及按長度調整的延遲縮減。
ERAMA 的目標,是在一條線內結合三項特性:根據近期價格移動的方向效率作出適應、維持視覺穩定的基準,以及追回部分平滑所造成的延遲。ERAMA 使用目前及歷史資料,調整平滑度與反應速度之間的平衡。
ERAMA 如何計算
1. 效率比率
ERAMA 先衡量所選 Source 在 ER Length 期間內的移動效率:
變化 = |目前 Source − ER Length 之前的 Source|
波動 = ER Length 內每根 K 線之 |Source − 前一個 Source| 總和
ER = 變化 ÷ 波動
效率比率保持在 0 至 1 之間:
• ER 接近 1 — 大部分移動形成單一方向的淨進展
• ER 接近 0 — 價格反覆來回,總路徑較長但淨進展有限
由於變化與波動都會隨價格移動幅度同比例改變,因此 ER 不受商品名義價格水平影響。
2. 效率自適應 EMA 混合
Fast 與 Slow 長度會從所選 Source 建立兩條傳統 EMA:
Fast EMA = EMA(Source,Fast Length)
Slow EMA = EMA(Source,Slow Length)
ERAMA 使用目前的效率比率混合兩條線:
Adaptive = Slow EMA + ER ×(Fast EMA − Slow EMA)
ER 偏高時,Adaptive 會靠近 Fast EMA;ER 偏低時,則靠近 Slow EMA。介乎兩者之間的 ER 會按比例混合兩條 EMA。
這個結構使用考夫曼效率比率作為自適應權重,但並不是標準的遞迴考夫曼自適應移動平均線(KAMA)公式。
3. WMA 與 EMA 平滑
自適應混合結果會通過兩層平滑:
WMA Base = WMA(Adaptive,WMA Smooth Length)
Smoothed = EMA(WMA Base,EMA Smooth Length)
WMA 對較近期數值給予更高權重,後續 EMA 則柔化剩餘變化,並決定主要輸出週期。較高數值會令線條更穩定,但亦會增加延遲。
4. 按長度調整的延遲縮減
ERAMA 會比較 Smoothed 與其 EMA 平滑版本:
Responsiveness Scale = Min(1,50 ÷ EMA Length)^Responsiveness Length Decay
Effective Responsiveness = Responsiveness × Responsiveness Scale
ERAMA = Smoothed + Effective Responsiveness ×
Smoothed 與 EMA(Smoothed)之間的差值形成 DEMA 式延遲修正。Responsiveness 設為 0 會停用修正;設為 1 則代表在長度縮放前套用完整修正。
EMA Length 為 50 或以下時,Responsiveness Scale 等於 1。高於 50 後,縮放值會按照 Responsiveness Length Decay 逐步下降,令同一組 Responsiveness 設定可以較合理地跨越短期及長期 EMA 使用。Decay 設為 0 會停用按長度縮放。
數學設計
ERAMA 把自適應、平滑及延遲縮減分成三個獨立階段。
效率比率控制結果在兩條既定 EMA 反應之間的位置;WMA 與 EMA 形成穩定輸出基準;最後的部分 DEMA 式修正,追回一部分因平滑而失去的反應速度。對較長 EMA 而言,線條與其第二層 EMA 之間的差距可能較大,因此修正會隨長度逐步降低。
整個結構只使用目前及過往資料。延遲縮減可提高轉向靈敏度,較進取的設定亦可能產生超調;Responsiveness 與 Responsiveness Length Decay 讓這項取捨可以直接調整。
特性與優點
• 使用 0 至 1 有界效率比率作出適應
• Fast 與 Slow EMA 具有清晰可解釋的反應界線
• WMA 與 EMA 平滑形成穩定視覺基準
• 可調整的部分 DEMA 式延遲縮減
• 長週期 EMA 自動降低反應修正
如何閱讀 ERAMA
閱讀 ERAMA 時,應觀察線條斜率、價格相對位置,以及價格在線條附近的行為。
斜率
ERAMA 上升表示平滑後的自適應基準正在提高;ERAMA 下跌表示基準正在降低。線條逐漸走平,通常代表方向進展減弱,或市場正處於趨勢轉換階段。
價格位置
價格維持在上升 ERAMA 之上,可支持偏多方向判斷;價格維持在下降 ERAMA 之下,可支持偏空判斷。價格反覆穿越 ERAMA,通常出現在價格圍繞自適應基準旋轉,或方向控制偏弱的市況。
距離與轉向
價格與 ERAMA 的距離擴大,可能反映動能增強或價格已偏離基準。延遲縮減讓 ERAMA 在平滑路徑轉向時較早反應。
設定說明
Source
選擇 ERAMA 使用的價格序列。預設為 HLCC4,即 High、Low、Close、Close 的平均值。
ER Length
控制衡量方向效率的期間。較低數值會更快反映近期路徑變化;較高數值則在較廣時間範圍內評估效率。
Fast Length
設定自適應混合使用的 Fast EMA。較低數值會加快高效率市況下的反應。Fast Length 必須低於 Slow Length。
Slow Length
設定自適應混合使用的 Slow EMA。較高數值會令低效率市況下的反應更保守。Slow Length 必須高於 Fast Length。
Responsiveness
控制延遲縮減項的強度。設為 0 時使用完整平滑後的線條;較高數值會追回更多延遲,但亦可能提高轉向靈敏度及超調。
Responsiveness Length Decay
控制 EMA Length 高於 50 後,Responsiveness 隨長度下降的幅度。較高數值會對長週期線條施加更大降幅;設為 0 則所有 EMA Length 使用相同 Responsiveness。
WMA Smooth Length
控制第一層平滑。較高數值會形成更穩定但延遲更多的線條。
EMA Smooth Length
控制主要輸出週期,以及延遲縮減 EMA 所使用的週期。較高數值會形成更平滑、較慢的基準。
預設設定
Source:HLCC4
ER Length:10
Fast Length:2
Slow Length:30
Responsiveness:0.88
Responsiveness Length Decay:0.15
WMA Smooth Length:12
EMA Smooth Length:20
實際應用
ERAMA 可作為自適應趨勢基準、方向過濾器、回調參考或交易管理線,適合希望直接解讀斜率及價格結構的交易者。
Responsiveness 可用來偏向更穩定的趨勢跟隨,或更早反映短期變化。設定可按商品、時間週期及預計持倉時間調整。
---
Efficiency Ratio Adaptive Moving Average (ERAMA)
Efficiency Ratio Adaptive Moving Average(効率比適応型移動平均線)は、カウフマンの効率比(Efficiency Ratio)を利用して速いEMAと遅いEMAの挙動を動的に切り替える、滑らかな適応型移動平均線です。WMA(加重移動平均)とEMA(指数移動平均)による平滑化を行った後、期間長に連動したラグ(遅延)削減処理を適用します。
ERAMAの目的は、3つの有用な特性を1本のラインに統合することです。すなわち、近年の価格値動きの方向性効率に適応すること、視覚的に安定したベースラインを維持すること、そして平滑化によって生じる遅延の一部を取り戻すことです。ERAMAは、現在および過去のデータを用いて平滑性と応答性のバランスを調整します。
ERAMA の計算方法
1. 効率比(Efficiency Ratio)
ERAMAはまず、選択された Source が ER Length 期間内にどれほど効率的に動いたかを測定します。
変化量 = |現在の Source − ER Length 本前の Source|
変動量 = ER Length 期間内の各バーにおける |Source − 前回の Source| の総和
効率比(ER)= 変化量 ÷ 変動量
効率比(ER)は 0 から 1 の範囲に収まります。
• ERが 1 に近い — 値動きの大半が一定方向への純粋な推進に寄与している
• ERが 0 に近い — 価格が反覆移動を繰り返し、総移動距離に対して純推進がほとんどない
変化量と変動量の双方が価格の移動規模に応じてスケールするため、ERは銘柄固有の価格水準(呼び値)に依存しません。
2. 効率適応型 EMA ブレンド
Fast Length と Slow Length のパラメータにより、選択した Source から2つの従来の EMA を作成します。
Fast EMA = EMA(Source, Fast Length)
Slow EMA = EMA(Source, Slow Length)
ERAMAは、現在の効率比(ER)を用いてこれら2つのラインをブレンドします。
Adaptive = Slow EMA + ER ×(Fast EMA − Slow EMA)
ERが高いとき、Adaptiveは Fast EMA に近づきます。ERが低いとき、Slow EMA の近くにとどまります。中間のER値では、2つのEMA間で比例的なブレンドが行われます。
この構造はカウフマンの効率比を適応型ウェイトとして使用していますが、標準的な再帰型カウフマン自適応移動平均線(KAMA)の計算式とは異なります。
3. WMA および EMA による平滑化
自適応ブレンド(Adaptive)は、2段階の平滑化処理を通過します。
WMA Base = WMA(Adaptive, WMA Smooth Length)
Smoothed = EMA(WMA Base, EMA Smooth Length)
WMAは直近のデータに高い重みを置きます。続くEMAは残留変動をなめらかにし、主要な出力周期(時間軸)を決定します。数値を高く設定するほどラインは安定しますが、遅延も大きくなります。
4. 期間長に応じたラグ(遅延)削減
ERAMAは、Smoothed ラインと、それをさらにEMA平滑化したラインを比較します。
Responsiveness Scale = Min(1, 50 ÷ EMA Length)^Responsiveness Length Decay
Effective Responsiveness = Responsiveness × Responsiveness Scale
ERAMA = Smoothed + Effective Responsiveness ×
Smoothed と EMA(Smoothed)の差分は、DEMA(二重指数移動平均)スタイルのラグ補正として機能します。Responsiveness を 0 に設定するとこの補正は無効になり、1 に設定すると期間長のスケーリングが適用される前の完全な補正が行われます。
EMA Length が 50 以下のケースでは、Responsiveness Scale は 1 となります。50 を超えると、Responsiveness Length Decay に従ってスケーリング値が徐々に低下します。これにより、短期から長期のEMA期間まで同一の Responsiveness 設定を合理的に運用できます。Decay を 0 に設定すると、期間長に基づくスケーリングが無効になります。
数学的概念と設計思想
ERAMAは「適応」「平滑化」「ラグ削減」を独立した段階として明確に分離しています。
効率比(ER)が、あらかじめ定義された2つのEMA応答の間の位置を制御します。次にWMAとEMAが安定した出力ベースラインを形成します。最後に、部分的なDEMAスタイル補正によって、平滑化で失われた応答速度の一部を取り戻します。長期間のEMAでは、ラインとその2次EMAの間の乖離が過大になる可能性があるため、補正量は長さに応じて段階的に削減されます。
これは完全な因果的構造であり、すべての段階で現在および過去のデータのみを使用します。ラグ削減機能は転換の感度を高める一方で、アグレッシブな設定ではオーバーシュートを引き起こす可能性がありますが、Responsiveness と Responsiveness Length Decay のコントロールにより、このトレードオフを明示的に調整できます。
特徴とメリット
• 0〜1 の有界な効率比に基づく自適応性
• 明確に解釈可能な Fast および Slow EMA アンカー
• 安定した視覚的ベースラインを形成する WMA および EMA 平滑化
• 調整可能な部分 DEMA スタイル・ラグ削減
• 長期 EMA 期間におけるレスポンス補正の自動スケーリング
ERAMA の読み方・分析方法
ERAMAを読み解く際は、ラインの傾き、価格の相対位置、そしてライン周辺での価格の挙動に着目します。
傾き(スロープ)
ERAMAの上昇は、平滑化された自適応ベースラインが切り上がっていることを示します。ERAMAの下降は、ベースラインが切り下がっていることを示します。ラインの平坦化は、方向性の勢いの減衰、またはトレンドの移行期を示唆します。
価格の位置関係
価格が上昇するERAMAの上方で推移している場合は強気(ブル)の方向性を支持し、下降するERAMAの下方で推移している場合は弱気(ベア)の方向性を支持します。ERAMAとの頻繁な交差(クロスオーバー)は、価格がベースライン付近で保ち合いを形成しているか、方向性の主導権が弱い状態によく見られます。
乖離と反転
価格とERAMAとの距離が拡大している場合は、強力なモメンタムまたはベースラインからの乖離を反映しています。ラグ削減ステージにより、平滑化された軌跡が反転する際、ERAMAはより早期に反応することができます。
設定パラメータの理解
Source
ERAMAで使用する価格シリーズを選択します。デフォルトは HLCC4(High, Low, Close, Close の平均値)です。
ER Length
方向性の効率(Efficiency Ratio)を測定する期間を制御します。値が小さいほど直近の値動きの変化に素早く反応し、値が大きいほど広い期間で効率性を評価します。
Fast Length
適応ブレンドで使用する Fast EMA を設定します。値が小さいほど、高効率相場での反応が速くなります。Fast Length は Slow Length より小さく設定する必要があります。
Slow Length
適応ブレンドで使用する Slow EMA を設定します。値が大きいほど、低効率相場での反応が控えめになります。Slow Length は Fast Length より大きく設定する必要があります。
Responsiveness
ラグ削減項の強度を制御します。0 に設定すると完全に平滑化されたラインを使用します。高い値を設定するほどラグが解消されますが、転換時の感度やオーバーシュートが増加する場合があります。
Responsiveness Length Decay
EMA Length が 50 を超えた際に、Responsiveness が減衰する度合いを制御します。高い値を設定するほど長期ラインへの減衰が強く適用されます。0 に設定すると、すべての EMA Length で同じ Responsiveness が適用されます。
WMA Smooth Length
第1段階の平滑化期間を制御します。値が大きいほど、より遅延のある安定したラインを生成します。
EMA Smooth Length
主要な出力周期およびラグ削減用 EMA の期間を制御します。値が大きいほど、より平滑で緩やかなベースラインを生成します。
デフォルト設定
Source: HLCC4
ER Length: 10
Fast Length: 2
Slow Length: 30
Responsiveness: 0.88
Responsiveness Length Decay: 0.15
WMA Smooth Length: 12
EMA Smooth Length: 20
実戦での活用方法
ERAMAは、自適応型のトレンドベースライン、方向性フィルター、押し目・戻りの参照線、あるいはトレード管理ガイドとして活用できます。ラインの傾きや価格構造を直接解釈することを好むトレーダーに適しています。
Responsiveness をチューニングすることで、安定したトレンド追従を重視するか、短期的な変化への早期反応を重視するかを調整できます。設定は取引銘柄、時間軸、および想定する保有期間に応じて最適化することが可能です。
Индикатор

MA Stack (Multi-Timeframe Moving Averages)WHAT IT DOES
MA Stack replaces the usual clutter of adding moving averages to a chart one by one. It plots up to five moving averages in a single indicator. Each moving average can have its own type, length, timeframe, offset and color.
The script adds three optional visual layers:
• Fills between adjacent moving averages. The area is green when the faster MA is above the slower MA and orange when it is below. This makes compression, expansion and crossovers of the MA stack easier to recognize.
• Trend background, disabled by default. The background is green when the fastest MA is above every slower MA, red when it is below all of them, and yellow when the stack has a mixed order.
• Slope projections. Each moving average is extended into the future with a dotted line based on its latest one-bar slope. The projection always uses the same color as its moving average. It is a visual extrapolation, not a price forecast or trading signal.
HOW IT WORKS
Each of the five MA slots calculates one moving average using the selected source, type and length. The available types are SMA, EMA, WMA, VWMA, HMA and RMA.
Each slot can use the chart timeframe or a separate higher timeframe. Higher-timeframe calculations use confirmed values with lookahead disabled. In real time, the script uses the previous confirmed higher-timeframe value, so the higher-timeframe lines update after confirmation rather than following an unfinished higher-timeframe bar.
The slope projection takes the latest one-bar change in the moving average and extends that change over the selected projection length, which is 10 bars by default. The script maintains one projection line per moving average and updates it in place, preventing old projection lines from accumulating on the chart.
PRESETS
The presets provide commonly used moving-average combinations:
• Classic 20/50/200 SMA — short-, medium- and long-term simple moving averages.
• EMA Ribbon 8/13/21/34/55 — a Fibonacci-spaced EMA ribbon for observing compression, expansion and changes in trend structure.
• Golden Cross 50/200 SMA — the traditional pair used to identify golden-cross and death-cross conditions. The fill changes color when the averages cross.
• Scalping 9/21 EMA — a fast EMA pair intended for observing short-term momentum.
• Swing 10/20/50 EMA — three exponential moving averages for observing multi-day trend structure.
• Multi-TF Trend (21/50 EMA, D+W) — the 21 and 50 EMA from the Daily timeframe together with the 21 and 50 EMA from the Weekly timeframe. This preset makes it possible to compare price with both higher-timeframe structures on one chart.
• Bitcoin Support Band (20W SMA / 21W EMA) — the 20-week SMA and 21-week EMA, calculated from Weekly data regardless of the chart timeframe.
Select Manual to configure all five MA slots individually. Manual settings include enable or disable, MA type, length, timeframe, offset and color. Colors, offsets, line width and visual controls remain available when a preset is selected.
SETTINGS
• Preset and Source — select a preset and the price source used in all calculations.
• MA 1 to MA 5 — configure each slot's status, type, length, timeframe, offset and color. An empty timeframe uses the chart timeframe. These calculation settings are used when Preset is set to Manual; colors and offsets remain available for presets.
• Visuals — enable or disable fills, the trend background and slope projections; set the projection length and line width. The trend background is disabled by default.
HOW TO USE IT
Use a preset when you want a familiar MA combination without configuring every line manually. Use Manual mode when you need different MA types, periods or timeframes.
The relative order of the moving averages can help organize trend context:
• A faster MA above the slower averages indicates bullish alignment.
• A faster MA below the slower averages indicates bearish alignment.
• A mixed or compressed stack indicates that trend direction is less clearly aligned.
These observations are descriptive, not entry or exit signals. They should be combined with the user's own market analysis and risk management.
LIMITATIONS
• The slope projection is a straight-line extrapolation of the latest change in an MA. It does not predict future prices.
• Higher-timeframe values update only after confirmation. This creates a deliberate delay compared with an unfinished higher-timeframe bar.
• A slot's selected timeframe should normally be equal to or higher than the chart timeframe. For example, a Weekly moving average is not intended for use as a lower-timeframe data source on a Monthly chart.
• Moving averages are lagging calculations derived from past prices. Presets do not guarantee that a particular combination is suitable for every market or timeframe.
MA Stack is an open-source visual organization tool built from standard moving-average calculations. It does not generate automated trade signals or alerts and does not constitute investment advice.
Индикатор

ICT Dynamic Entry Model & Structure Matrix PROICT Dynamic Entry Model & Structure Matrix PRO
ICT Dynamic Entry Model & Structure Matrix PRO is a clean, professional institutional charting script designed for traders following ICT mentorship principles and Smart Money Concepts. It delivers precise swing anchored market structure lines, dynamic trend candle themes, auto disappearing key levels, and gold highlighted expansion candles.
Key Features Overview
1. Precision Anchored BOS and CHoCH Structure
Market structure lines start exactly from the precise swing high or swing low origin price point. Text labels are positioned cleanly in the middle center of structure lines to avoid overlap with candlesticks.
2. Smart Trend Candle Engine
Driven by Intermediate Term High and Low levels. Once a red ITH prints, subsequent price candles dynamically adopt a solid bearish color scheme. When a green ITL prints, candles automatically convert to a bullish color scheme.
3. Gold Glowing FVG Expansion Candle Highlight
Identifies high momentum Fair Value Gap expansion candles, coloring the specific impulse candle in a distinct glowing gold yellow shade for instant institutional displacement detection.
4. Major ITH and ITL Level Badges
Features solid red Intermediate Term High badges and solid green Intermediate Term Low badges strictly at macro structural extremes.
5. Auto Disappearing Previous Day Boundaries
Tracks active Previous Day High and Previous Day Low boundaries. Daily lines automatically clean up and vanish as soon as price breaks or mitigates the level.
How to Use
Step 1: Identify Macro Shift
Look for green ITL badges for bullish bias or red ITH badges for bearish bias, which automatically adapts your overall candle colors.
Step 2: Monitor Centered Structure Signals
Observe precise dashed Break of Structure lines and solid Change of Character lines anchored directly from swing points with center aligned text.
Step 3: Spot Institutional Displacement
Identify gold glowing expansion candles that signal high volume displacement creating active Fair Value Gaps.
Settings Overview
Moving Average Settings
- Show Dual Moving Averages: Toggle visibility of EMAs.
- Period and Thickness Settings: Customize fast/slow periods and line width.
Market Structure Settings
- Show Precision BOS & CHoCH: Toggle centered structural lines.
- Sensitivity Period: Adjust pivot lookback calculations.
Smart Candle Settings
- Enable Smart Trend & Gold FVG Candles: Toggle dynamic trend colors and gold FVG expansion highlights.
Previous Day High and Low Settings
- Show Active PDH / PDL: Toggle display of auto disappearing daily key levels.
Entry Zone Settings
- Show Active Entry Zones: Toggle entry model rectangles and customize zone display text, text color, and fill opacity.
Disclaimer
This script is created strictly for educational, analytical, and charting enhancement purposes. It does not provide financial advice, trade recommendations, or guaranteed results. Always practice proper risk management.
Индикатор

Hunter OCI All SessionHunter OCI All Session
Overview
Hunter OCI All Session is an intraday technical analysis indicator designed to organize session-based price action within a unified analytical framework.
The indicator uses the Opening Range (OR) as the primary structural reference for the trading session. From this common foundation, it derives directional analysis, dynamic projection levels, adaptive support and resistance, analytical states, and session information.
Rather than generating automated trading decisions, the indicator is intended to assist discretionary technical analysis by presenting session data in a structured and consistent manner.
What's New
This version introduces a redesigned analytical framework centered on configurable trading sessions.
Instead of relying on predefined market sessions, users can define the Opening Range according to the instrument being analyzed while preserving the same analytical methodology.
All major analytical components now reference the same Opening Range throughout the trading session, providing a more consistent analytical structure.
Methodology
The analytical workflow begins with the Opening Range established at the start of the selected trading session.
From this common reference, the indicator:
• Builds the session structure.
• Evaluates directional conditions.
• Calculates dynamic projection levels.
• Updates adaptive support and resistance.
• Organizes the current analytical state.
Every major calculation originates from the same Opening Range foundation, allowing all components to operate within a unified analytical framework.
Main Components
The indicator includes:
• Opening Range structure
• Dynamic projection levels
• Radar directional analysis
• Adaptive support and resistance
• Analytical state classification
• Information panel
• Configurable alerts
• Visual customization options
Each component contributes to the same analytical workflow rather than functioning as an independent indicator.
Customization
Users can configure trading sessions, visual appearance, labels, colors, drawing styles, alerts, and information panel settings to adapt the indicator to different financial markets and personal chart preferences.
Recommended Usage
Hunter OCI All Session is designed primarily for intraday analysis where Opening Range methodology forms part of the trading process.
It is intended to complement discretionary technical analysis and should be used together with price action, market context, and appropriate risk management.
Limitations
The analytical output depends on the selected trading session configuration. Different session definitions may produce different analytical structures.
Like any technical analysis tool, the indicator should be interpreted within the broader context of market conditions rather than in isolation.
Disclaimer
This indicator is provided for analytical and educational purposes.
It is intended to assist users in studying session structure and intraday market behavior and should not be interpreted as financial advice, investment advice, or a guarantee of future market performance.
Trading decisions remain the sole responsibility of the user.
-------------------------------------------------------------------------
Hunter OCI All Session
نبذة عن المؤشر
هو مؤشر للتحليل الفني على الفريمات اللحظية، صُمم لتنظيم حركة السعر أثناء جلسة التداول ضمن إطار تحليلي موحد.
يعتمد المؤشر على نطاق افتتاح الجلسة (Opening Range) باعتباره المرجع الأساسي الذي تُبنى عليه جميع مكوناته، بما في ذلك التحليل الاتجاهي، ومستويات الأهداف الديناميكية، ومستويات الدعم والمقاومة المتغيرة، والحالات التحليلية، ومعلومات الجلسة.
ولا يهدف المؤشر إلى إصدار قرارات تداول آلية، وإنما صُمم لدعم التحليل الفني التقديري من خلال عرض معلومات الجلسة بصورة منظمة ومتسقة.
ما الجديد في هذا الإصدار؟
يقدم هذا الإصدار إطارًا تحليليًا مُعاد تصميمه يعتمد على جلسات تداول قابلة للتخصيص.
وبدلاً من الاعتماد على جلسات ثابتة، يمكن للمستخدم تحديد جلسة التداول المناسبة للأداة المالية محل التحليل مع الحفاظ على نفس المنهجية التحليلية.
كما أصبحت جميع المكونات الرئيسية تعتمد على نفس نطاق افتتاح الجلسة طوال فترة التداول، مما يوفر إطارًا تحليليًا أكثر اتساقًا.
المنهجية
تبدأ جميع الحسابات من نطاق افتتاح الجلسة الذي يتم تحديده عند بداية جلسة التداول المختارة.
وانطلاقًا من هذا المرجع يقوم المؤشر بما يلي:
• بناء الهيكل السعري للجلسة.
• تقييم الحالة الاتجاهية.
• حساب مستويات الأهداف الديناميكية.
• تحديث مستويات الدعم والمقاومة المتغيرة.
• تنظيم الحالة التحليلية الحالية.
وتعتمد جميع المكونات الرئيسية على نفس المرجع البنيوي لضمان عملها ضمن إطار تحليلي موحد.
المكونات الرئيسية
يتضمن المؤشر:
• نطاق افتتاح الجلسة.
• مستويات الأهداف الديناميكية.
• مكون Radar للتحليل الاتجاهي.
• مستويات الدعم والمقاومة المتغيرة.
• الحالات التحليلية.
• لوحة المعلومات.
• التنبيهات القابلة للتخصيص.
• خيارات العرض والإعدادات.
وتعمل جميع هذه المكونات ضمن إطار تحليلي واحد بدلاً من كونها أدوات مستقلة.
خيارات التخصيص
يمكن تخصيص جلسات التداول، والألوان، وأنماط الرسم، والتسميات، والتنبيهات، ولوحة المعلومات، والعناصر المرئية بما يتناسب مع مختلف الأسواق وأساليب العرض.
الاستخدام المقترح
صُمم Hunter OCI All Session أساسًا للتحليل الفني على الفريمات اللحظية التي يعتمد فيها المتداول على منهجية نطاق افتتاح الجلسة.
ويهدف إلى دعم التحليل الفني التقديري، وينبغي استخدامه جنبًا إلى جنب مع حركة السعر، وسياق السوق، وإدارة المخاطر.
ملاحظات
تعتمد نتائج المؤشر على إعدادات جلسة التداول التي يختارها المستخدم، ولذلك قد تختلف البنية التحليلية باختلاف الجلسة المحددة.
وكغيره من أدوات التحليل الفني، ينبغي تفسير مخرجات المؤشر ضمن السياق العام لحركة السوق، وليس بصورة مستقلة.
إخلاء المسؤولية
هذا المؤشر مقدم لأغراض التحليل والتعليم.
وقد صُمم للمساعدة في دراسة هيكل جلسات التداول وسلوك السوق أثناء التداول اللحظي، ولا يُعد نصيحة مالية أو استثمارية، ولا يمثل ضمانًا لأي نتائج مستقبلية.
وتبقى جميع قرارات التداول مسؤولية المستخدم وحده.
Индикатор

Sovereign Horizon Matrix (SHM) v8.0
SHM Bidirectional v8.0
⚔️ Executive Summary (SHM v8.0)
SHM Bidirectional v8.0 is an institutional-grade, macro trend-following execution matrix engineered for higher-timeframe swing trading on the Daily chart.
Built primarily for Bitcoin (BTC)—and modeled after real-world Coinbase Nano Bitcoin Futures execution mechanics—SHM v8.0 combines an 8-pillar technical framework with strict, non-repainting risk management. It eliminates chart fatigue and emotional bias, allowing Institutional and Retail traders to capture major trends while keeping their time free for the gym, work, and family.
* Primary Design: Daily Chart Swing Trading & Automation-Ready Execution Engine
* Core Focus: Bitcoin (BTC) macro expansion cycles (Fully adjustable for Altcoins, Futures, and Equities)
* Key Mechanics: Dual Baseline (63/480 WMA), Dual Break & Retest Engines, RSI Momentum Gate, and 3-Module Risk Engine
* Backtest Snapshot (BTC Daily): 7.617 Profit Factor | 18.85% Max Drawdown | 124.49% CAGR (56 trades)
⚙️ Purpose, Asset Focus & Time-Saving Design
The Purpose:
SHM v8.0 was created to solve a fundamental trading challenge: eliminating emotional bias, filtering out bad breakouts, and enforcing strict, automated risk management across volatile market cycles. The goal is to provide traders with a clean, repeatable strategy that captures real trends while shielding capital during choppy sideways movement.
Primary Target & Chart Focus:
* Primary Asset: Engineered primarily for Bitcoin (BTC) to handle its unique cycles, volatility spikes, and macro trend expansions.
* Daily Chart Focus: Designed specifically around higher-timeframe swing trading on the Daily chart. This makes it ideal for traders who don't have the time to sit in front of charts all day managing intraday noise.
* Full Adjustability: Works seamlessly across other crypto pairs, futures, and stocks. You have complete freedom to tweak all parameters—WMA lengths, envelope percentages, RSI filters, and stop distances—to match any market or timeframe.
⚙️ Core System Architecture
SHM v8.0 functions as a macro trend-following execution matrix. Because every signal and exit runs on fixed non-repainting calculations, it can also operate as a quantitative trend follower when linked to automated webhooks or trading bots.
1. Dual Baseline Framework: Combines a 63 Fast Institutional WMA with a 480 Macro Baseline WMA Tide filter to keep daily trades aligned with macro market structure.
2. Dual Break & Retest (B&R) Engine: Dedicated Micro (63 WMA) and Macro (480 WMA) engines track depth, touch penetration, and bounce candles to filter out false breakouts.
3. Timeframe-Locked RSI Momentum Gate: Verifies directional expansion so you don't buy near local tops or short into oversold bottoms.
4. Triple-Band Envelope System: Uses multi-layer WMA volatility bands to highlight expansion channels and potential exhaustion zones visually.
🛡️ SHM Modular Risk Engine
The script features three non-repainting exit modules:
* Module 1 (Flat TP to Breakeven): Moves your stop loss straight to entry price once a set profit percentage target is reached.
* Module 2 (65 WMA Ribbon Trail): Dynamically trails stops along the 65 WMA ribbon floor or ceiling during sustained trends.
* Module 3 (Candle-Close Trail): Steps your stop loss behind recent candle closes to lock in profits during sharp extensions.
📊 Default Properties, Backtest Metrics & Real-World Execution
To maintain total transparency and adhere to TradingView backtesting standards, default strategy Properties reflect realistic exchange execution mechanics (modeled after Coinbase Nano Bitcoin Futures / Derivatives environment settings):
* Initial Capital: $717 USD
* Position Sizing: 80% of Equity (default size is set higher for compounding, but can easily be adjusted in settings to match your personal risk tolerance)
* Leverage: 4x Long / ~3x Short
* Commission: 0.075% per trade
* Slippage & Delay: 30 ticks slippage / 1 tick order execution delay
* Execution Realism: Calculates on bar closes, order fills, and real-time bar ticks.
📈 Historical Performance Context (Daily Chart)
* Historical Data Source: Because newer derivatives tickers lack long-term price history, the full historical aggregate BTC chart was used to provide maximum sample depth.
* Trade Frequency: Running on the Daily chart generates a focused sample size of 56 trades across the dataset. While it doesn't hit the high trade counts of lower-timeframe scalpers, the efficiency of the framework stands out:
* Profit Factor: 7.617
* Max Equity Drawdown: 18.85%
* Average Winning Trade: +56.41% vs. Average Loss: -3.29%
* Compound Annual Growth Rate (CAGR): 124.49%
📌 Usage & Automation
* Execution Modes: Toggle between pure Price Action Baseline entries, Break & Retest Standalone entries, or Combined execution in the input menu.
* Automation Ready: All order conditions and trailing exits execute instantly on confirmed bar closes, making SHM fully compatible with webhook automation tools.
⚠️ Disclaimer & Compliance:
This script is published for educational and technical analysis backtesting purposes only. Past backtested results do not guarantee future performance. Always apply strict risk management and adjust commission, slippage, and position sizing settings to match your specific execution platform prior to live deployment.
Стратегия

Mean Reversion Half-Life & Spread Tracker [OnlyFibonacci] v3.0Mean Reversion Half-Life & Spread Tracker v3.0
A statistical mean-reversion oscillator for spread analysis — Z-Score normalization, closure-time tracking, confirmed signals, target price projection, and a real-time dashboard. Built in Pine Script v6.
This indicator is for educational and analytical purposes only. It does not constitute investment advice, financial advice, or a trading recommendation. Past signal performance does not guarantee future results. Always do your own research and manage risk responsibly.
---
What does this indicator do?
Mean Reversion Half-Life & Spread Tracker measures how far a price or spread has deviated from its statistical mean using a Z-Score oscillator . Beyond simple overbought/oversold readings, it tracks how long extreme deviations typically take to revert to zero, whether the current deviation is lasting longer than average, where price may revert if Z-Score returns to 0, and the historical success rate of confirmed signals.
Default mode: Asset vs Single Moving Average (Mean Reversion) — the chart symbol is normalized against a configurable SMA.
---
Core Features
Two Operational Modes
Asset vs SMA (default): Analyzes Close / SMA ratio for single-asset mean reversion
Pair Trading : Analyzes chart symbol (Asset A) divided by a secondary symbol (Asset B)
Z-Score Engine
Spread Ratio = Close/SMA or Close/Asset B
Z-Score = (Ratio − Rolling Mean) / Rolling Standard Deviation
Default lookback: 200 bars
EMA(3) smoothing applied to raw Z-Score to reduce whipsaw noise
Threshold Levels
Upper threshold: +2.3 (statistical overbought zone)
Lower threshold: −2.3 (statistical oversold zone)
Center line: 0.0 (equilibrium / mean)
Mean Closure Time
Tracks the average number of bars required for Z-Score to return to 0 after breaching ±2.3
Displays active spread duration in real time
Triggers a Time-Stop WARNING when duration exceeds the historical average
Confirmed Signal Logic
BUY : Smoothed Z-Score crosses above −2.3 and holds beyond the threshold for at least 1 full confirmed bar close (bullish mean reversion)
SELL : Smoothed Z-Score crosses below +2.3 and holds beyond the threshold for at least 1 full confirmed bar close (bearish mean reversion)
EXIT : Z-Score reaches 0, time-stop is triggered, or duration exceeds 2× average closure time
Signal Win Rate (%)
Historical success rate of confirmed signals
Win: Z-Score returns to 0 before exceeding 2× average closure time
Loss: Timeout or time-stop triggered before mean reversion completes
Target Price Level
Estimated chart price where Z-Score would equal 0
MA mode: RatioMean × SMA
Pair mode: RatioMean × Asset B price
Optional dynamic dashed projection line on the main chart while a signal is active
Visual Design (v3.0)
Dynamic gradient Z-Score line (red above 0, green below 0, neon tones at extremes)
Gradient-filled area between Z-Score and the zero line
Soft background glow in extreme zones
Modern dark-theme dashboard table with live status indicators
Built-in Alerts
Upper / Lower Threshold Breach
Time-Stop Warning
Bullish Mean Reversion BUY
Bearish Mean Reversion SELL
Signal EXIT
---
Dashboard Table
Live metrics displayed in the top-right corner:
Pair / Mode — active analysis configuration
Current Z-Score — real-time smoothed reading
Target Price Level — estimated Z=0 price
Avg Closure Time — historical mean reversion duration (bars)
Spread Duration — active deviation duration
Time-Stop Status — Normal or Warning
Signal Win Rate (%) — historical confirmed signal success rate
Status indicators: Normal, Active Trade, Warning.
---
How to Use
Add the indicator to your chart (separate oscillator pane).
In default Asset vs SMA mode, set the SMA length (default: 50).
For pair analysis, switch to Pair Trading mode and select Asset B.
Monitor the Z-Score panel:
Z > +2.3 → spread is statistically extended above mean (potential bearish mean reversion)
Z < −2.3 → spread is statistically extended below mean (potential bullish mean reversion)
Z ≈ 0 → statistical equilibrium
Compare Spread Duration against Avg Closure Time in the dashboard.
If Time-Stop shows WARNING, the deviation may be persisting longer than historically normal — review risk management.
Set alerts for threshold breaches, confirmed signals, and exits.
---
How to Interpret
Mean reversion concept : When price or spread reaches statistical extremes, it tends to revert toward its rolling mean over time.
Z-Score : Measures deviation in standard deviation units. ±2.3 represents a strong statistical extreme.
Avg Closure Time : How long past extreme deviations took to revert to zero. If current duration exceeds this, caution is warranted.
Target Price : A dynamic estimate of where price may revert if Z-Score normalizes — a reference level, not a guaranteed target.
Win Rate : A summary of past confirmed signal outcomes. Not a promise of future performance.
Gradient fill : Visually emphasizes the magnitude and direction of deviation from equilibrium.
Horizontal dashed line on the main chart (if enabled): Projects the estimated price level where Z-Score = 0 while a BUY or SELL signal is active. It updates dynamically and disappears on EXIT or target reached. Disable via Show Target Price Projection Line .
---
Recommended Use Cases
Single-asset mean reversion analysis vs SMA
Crypto, forex, and equity pair spread monitoring
Multi-timeframe confluence checks
Alert-based watchlist monitoring
Time-stop and duration-based risk awareness
---
Customizable Inputs
Mode, Asset B Symbol, MA Length
Z-Score Lookback (200), EMA Smoothing (3)
Upper/Lower Threshold (±2.3)
Signal Confirmation Bars (1–5)
Gradient Area Fill, Background Glow, Target Line, Dashboard
---
Important Notes
Non-repainting security calls: gaps_off, lookahead_off
This is an analysis tool — it does not execute trades automatically
Parameters may require optimization across different markets and timeframes
Win rate and closure time are based on historical data and may differ in live conditions
Always use proper position sizing and risk management
---
Keywords
Mean Reversion, Z-Score, Half-Life, Spread Tracker, Pair Trading, Statistical Arbitrage, Oscillator, SMA, Closure Time, Time-Stop, Pine Script v6, OnlyFibonacci
---
Developed with Pine Script v6. For analysis and education only. Индикатор

EMA/SMA Classics V1.0 by SRTEMA/SMA Classics V1.0 by SRT
The EMA/SMA Classics indicator was designed to answer one simple question:
"Which side of the market currently has the structural advantage?"
Instead of flooding the chart with buy and sell arrows, this indicator focuses on market structure, trend alignment, and high-quality price action, allowing traders to make their own execution decisions with greater confidence.
Whether you trade Forex, Indices, Commodities or Crypto, this indicator combines multiple market concepts into a clean workflow while remaining highly configurable through both EMA and SMA combinations.
What This Indicator Includes
• Flexible EMA / SMA Engine
Unlike traditional moving average indicators that are locked to one MA type, every moving average in this indicator can independently be configured as either:
EMA
SMA
Default settings:
MA 1 : 7
MA 2 : 40
MA 3 : 150
MA 4 : 200
You may use the default configuration or customise the periods to fit your own trading methodology.
• Dynamic Moving Average Stack Detection
The indicator continuously evaluates whether the visible moving averages are properly stacked.
Bullish Stack
Fast MA > Medium MA > Slow MA
Bearish Stack
Fast MA < Medium MA < Slow MA
When the moving averages lose their proper order, the market is treated as neutral instead of forcing a directional bias.
This helps reduce many false trend signals that occur during consolidations.
• ATR-Based MA Spacing Filter
One common problem with MA strategies is entering when all moving averages have already compressed together.
This indicator measures the spacing between moving averages using ATR.
When the moving averages become too compressed, trend quality deteriorates.
The spacing filter helps identify these lower-quality environments before momentum fully develops.
• Ladder Structure
One of the core concepts inside this indicator is the Ladder System.
Instead of only observing moving averages, the indicator also evaluates the market using multiple dynamic support and resistance structures.
Resistance
R9
R40
R70
R100
R150
Support
S9
S40
S70
S100
S150
These levels automatically update with market structure and are used to generate an additional Ladder Bias.
When both the moving averages and Ladder Bias agree, market structure is generally stronger than relying on moving averages alone.
• Flush Dot System
The indicator displays visual Flush Dots beneath or above candles whenever trend alignment exists.
Small Green Dot
Bullish MA alignment.
Small Red Dot
Bearish MA alignment.
Large Green Dot
Moving Average alignment + Bullish Ladder confirmation.
Large Red Dot
Moving Average alignment + Bearish Ladder confirmation.
The larger dots represent stronger structural agreement across multiple components.
• KeyBar Detection
The indicator automatically identifies two important price action patterns.
Engulfing Bars
Bullish Engulfing (EBull)
Bearish Engulfing (EBear)
These are filtered using ATR and minimum body size to avoid insignificant candles.
Long Tail Bars (LTB)
Bullish Long Tail Bars
Bearish Long Tail Bars
These identify strong rejection candles with defined tail proportions and body positioning.
An optional body-size filter is also available for traders wanting stricter candle selection.
Daily Pivot (DP)
Automatically plots the previous day's pivot.
Useful as:
Dynamic support
Dynamic resistance
Intraday reaction level
Weekly Pivot (WP)
Automatically plots the previous week's pivot.
Many swing traders use weekly pivots as major reaction zones throughout the trading week.
RSI Momentum Alerts
The indicator includes two independent RSI event types.
RSI Breakout
Signals when RSI breaks into extreme momentum territory.
Bullish breakout
Bearish breakout
RSI Retracement
Designed to identify momentum continuation after RSI exits an extreme condition while confirming with the RSI Moving Average.
These alerts can be useful for traders looking to participate after momentum has begun to recover instead of chasing extremes.
Information Panel
A compact table summarises the current market condition.
Displays:
Moving Average Bias
Ladder Bias
Long Tail Bar presence
This provides a quick snapshot without needing to inspect every component individually.
How To Use This Indicator
This indicator is not designed to generate automatic Buy or Sell signals.
Instead, it acts as a Market Context Indicator.
A typical workflow may look like this:
Step 1
Observe whether the moving averages are properly stacked.
A clean stack generally indicates directional order.
Step 2
Check whether the Ladder Bias agrees with the moving averages.
When both align, the market structure is generally stronger.
Step 3
Watch for KeyBars.
Examples include:
Bullish Engulfing
Bearish Engulfing
Bullish Long Tail Bar
Bearish Long Tail Bar
These often represent meaningful reactions within the prevailing structure.
Step 4
Use Daily Pivot and Weekly Pivot as areas where price may react.
These levels should be considered areas of interest rather than guaranteed reversal zones.
Step 5
Monitor RSI alerts for momentum shifts.
Momentum signals are generally more useful when they occur in the same direction as the prevailing market structure.
Suitable Timeframes
Although the indicator can be applied to multiple chart intervals, it generally performs best on:
M15
M30
H1
H4
Daily
The moving averages, Ladder System, and KeyBar detection adapt naturally across different timeframes.
Difference Between EMA/SMA Classics & H1 EMA/SMA + Higher Timeframe Analysis (Classic)
Although both indicators belong to the same ecosystem, they serve different purposes.
EMA/SMA Classics
Designed as a general-purpose structural trend indicator.
Features include:
Flexible EMA/SMA stacking
Ladder System
Flush Dots
Engulfing Bars
Long Tail Bars
Daily Pivot
Weekly Pivot
RSI Alerts
It can be used on virtually any timeframe and is ideal for traders who prefer to analyse the chart directly.
H1 EMA/SMA + Higher Timeframe Analysis (Classic)
The H1 version is a significantly more advanced market context engine.
In addition to everything above, it introduces:
Dedicated H1 Bias Engine
H4 Trend Analysis
Daily Trend Analysis
Higher Timeframe Bias Aggregation
H1TF Composite Bias
Overall Market Verdict Engine
Multi-layer Bias Table
Higher Timeframe Confirmation Workflow
Rather than focusing solely on the current chart, the H1 version continuously evaluates whether multiple timeframes are aligned before presenting an overall market verdict.
If the EMA/SMA Classics indicator answers:
"What is my current chart doing?"
Then the H1 version answers:
"What is the broader market structure telling me across multiple timeframes?"
The two indicators are complementary and can be used together depending on your preferred trading workflow.
Disclaimer
This indicator is designed to assist with market structure analysis and decision-making. It does not provide financial advice or guarantee profitable trades. Always combine indicator signals with sound risk management, personal analysis, and appropriate position sizing. Индикатор

H1 EMA/SMA + Higher Timeframe Analysis (Classic) V1.0 by SRT# H1 EMA/SMA + Higher Timeframe Analysis (Classic) V1.0 by SRT
## Overview
H1 EMA/SMA + Higher Timeframe Analysis (Classic) V1.0 by SRT is a complete market context indicator designed to help traders read trend, structure and execution quality from a single chart.
Instead of relying on one indicator alone, this script combines multiple layers of market information into one unified framework:
• H1 Moving Average Bias Engine
• Higher Timeframe (H4 & Daily) Trend Confirmation
• Ladder Market Structure Analysis
• Dynamic Daily & Weekly Pivot Levels
• VWAP Bias Filter
• Engulfing & Long Tail Bar (LTB) Detection
• RSI Breakout & Retracement Alerts
• Composite Bias Dashboard
• Smart Alert System
The objective is simple:
Reduce subjectivity by helping traders identify when multiple independent factors agree before looking for trade opportunities.
This indicator is designed for traders who prefer trading with trend and market structure rather than relying on a single crossover or oscillator.
---
## Main Features
### ① H1 Bias Engine
The H1 Bias Engine evaluates the alignment of up to four configurable EMA/SMA lines.
Unlike traditional MA crossover indicators, this engine considers:
• Moving average order
• Price position relative to the moving averages
• MA spacing quality
• Trend strength
Bias is classified into:
• Strong Bullish
• Bullish
• Neutral
• Bearish
• Strong Bearish
An ATR-based spacing filter automatically ignores signals when moving averages become compressed, helping reduce false trend readings during consolidation.
---
### ② Higher Timeframe Bias
The script automatically evaluates both:
• H4 Trend
• Daily Trend
using a dedicated EMA40 / EMA150 / SMA200 structure.
These two higher timeframes are combined into a Higher Timeframe (HTF) Bias.
This allows traders to quickly determine whether H1 signals are aligned with the broader market direction.
---
### ③ Ladder Market Structure
The Ladder System measures how support and resistance levels evolve over multiple lookback windows.
Support Levels
S9
S40
S70
S100
S150
Resistance Levels
R9
R40
R70
R100
R150
The relative positioning of these levels produces a Ladder Bias ranging from:
Strong Bullish
Bullish
Neutral
Bearish
Strong Bearish
This provides an additional market structure confirmation independent of moving averages.
---
### ④ Composite H1TF Bias
One of the core components of the indicator.
H1TF combines:
• H1 Moving Average Bias
• Ladder Bias
to generate a stronger consensus trend.
Rather than reacting to a single condition, H1TF requires agreement between trend and structure before producing stronger directional confidence.
---
### ⑤ Final Verdict Engine
The Final Verdict combines:
Higher Timeframe Bias
*
H1TF Composite Bias
Only when both higher timeframe trend and H1 composite trend strongly agree will the dashboard produce:
Strong Bullish
or
Strong Bearish
This helps traders focus on higher probability market conditions instead of reacting to every market fluctuation.
---
### ⑥ Key Bar Detection
The indicator automatically detects two important price action patterns.
Bullish / Bearish Engulfing Bars
Long Tail Bars (LTB)
Each signal includes:
ATR size validation
Minimum body filters
Tail quality checks
Momentum confirmation
These are designed to highlight significant candles instead of every basic engulfing or pin bar.
---
### ⑦ Daily & Weekly Pivot Levels
Built-in pivot calculations include:
Daily Pivot (DP)
Weekly Pivot (WP)
These levels provide additional context for potential support, resistance and reaction zones.
---
### ⑧ VWAP Bias
The indicator includes a built-in VWAP filter.
Price above VWAP
Bullish
Price below VWAP
Bearish
This offers another layer of institutional-style market context that complements the moving average analysis.
---
### ⑨ RSI Momentum Alerts
Four RSI-based alerts are included.
Bullish RSI Breakout
Bearish RSI Breakout
Bullish RSI Retracement
Bearish RSI Retracement
These alerts are designed to identify momentum expansion as well as potential continuation opportunities after retracements.
---
### ⑩ Smart Alert System
The alert engine supports multiple event types.
H1 Bias changes
Higher Timeframe Bias changes
H1TF Composite changes
Ladder Bias changes
Bullish Engulfing
Bearish Engulfing
Bullish Long Tail Bar
Bearish Long Tail Bar
Optional filters allow alerts to trigger only when aligned with:
H1TF
Higher Timeframe
Strong Bias only
This helps reduce unnecessary alert noise.
---
## Reading the Bias Dashboard
The dashboard summarizes the complete market picture.
Daily
Daily Trend
H4
H4 Trend
HTF
Combined Higher Timeframe Trend
H1
Current H1 Moving Average Bias
Ladder
Market Structure Bias
H1TF
Combined H1 Trend
VWAP
Current VWAP Position
Verdict
Final Consensus
The strongest trading environments generally occur when multiple components point in the same direction.
---
## Typical Workflow
A simple workflow may look like this:
1. Check the Final Verdict.
2. Confirm H1TF agrees with the Higher Timeframe.
3. Observe whether VWAP supports the direction.
4. Wait for a qualifying Engulfing Bar or Long Tail Bar.
5. Use Daily Pivot, Weekly Pivot and Ladder levels for trade management.
This approach encourages waiting for confluence rather than entering solely because one indicator changes direction.
---
## Notes
This indicator is intended as a market context and decision-support tool.
It does not predict future prices and should not be considered a standalone trading system.
Like any technical tool, it performs best when combined with sound risk management, proper trade planning and disciplined execution.
---
Thank you for using H1 EMA/SMA + Higher Timeframe Analysis (Classic) V1.0 by SRT
I hope this indicator helps simplify chart analysis and encourages traders to focus on market structure, trend alignment and disciplined decision making.
— SRT
Индикатор

Индикатор

Индикатор

Single Timeframe Multi-EMA Trend Table### Overview
The **Single Timeframe Multi-EMA Trend Table** displays the directional bias of 7 customizable Exponential Moving Averages (EMAs) calculated from a single, higher timeframe of your choice.
This allows traders working on lower execution timeframes (e.g., 1-minute or 5-minute charts) to effortlessly monitor macro trend alignment and EMA support/resistance zones from higher timeframes (e.g., 15m, 1h, or 4h) without switching charts.
---
### Key Features
* **Selectable Target Timeframe:** Choose any timeframe (1m, 5m, 15m, 1h, 4h, 1D, etc.) to fetch EMA data from.
* **7 Customizable EMAs:** Define 7 individual EMA lengths (e.g., EMA 9, 20, 50, 100, 150, 200, 800) to monitor full trend structure.
* **Consolidation Detection:** Identifies when price is compressing or trading close to a specific EMA line, marking it as a **RANGE 🟡** state.
* **Clean UI:** Displays chosen timeframe in the table header alongside active EMA lengths and clear color-coded statuses.
---
### How to Use
1. **Set Target Timeframe:** In the settings, choose the macro timeframe you want to base your analysis on (e.g., 15m).
2. **Configure EMAs:** Input your preferred EMA lengths.
3. **Gauge Trend Strength:**
* **Full Bullish Alignment:** All or most EMAs show `BULLISH 🟢`.
* **Compression/Ranging:** Multiple EMAs show `RANGE 🟡`, warning of choppy price action. Индикатор

Multi-Timeframe Trend & Consolidation Table### Overview
The **Multi-Timeframe Trend & Consolidation Table** is a lightweight dashboard indicator designed to give traders a quick, multi-timeframe overview of the market trend and consolidation status directly on their chart.
Instead of switching between multiple timeframes or cluttering your chart with dozens of moving averages, this tool consolidates trend data across 10 different timeframes into a clean, customizable table.
---
### Key Features
* **Multi-Timeframe Analysis:** Monitors **1m, 3m, 5m, 10m, 15m, 1h, 4h, 1D, 1W, and 1M** timeframes simultaneously.
* **Customizable EMA Periods:** Set unique Exponential Moving Average (EMA) lengths for every individual timeframe (e.g., EMA 10 for 1m, EMA 50 for 1h, EMA 200 for 1D).
* **Consolidation Detection:** Built-in threshold logic identifies when price is hovering extremely close to the EMA line, signaling potential range-bound/chop market conditions.
* **Dynamic Table UI:** Displays the specific EMA length assigned to each timeframe directly inside the table for clear tracking. Fully customizable position (Top Right, Bottom Left, etc.) and text sizes.
---
### How It Works
The indicator compares the price of each timeframe against its assigned EMA line:
1. **BULLISH 🟢:** Current close price is above the timeframe's EMA (outside the consolidation zone).
2. **BEARISH 🔴:** Current close price is below the timeframe's EMA (outside the consolidation zone).
3. **RANGE 🟡:** Price percentage difference from the EMA is smaller than the set threshold (e.g., within 0.15%), indicating market consolidation or flat movement.
---
### How to Use
1. **Trend Alignment:** Look for timeframes aligning in the same direction (e.g., 1h, 4h, and 1D all green) to trade with the macro trend.
2. **Avoiding Chop:** When lower timeframes show `RANGE 🟡`, it indicates low volatility or moving average compression, warning you to avoid breakout trades or wait for confirmation.
3. **Execution Timeframes:** Tune lower timeframes (1m, 3m, 5m) to fast EMAs for scalp setups, while keeping higher timeframes (1D, 1W) on key levels like the 200 EMA.
---
### Settings & Inputs
* **EMA Lengths per Timeframe:** Set custom EMA periods for all 10 available timeframes.
* **Enable Consolidation Detection:** Toggle range detection on or off based on your strategy preference.
* **Consolidation Threshold (%):** Adjust the distance percentage between close price and EMA to define a range zone (default is 0.15%).
* **Table Display:** Adjust table placement on your screen and text font size. Индикатор

Hyperliquid-Ready Webhook Strategy TemplateMost webhook templates get you 80% of the way there — then your bot double-fills an order at 3am and you learn about the missing 20%. This template IS the missing 20%.
What this is
An open-source strategy template whose real value is the alert payload: a production-grade JSON webhook message with the fields most templates skip. The included strategy (EMA 21/55 cross + RSI filter, ATR-based SL/TP) is a simple demo — swap in your own logic. It happens to test reasonably on BTC 4H, but the point of this script is the plumbing, not the entry logic. Bring your own edge.
The payload — and why each field exists
→ id — unique per event (ticker + timeframe + action + bar time). Your backend treats this as an idempotency key: TradingView sometimes retries the same alert when your server responds slowly. Dedupe by id (one Redis SET NX) and you'll never double-fill. The action is part of the id so an entry and its exit on the same bar can never collide — a bug I caught in live testing of this exact script.
→ ts — fire-time timestamp via {{timenow}}. Reject alerts older than N seconds so a delayed or replayed webhook can't trade a stale price.
→ secret — replace with a long random token and verify it server-side (or better, HMAC the body). Anyone who finds your webhook URL can POST to it. This field is your lock.
→ reduce_only — true on exits, so a close can never accidentally flip you into a new position if state desyncs.
Also included: leverage and qty fields for your backend (cap leverage server-side too — never trust the client alone), and an on-chart payload preview table so you can eyeball your exact JSON before wiring real money.
Setup (2 minutes)
Add to chart (crypto perps: BTC/ETH/SOL, 15m–4H)
Create alert → condition: this strategy → "Order fills events" → message box: {{strategy.order.alert_message}}
Point the alert's webhook URL at your execution backend or bridge
Works with any TradingView→exchange webhook bridge. Important: alerts snapshot the script when created — if you edit the code, delete and re-create your alerts.
Who I am
I build custom TradingView→Hyperliquid execution pipelines (Pine Script v6, non-custodial agent wallets). If you want this wired to live execution or adapted to your strategy, links are in my signature. Стратегия