
Steelmaker Nucor has done little for years, but some traders may think it’s ready to start moving again.
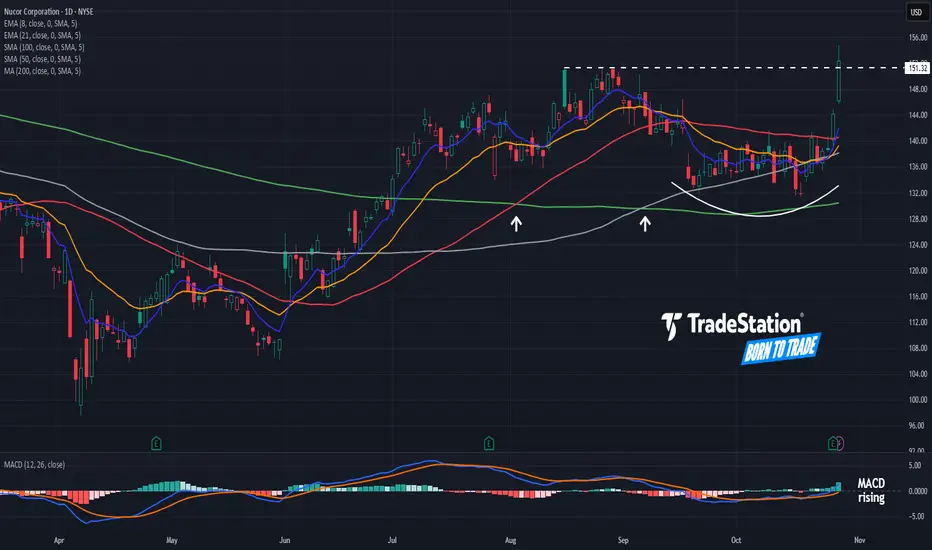
The first pattern on today’s chart is the basing pattern between $132 and $140. Prices have broken above that range this week and also crossed the 50-day simple moving average (SMA). That may suggest a period of consolidation has ended.
Second, longer-term moving averages have aligned in a potentially bullish way. The 50-day SMA had a “golden cross” above the 200-day SMA in August and the 100-day SMA rose above the 200-day SMA last month. (See white arrows.)
Third, the 8-day exponential moving average (EMA) just crossed above the 21-day EMA. MACD is also rising. Those signals may be consistent with shorter-term bullishness.
Finally, traders may eye the August peak of $151.32 as a potential trigger for a breakout.
TradeStation has, for decades, advanced the trading industry, providing access to stocks, options and futures. If you're born to trade, we could be for you. See our Overview for more.
Past performance, whether actual or indicated by historical tests of strategies, is no guarantee of future performance or success. There is a possibility that you may sustain a loss equal to or greater than your entire investment regardless of which asset class you trade (equities, options or futures); therefore, you should not invest or risk money that you cannot afford to lose. Online trading is not suitable for all investors. View the document titled Characteristics and Risks of Standardized Options at https://www.TradeStation.com/DisclosureOptions. Before trading any asset class, customers must read the relevant risk disclosure statements on https://www.TradeStation.com/Important-Information/. System access and trade placement and execution may be delayed or fail due to market volatility and volume, quote delays, system and software errors, Internet traffic, outages and other factors.
Securities and futures trading is offered to self-directed customers by TradeStation Securities, Inc., a broker-dealer registered with the Securities and Exchange Commission and a futures commission merchant licensed with the Commodity Futures Trading Commission). TradeStation Securities is a member of the Financial Industry Regulatory Authority, the National Futures Association, and a number of exchanges.
TradeStation Securities, Inc. and TradeStation Technologies, Inc. are each wholly owned subsidiaries of TradeStation Group, Inc., both operating, and providing products and services, under the TradeStation brand and trademark. When applying for, or purchasing, accounts, subscriptions, products and services, it is important that you know which company you will be dealing with. Visit https://www.TradeStation.com/DisclosureTSCompanies for further important information explaining what this means.
The first pattern on today’s chart is the basing pattern between $132 and $140. Prices have broken above that range this week and also crossed the 50-day simple moving average (SMA). That may suggest a period of consolidation has ended.
Second, longer-term moving averages have aligned in a potentially bullish way. The 50-day SMA had a “golden cross” above the 200-day SMA in August and the 100-day SMA rose above the 200-day SMA last month. (See white arrows.)
Third, the 8-day exponential moving average (EMA) just crossed above the 21-day EMA. MACD is also rising. Those signals may be consistent with shorter-term bullishness.
Finally, traders may eye the August peak of $151.32 as a potential trigger for a breakout.
TradeStation has, for decades, advanced the trading industry, providing access to stocks, options and futures. If you're born to trade, we could be for you. See our Overview for more.
Past performance, whether actual or indicated by historical tests of strategies, is no guarantee of future performance or success. There is a possibility that you may sustain a loss equal to or greater than your entire investment regardless of which asset class you trade (equities, options or futures); therefore, you should not invest or risk money that you cannot afford to lose. Online trading is not suitable for all investors. View the document titled Characteristics and Risks of Standardized Options at https://www.TradeStation.com/DisclosureOptions. Before trading any asset class, customers must read the relevant risk disclosure statements on https://www.TradeStation.com/Important-Information/. System access and trade placement and execution may be delayed or fail due to market volatility and volume, quote delays, system and software errors, Internet traffic, outages and other factors.
Securities and futures trading is offered to self-directed customers by TradeStation Securities, Inc., a broker-dealer registered with the Securities and Exchange Commission and a futures commission merchant licensed with the Commodity Futures Trading Commission). TradeStation Securities is a member of the Financial Industry Regulatory Authority, the National Futures Association, and a number of exchanges.
TradeStation Securities, Inc. and TradeStation Technologies, Inc. are each wholly owned subsidiaries of TradeStation Group, Inc., both operating, and providing products and services, under the TradeStation brand and trademark. When applying for, or purchasing, accounts, subscriptions, products and services, it is important that you know which company you will be dealing with. Visit https://www.TradeStation.com/DisclosureTSCompanies for further important information explaining what this means.

คำจำกัดสิทธิ์ความรับผิดชอบ
ข้อมูลและบทความไม่ได้มีวัตถุประสงค์เพื่อก่อให้เกิดกิจกรรมทางการเงิน, การลงทุน, การซื้อขาย, ข้อเสนอแนะ หรือคำแนะนำประเภทอื่น ๆ ที่ให้หรือรับรองโดย TradingView อ่านเพิ่มเติมใน ข้อกำหนดการใช้งาน
คำจำกัดสิทธิ์ความรับผิดชอบ
ข้อมูลและบทความไม่ได้มีวัตถุประสงค์เพื่อก่อให้เกิดกิจกรรมทางการเงิน, การลงทุน, การซื้อขาย, ข้อเสนอแนะ หรือคำแนะนำประเภทอื่น ๆ ที่ให้หรือรับรองโดย TradingView อ่านเพิ่มเติมใน ข้อกำหนดการใช้งาน