
Instrument: SOL/USD
Trend: Medium-term bearish
Timeframe: Weekly / Daily
Market phase: Range → potential continuation
⸻
Market Structure
SOL/USD remains inside a medium-term descending channel, while price action since mid-last month has compressed into a sideways range between 125.00 and 150.00 (Murray [2/8]–[4/8]).
Price is currently pressing below the lower boundary of the range, increasing the probability of a downside continuation.
Failure to reclaim 125.00 would confirm a range breakdown and open the way toward 100.00 and 75.00.
A bullish reversal requires a confirmed breakout above 150.00, supported by volatility expansion.
⸻
Higher-Timeframe Context
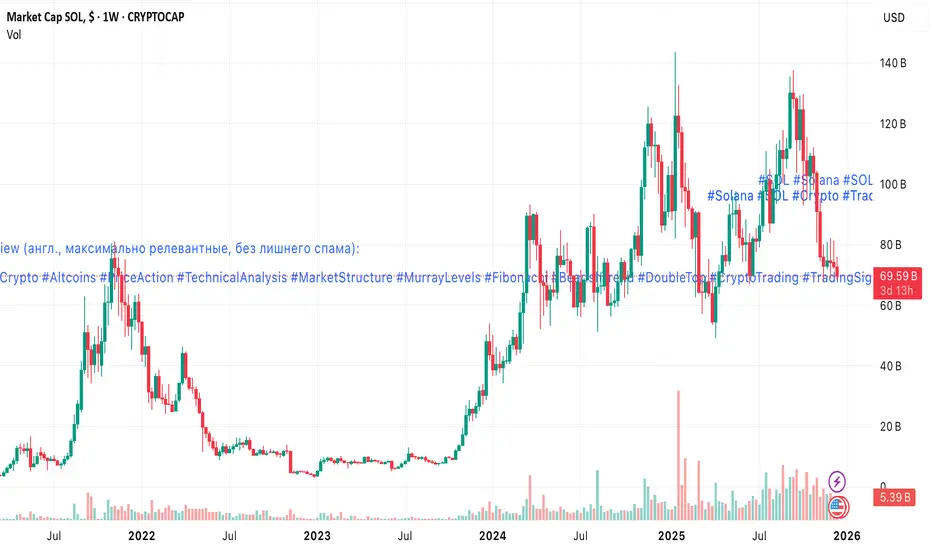
On the weekly chart, SOL continues to show characteristics of a potential double-top formation, reinforcing downside risk toward at least 93.75 (Murray [3/8], W1) if support fails.
⸻
Indicator Snapshot
• Bollinger Bands: Flat → consolidation phase
• Stochastic: Sideways → lack of momentum
• MACD: Stable below zero → bearish bias intact
Momentum remains weak; range resolution is likely.
⸻
Key Levels
Resistance:
• 150.00
• 187.50
• 200.00
Support:
• 125.00
• 100.00
• 75.00
⸻
Trading Scenarios
Primary scenario — bearish continuation:
• SELL STOP: 121.00
• Targets: 100.00 → 75.00
• Stop-loss: 139.00
• Horizon: 5–7 days
Alternative scenario — bullish breakout:
• BUY STOP: 151.00
• Targets: 187.50 → 200.00
• Stop-loss: 130.00
⸻
Conclusion
As long as SOL/USD trades below 125.00–150.00, the structure favors sellers.
A confirmed breakdown below 125.00 would likely accelerate losses toward 100.00 and 75.00, while only a clean breakout above 150.00 would signal a trend reversal.
Trend: Medium-term bearish
Timeframe: Weekly / Daily
Market phase: Range → potential continuation
⸻
Market Structure
SOL/USD remains inside a medium-term descending channel, while price action since mid-last month has compressed into a sideways range between 125.00 and 150.00 (Murray [2/8]–[4/8]).
Price is currently pressing below the lower boundary of the range, increasing the probability of a downside continuation.
Failure to reclaim 125.00 would confirm a range breakdown and open the way toward 100.00 and 75.00.
A bullish reversal requires a confirmed breakout above 150.00, supported by volatility expansion.
⸻
Higher-Timeframe Context
On the weekly chart, SOL continues to show characteristics of a potential double-top formation, reinforcing downside risk toward at least 93.75 (Murray [3/8], W1) if support fails.
⸻
Indicator Snapshot
• Bollinger Bands: Flat → consolidation phase
• Stochastic: Sideways → lack of momentum
• MACD: Stable below zero → bearish bias intact
Momentum remains weak; range resolution is likely.
⸻
Key Levels
Resistance:
• 150.00
• 187.50
• 200.00
Support:
• 125.00
• 100.00
• 75.00
⸻
Trading Scenarios
Primary scenario — bearish continuation:
• SELL STOP: 121.00
• Targets: 100.00 → 75.00
• Stop-loss: 139.00
• Horizon: 5–7 days
Alternative scenario — bullish breakout:
• BUY STOP: 151.00
• Targets: 187.50 → 200.00
• Stop-loss: 130.00
⸻
Conclusion
As long as SOL/USD trades below 125.00–150.00, the structure favors sellers.
A confirmed breakdown below 125.00 would likely accelerate losses toward 100.00 and 75.00, while only a clean breakout above 150.00 would signal a trend reversal.

คำจำกัดสิทธิ์ความรับผิดชอบ
ข้อมูลและบทความไม่ได้มีวัตถุประสงค์เพื่อก่อให้เกิดกิจกรรมทางการเงิน, การลงทุน, การซื้อขาย, ข้อเสนอแนะ หรือคำแนะนำประเภทอื่น ๆ ที่ให้หรือรับรองโดย TradingView อ่านเพิ่มเติมใน ข้อกำหนดการใช้งาน
คำจำกัดสิทธิ์ความรับผิดชอบ
ข้อมูลและบทความไม่ได้มีวัตถุประสงค์เพื่อก่อให้เกิดกิจกรรมทางการเงิน, การลงทุน, การซื้อขาย, ข้อเสนอแนะ หรือคำแนะนำประเภทอื่น ๆ ที่ให้หรือรับรองโดย TradingView อ่านเพิ่มเติมใน ข้อกำหนดการใช้งาน