
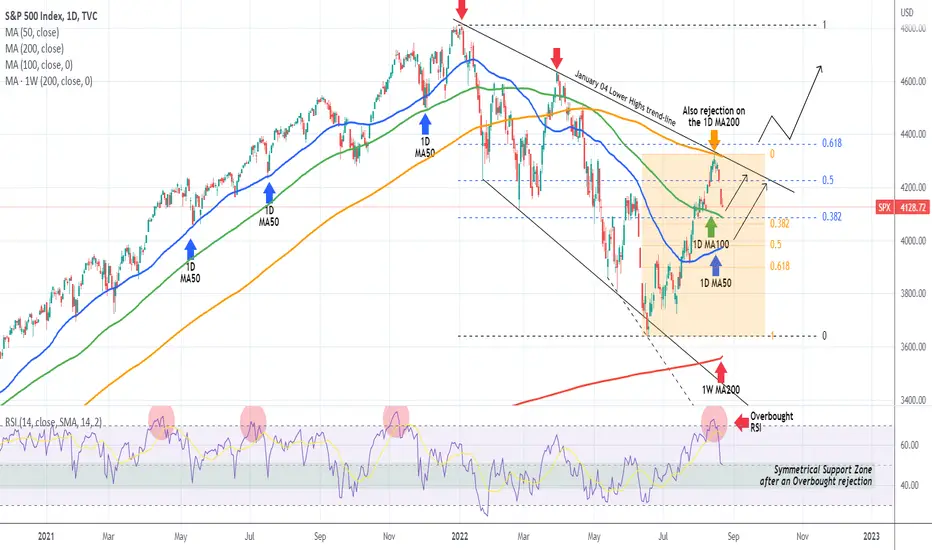
The S&P500 Index (SPX) had a perfect rejection on the 1D MA200 (orange trend-line), exactly after our analysis last week:

As you see, the rejection was not just on the 1D MA200 but also on the January 04 Lower Highs trend-line, essentially the Lower Highs trend-line starting from the All Time High (ATH). As we mentioned on that previous analysis, the rejection took place once the 1D RSI broke into the Overbought Territory. We made a good case that in the recent past however, such RSI overbought breaks, have proved to be only short-term index price rejections and technical pull-backs mostly attributed to profit taking.
To be more precise, since 2019 such rejections on overbought 1D RSI levels have resulted into 1D MA50 (blue trend-line) tests 5 times, 1D MA100 (green trend-line) tests 1 time and 1D MA200 tests 2 times (but when price action was much more flat and of course we were not into such a high inflation correction). Scroll the chart to the left to see those. Currently the 1D MA100 is trading towards the 0.382 Fibonacci retracement level from the Aug 16 High, while the 1D MA50 on the 0.5 Fib. If this is indeed the first rally of a new long-term Bull Phase, those are the Support levels to consider.
But if the pattern since the ATH is a Bearish Megaphone, what gives the impression that it may be the first rally into a new Bull Phase? Well as you see on the snapshot below, the MACD on the 1W time-frame rose after a huge Bullish Cross, the first since November 05 2021. Also the 1W RSI broke above its Nov 19 2021 Lower Highs trend-line and made a high above the previous Lower High of April 01.

In the event of a 1D MA200 break-out, we would ideally like to see a break above the 0.618 Fib (from the January 04 ATH), as this is the Golden Ratio.
Also keep an eye on the RSI symmetrical Support Zone after Overbought rejections, for clues on where the price may rebound. We already broke inside it.
--------------------------------------------------------------------------------------------------------
** Please support this idea with your likes and comments, it is the best way to keep it relevant and support me. **
--------------------------------------------------------------------------------------------------------
As you see, the rejection was not just on the 1D MA200 but also on the January 04 Lower Highs trend-line, essentially the Lower Highs trend-line starting from the All Time High (ATH). As we mentioned on that previous analysis, the rejection took place once the 1D RSI broke into the Overbought Territory. We made a good case that in the recent past however, such RSI overbought breaks, have proved to be only short-term index price rejections and technical pull-backs mostly attributed to profit taking.
To be more precise, since 2019 such rejections on overbought 1D RSI levels have resulted into 1D MA50 (blue trend-line) tests 5 times, 1D MA100 (green trend-line) tests 1 time and 1D MA200 tests 2 times (but when price action was much more flat and of course we were not into such a high inflation correction). Scroll the chart to the left to see those. Currently the 1D MA100 is trading towards the 0.382 Fibonacci retracement level from the Aug 16 High, while the 1D MA50 on the 0.5 Fib. If this is indeed the first rally of a new long-term Bull Phase, those are the Support levels to consider.
But if the pattern since the ATH is a Bearish Megaphone, what gives the impression that it may be the first rally into a new Bull Phase? Well as you see on the snapshot below, the MACD on the 1W time-frame rose after a huge Bullish Cross, the first since November 05 2021. Also the 1W RSI broke above its Nov 19 2021 Lower Highs trend-line and made a high above the previous Lower High of April 01.
In the event of a 1D MA200 break-out, we would ideally like to see a break above the 0.618 Fib (from the January 04 ATH), as this is the Golden Ratio.
Also keep an eye on the RSI symmetrical Support Zone after Overbought rejections, for clues on where the price may rebound. We already broke inside it.
--------------------------------------------------------------------------------------------------------
** Please support this idea with your likes and comments, it is the best way to keep it relevant and support me. **
--------------------------------------------------------------------------------------------------------

I trade Crypto, Forex, Indices & Commodities on PrimeXBT — all from one account with TradingView charts 👉 tradingshot.short.gy/PrimeXBT
I also use TradeNation for fixed spreads & zero commission 👉 tradingshot.short.gy/Tradenation
I also use TradeNation for fixed spreads & zero commission 👉 tradingshot.short.gy/Tradenation
คำจำกัดสิทธิ์ความรับผิดชอบ
ข้อมูลและบทความไม่ได้มีวัตถุประสงค์เพื่อก่อให้เกิดกิจกรรมทางการเงิน, การลงทุน, การซื้อขาย, ข้อเสนอแนะ หรือคำแนะนำประเภทอื่น ๆ ที่ให้หรือรับรองโดย TradingView อ่านเพิ่มเติมใน ข้อกำหนดการใช้งาน
I trade Crypto, Forex, Indices & Commodities on PrimeXBT — all from one account with TradingView charts 👉 tradingshot.short.gy/PrimeXBT
I also use TradeNation for fixed spreads & zero commission 👉 tradingshot.short.gy/Tradenation
I also use TradeNation for fixed spreads & zero commission 👉 tradingshot.short.gy/Tradenation
คำจำกัดสิทธิ์ความรับผิดชอบ
ข้อมูลและบทความไม่ได้มีวัตถุประสงค์เพื่อก่อให้เกิดกิจกรรมทางการเงิน, การลงทุน, การซื้อขาย, ข้อเสนอแนะ หรือคำแนะนำประเภทอื่น ๆ ที่ให้หรือรับรองโดย TradingView อ่านเพิ่มเติมใน ข้อกำหนดการใช้งาน