
Yield Curve Inversion IHS Breakout - Recession Warning
MORE RECESSION INDICATORS FLASHING 🚨
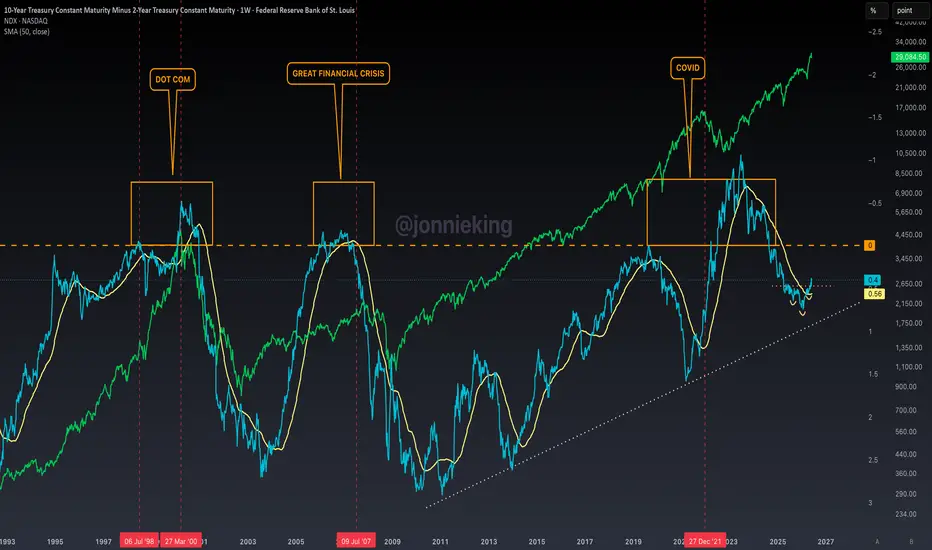
The Yield Curve Inversion chart appears to have broken out of an Inverse Head & Shoulders pattern reclaiming the 50MA.
Note the constant higher lows and higher highs since this trend started making its way back to inversion in 2011.
probably nothing 👀
The Yield Curve Inversion chart appears to have broken out of an Inverse Head & Shoulders pattern reclaiming the 50MA.
Note the constant higher lows and higher highs since this trend started making its way back to inversion in 2011.
probably nothing 👀

การนำเสนอที่เกี่ยวข้อง
คำจำกัดสิทธิ์ความรับผิดชอบ
ข้อมูลและบทความไม่ได้มีวัตถุประสงค์เพื่อก่อให้เกิดกิจกรรมทางการเงิน, การลงทุน, การซื้อขาย, ข้อเสนอแนะ หรือคำแนะนำประเภทอื่น ๆ ที่ให้หรือรับรองโดย TradingView อ่านเพิ่มเติมใน ข้อกำหนดการใช้งาน
การนำเสนอที่เกี่ยวข้อง
คำจำกัดสิทธิ์ความรับผิดชอบ
ข้อมูลและบทความไม่ได้มีวัตถุประสงค์เพื่อก่อให้เกิดกิจกรรมทางการเงิน, การลงทุน, การซื้อขาย, ข้อเสนอแนะ หรือคำแนะนำประเภทอื่น ๆ ที่ให้หรือรับรองโดย TradingView อ่านเพิ่มเติมใน ข้อกำหนดการใช้งาน