
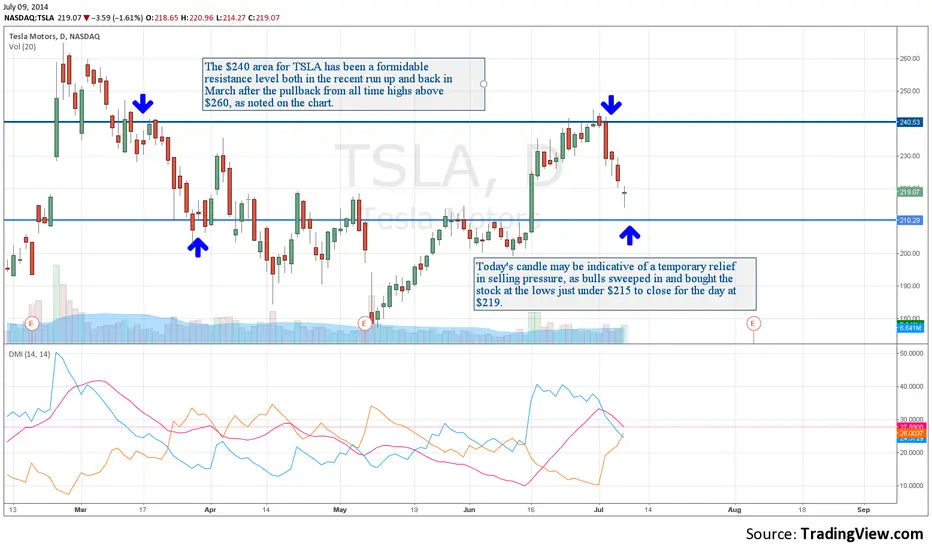
The $240 area for TSLA has been a formidable resistance level both in the recent run up as well as back in March after the pullback from all time highs above $260, as noted on the chart.
Today's candle may be indicative of a temporary relief in selling pressure, as bulls swept in and bought the stock at the lows just under $215 to close for the day at $219.
If the overall markets continue to pullback, it will be interesting to see if the stock can hold the $210 area, as this was the breakout level for June run up.
Blog post dated: 07/08/2014: syncubate.com/blog/2014/7/8/tsla-resistance-overhead
Today's candle may be indicative of a temporary relief in selling pressure, as bulls swept in and bought the stock at the lows just under $215 to close for the day at $219.
If the overall markets continue to pullback, it will be interesting to see if the stock can hold the $210 area, as this was the breakout level for June run up.
Blog post dated: 07/08/2014: syncubate.com/blog/2014/7/8/tsla-resistance-overhead

คำจำกัดสิทธิ์ความรับผิดชอบ
ข้อมูลและบทความไม่ได้มีวัตถุประสงค์เพื่อก่อให้เกิดกิจกรรมทางการเงิน, การลงทุน, การซื้อขาย, ข้อเสนอแนะ หรือคำแนะนำประเภทอื่น ๆ ที่ให้หรือรับรองโดย TradingView อ่านเพิ่มเติมใน ข้อกำหนดการใช้งาน
คำจำกัดสิทธิ์ความรับผิดชอบ
ข้อมูลและบทความไม่ได้มีวัตถุประสงค์เพื่อก่อให้เกิดกิจกรรมทางการเงิน, การลงทุน, การซื้อขาย, ข้อเสนอแนะ หรือคำแนะนำประเภทอื่น ๆ ที่ให้หรือรับรองโดย TradingView อ่านเพิ่มเติมใน ข้อกำหนดการใช้งาน