
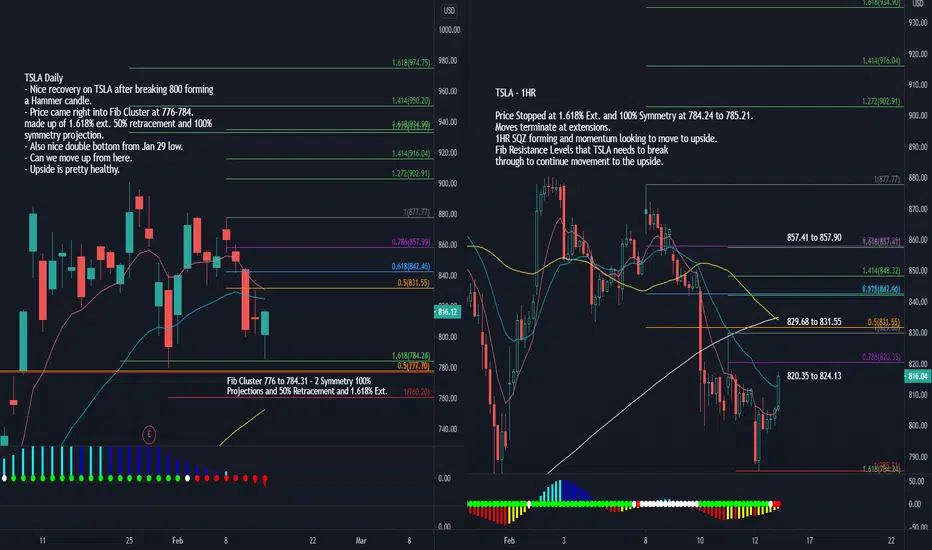
TSLA Daily
TSLA - 1HR
- Nice recovery on TSLA after breaking 800 forming a Hammer candle.
- Price came right into Fib Cluster at 776-784 made up of 1.618% ext. 50% retracement and 100% symmetry projection.
- Also nice double bottom from Jan 29 low.
- Can we move up from here, Upside is pretty healthy.
- Only issue is Daily Squeeze momentum is still to the downside.
TSLA - 1HR
- Price Stopped at 1.618% Ext. and 100% Symmetry at 784.24 to 785.21.
- Moves terminate at extensions.
- 1HR SQZ forming and momentum looking to move to upside.
- Fib Resistance Levels that TSLA needs to break through to continue movement to the upside.

คำจำกัดสิทธิ์ความรับผิดชอบ
ข้อมูลและบทความไม่ได้มีวัตถุประสงค์เพื่อก่อให้เกิดกิจกรรมทางการเงิน, การลงทุน, การซื้อขาย, ข้อเสนอแนะ หรือคำแนะนำประเภทอื่น ๆ ที่ให้หรือรับรองโดย TradingView อ่านเพิ่มเติมใน ข้อกำหนดการใช้งาน
คำจำกัดสิทธิ์ความรับผิดชอบ
ข้อมูลและบทความไม่ได้มีวัตถุประสงค์เพื่อก่อให้เกิดกิจกรรมทางการเงิน, การลงทุน, การซื้อขาย, ข้อเสนอแนะ หรือคำแนะนำประเภทอื่น ๆ ที่ให้หรือรับรองโดย TradingView อ่านเพิ่มเติมใน ข้อกำหนดการใช้งาน