
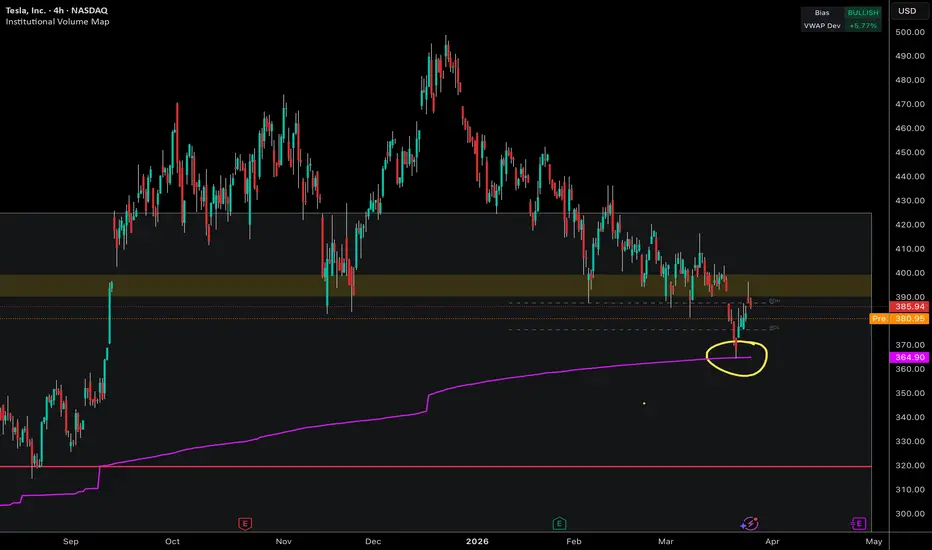
Current Price: ~$385.94 | Pre: $380.57 | Bias: Bullish
The Key Setup — AVWAP Rejection (Yellow Circle)
The purple rising line is an Anchored VWAP (anchored from what appears to be a significant low around August/September 2025). The yellow circle highlights precisely where price wicked down into the AVWAP (~$365–370) and rejected hard to the upside — a textbook bullish AVWAP bounce. This is meaningful because institutional players anchor VWAPs from key events, and a hold + rejection signals they're defending that level as support.
Structure Context:
Peak to downtrend: TSLA topped out near $495–500 in December 2025 and has been in a sustained correction
Institutional Volume Map (gold/olive band, ~$390–408): Previously support, now acting as overhead resistance — price is currently pinned just below this zone after the bounce
EPH dashed lines (~$385–390): Short-term equal highs that price is now pressing into after the AVWAP rejection
Red horizontal line (~$320): The macro floor — a break below AVWAP would likely target this
Bullish Thesis:
The AVWAP rejection combined with the bullish bias label suggests the read is: price found institutional support at the rising AVWAP, bounced, and is now pushing back into the volume zone overhead. A clean reclaim and hold of the $390–408 institutional band would be a meaningful structural shift back to the upside.
Risk: If the pre-market weakness ($380.57) follows through and price loses the AVWAP, that support thesis fails quickly.
The Key Setup — AVWAP Rejection (Yellow Circle)
The purple rising line is an Anchored VWAP (anchored from what appears to be a significant low around August/September 2025). The yellow circle highlights precisely where price wicked down into the AVWAP (~$365–370) and rejected hard to the upside — a textbook bullish AVWAP bounce. This is meaningful because institutional players anchor VWAPs from key events, and a hold + rejection signals they're defending that level as support.
Structure Context:
Peak to downtrend: TSLA topped out near $495–500 in December 2025 and has been in a sustained correction
Institutional Volume Map (gold/olive band, ~$390–408): Previously support, now acting as overhead resistance — price is currently pinned just below this zone after the bounce
EPH dashed lines (~$385–390): Short-term equal highs that price is now pressing into after the AVWAP rejection
Red horizontal line (~$320): The macro floor — a break below AVWAP would likely target this
Bullish Thesis:
The AVWAP rejection combined with the bullish bias label suggests the read is: price found institutional support at the rising AVWAP, bounced, and is now pushing back into the volume zone overhead. A clean reclaim and hold of the $390–408 institutional band would be a meaningful structural shift back to the upside.
Risk: If the pre-market weakness ($380.57) follows through and price loses the AVWAP, that support thesis fails quickly.

Daily top picks analysis → free & paid tiers
Custom Institutional volume terminal included with paid sub
thecantillonreport.substack.com/?utm_source=tradingview
cantillonresearch.com/
youtube.com/@cantillonresearch
Custom Institutional volume terminal included with paid sub
thecantillonreport.substack.com/?utm_source=tradingview
cantillonresearch.com/
youtube.com/@cantillonresearch
คำจำกัดสิทธิ์ความรับผิดชอบ
ข้อมูลและบทความไม่ได้มีวัตถุประสงค์เพื่อก่อให้เกิดกิจกรรมทางการเงิน, การลงทุน, การซื้อขาย, ข้อเสนอแนะ หรือคำแนะนำประเภทอื่น ๆ ที่ให้หรือรับรองโดย TradingView อ่านเพิ่มเติมใน ข้อกำหนดการใช้งาน
Daily top picks analysis → free & paid tiers
Custom Institutional volume terminal included with paid sub
thecantillonreport.substack.com/?utm_source=tradingview
cantillonresearch.com/
youtube.com/@cantillonresearch
Custom Institutional volume terminal included with paid sub
thecantillonreport.substack.com/?utm_source=tradingview
cantillonresearch.com/
youtube.com/@cantillonresearch
คำจำกัดสิทธิ์ความรับผิดชอบ
ข้อมูลและบทความไม่ได้มีวัตถุประสงค์เพื่อก่อให้เกิดกิจกรรมทางการเงิน, การลงทุน, การซื้อขาย, ข้อเสนอแนะ หรือคำแนะนำประเภทอื่น ๆ ที่ให้หรือรับรองโดย TradingView อ่านเพิ่มเติมใน ข้อกำหนดการใช้งาน