
In this writeup we will discuss the relationship between breakouts and volume. We will also discuss why we don't see high volume on volume profile in case of a strong breakout while there is significantly higher volume on the breakout bar.
Let's first discuss a little about Breakouts
Everyone must have heard about breakouts. In simple terms a breakout happens when the price of a stock moves strongly above a resistance level.
In complex terms, a breakout happens because the market becomes temporarily off-balance after a significant period of balance.
In the balanced state, buyers and sellers agree upon the price within a range- often called fair value. This phase is also broadly known as Accumulation or Consolidation.
But suddenly, there are more buyers than sellers. Such moments are often characterized by- low liquidity and wider spreads because price moves too quickly and everyone wants to get in.
This creates market inefficiency, where price rapidly searches for a new fair value. As strong buying pressure enters the market, momentum increases and pushes the stock sharply in one direction.
Why Volume is important at the Breakouts?
Volume is very important during a breakout because it shows the strength behind the price move. When a stock breaks an important level with high volume, it means a large number of buyers are taking part in the move.
This increases the chances that the breakout is real and strong.
But if a breakout happens with low volume, it may not last long because fewer people are supporting the move.
In simple words, volume acts like the fuel of a vehicle- without enough fuel, the move may stop quickly.
Why do you observe a Low Volume Node at the Strong Breakouts?
During a breakout, the vertical volume bars may show very high volume because a lot of activity is happening in that candle.
But on the volume profile, you can still see a low volume node because the price moved very quickly through that area without spending much time there.
Due to that reason, the breakout area stays “less crowded” on the volume profile. A low volume node simply shows that price quickly passed through that zone instead of staying and trading there for a long time.
Inversely, a High-Volume Node occurs when price stays in an area for a longer time (see chart and observe).
Thus, a LVN is simply another indication of a strong breakout or an off-balance market.
How LVN help in Trading?
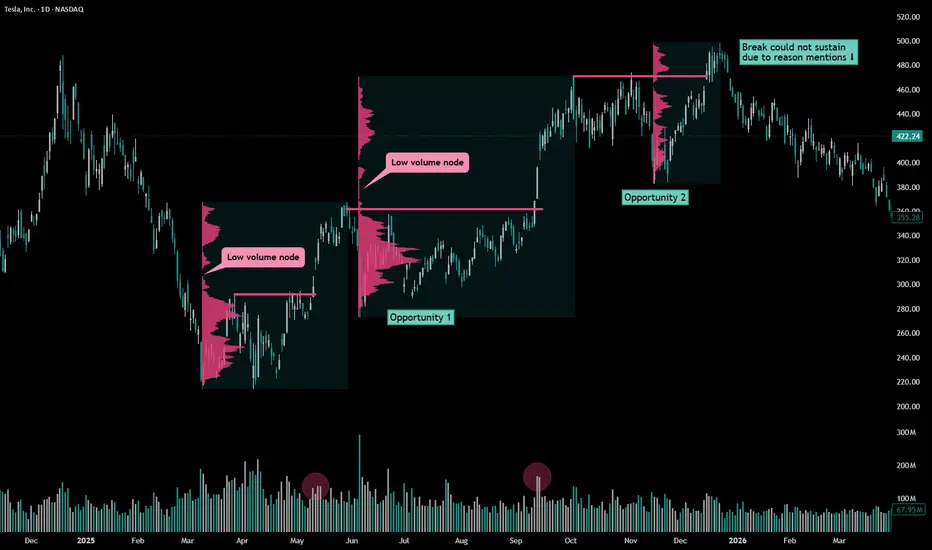
Let's take an example of TESLA daily chart and explain how LVNs offer good opportunities.
This discussion is based upon a few assumptions-
-Price rotated in a range (Balance) before the breakout (Off-Balance)
-Price breaks out of the range (resistance) with strong bar volume
-A LVN is created above the breakout level
-Price moves significantly above the breakout level
-Consolidation above the breakout level is a big no-no
If the above conditions are fulfilled, then a pullback to the LVN may offer a good re-load to the buyers.
Opportunity 1-

-Price consolidated in Mar-Apr 2025 (balance)
-Strong break in May 2025 (off-balance)
-High volume bars and a LVN at the break
-Price pulled back to LVN in June 2025 offering good opportunity
Opportunity 2-

-Three months of price rotation
-Strong break in Sep 2025
-All conditions met
-Pullback to LVN in Nov 2025 offering good opportunity
Notice why Dec 2025 break could not sustain

-Price rotated before break
-Break was not strong
-Not very significant bar volume
-No LVN formation above the breakout level
-Price started consolidating after breakout (not acceptable)
-Ultimately a failed breakout near 488 resistance level
* This is optional- For further confirmation one may also look for low volume pullbacks (at LVN) with not much participation by the seller OR high volume pullback (shakeout) with no follow through on the downside.
I hope you learnt something from this writeup. Now open several charts to learn more about this topic.
Do like, comment for more educational ideas in future.
#Not a buy sell recommendation.
Let's first discuss a little about Breakouts
Everyone must have heard about breakouts. In simple terms a breakout happens when the price of a stock moves strongly above a resistance level.
In complex terms, a breakout happens because the market becomes temporarily off-balance after a significant period of balance.
In the balanced state, buyers and sellers agree upon the price within a range- often called fair value. This phase is also broadly known as Accumulation or Consolidation.
But suddenly, there are more buyers than sellers. Such moments are often characterized by- low liquidity and wider spreads because price moves too quickly and everyone wants to get in.
This creates market inefficiency, where price rapidly searches for a new fair value. As strong buying pressure enters the market, momentum increases and pushes the stock sharply in one direction.
Why Volume is important at the Breakouts?
Volume is very important during a breakout because it shows the strength behind the price move. When a stock breaks an important level with high volume, it means a large number of buyers are taking part in the move.
This increases the chances that the breakout is real and strong.
But if a breakout happens with low volume, it may not last long because fewer people are supporting the move.
In simple words, volume acts like the fuel of a vehicle- without enough fuel, the move may stop quickly.
Why do you observe a Low Volume Node at the Strong Breakouts?
During a breakout, the vertical volume bars may show very high volume because a lot of activity is happening in that candle.
But on the volume profile, you can still see a low volume node because the price moved very quickly through that area without spending much time there.
Due to that reason, the breakout area stays “less crowded” on the volume profile. A low volume node simply shows that price quickly passed through that zone instead of staying and trading there for a long time.
Inversely, a High-Volume Node occurs when price stays in an area for a longer time (see chart and observe).
Thus, a LVN is simply another indication of a strong breakout or an off-balance market.
How LVN help in Trading?
Let's take an example of TESLA daily chart and explain how LVNs offer good opportunities.
This discussion is based upon a few assumptions-
-Price rotated in a range (Balance) before the breakout (Off-Balance)
-Price breaks out of the range (resistance) with strong bar volume
-A LVN is created above the breakout level
-Price moves significantly above the breakout level
-Consolidation above the breakout level is a big no-no
If the above conditions are fulfilled, then a pullback to the LVN may offer a good re-load to the buyers.
Opportunity 1-
-Price consolidated in Mar-Apr 2025 (balance)
-Strong break in May 2025 (off-balance)
-High volume bars and a LVN at the break
-Price pulled back to LVN in June 2025 offering good opportunity
Opportunity 2-
-Three months of price rotation
-Strong break in Sep 2025
-All conditions met
-Pullback to LVN in Nov 2025 offering good opportunity
Notice why Dec 2025 break could not sustain
-Price rotated before break
-Break was not strong
-Not very significant bar volume
-No LVN formation above the breakout level
-Price started consolidating after breakout (not acceptable)
-Ultimately a failed breakout near 488 resistance level
* This is optional- For further confirmation one may also look for low volume pullbacks (at LVN) with not much participation by the seller OR high volume pullback (shakeout) with no follow through on the downside.
I hope you learnt something from this writeup. Now open several charts to learn more about this topic.
Do like, comment for more educational ideas in future.
#Not a buy sell recommendation.
บันทึก
บันทึก
Price may or may not revisit the LVN zone after a breakout, which means traders can sometimes miss trading opportunities while waiting for a pullback. However, understanding this behavior can become a powerful tool in your trading arsenal.บันทึก
Pullback to the LVN may offer one push to the previous recent high on the left.
Sometimes the price just shy of LVN no fill you in. But sometimes it just taps it with a nice green bar reflecting the presence of buyers inviting you loud enough.
บันทึก
While some LVN zones remain untapped, other might reflect a good amount of activity around them for a long time.

JJ Singh
Trader/Investor
Moderator, TradingView
🚀Join t.me/jjsingh_2020 ,
A Free Education channel
🚀Tweet at twitter.com/JaySingh_2020
Trader/Investor
Moderator, TradingView
🚀Join t.me/jjsingh_2020 ,
A Free Education channel
🚀Tweet at twitter.com/JaySingh_2020
คำจำกัดสิทธิ์ความรับผิดชอบ
ข้อมูลและบทความไม่ได้มีวัตถุประสงค์เพื่อก่อให้เกิดกิจกรรมทางการเงิน, การลงทุน, การซื้อขาย, ข้อเสนอแนะ หรือคำแนะนำประเภทอื่น ๆ ที่ให้หรือรับรองโดย TradingView อ่านเพิ่มเติมใน ข้อกำหนดการใช้งาน
JJ Singh
Trader/Investor
Moderator, TradingView
🚀Join t.me/jjsingh_2020 ,
A Free Education channel
🚀Tweet at twitter.com/JaySingh_2020
Trader/Investor
Moderator, TradingView
🚀Join t.me/jjsingh_2020 ,
A Free Education channel
🚀Tweet at twitter.com/JaySingh_2020
คำจำกัดสิทธิ์ความรับผิดชอบ
ข้อมูลและบทความไม่ได้มีวัตถุประสงค์เพื่อก่อให้เกิดกิจกรรมทางการเงิน, การลงทุน, การซื้อขาย, ข้อเสนอแนะ หรือคำแนะนำประเภทอื่น ๆ ที่ให้หรือรับรองโดย TradingView อ่านเพิ่มเติมใน ข้อกำหนดการใช้งาน