Long
Long
The German Auto DiscountLast Thursday evening, Volkswagen's supervisory board unanimously approved Zukunftsplan 2030 — the Future Plan. On Friday the shares closed up about 6.5% at €81.30, the strongest name in the Stoxx 600 that day.
Nothing about the company's earnings changed in those 24 hours. What changed was that a room full of people who had been unable to agree, agreed.
What was approved
Around 50,000 further positions go, management included, on top of roughly 50,000 already agreed since late 2024. The model portfolio gets cut by about half by 2035 and offering complexity by around 75% — fewer nameplates, higher volume per model, shared platforms and electronics. Capital tightens, with the 2027–2031 capex and R&D budget set below the previous planning round, and the portfolio of shareholdings slimmed by roughly a third.
The target is nine million vehicles and a nine percent operating margin by 2030. VW's operating margin in the first half of 2026 was 3.8%.
Two things were deferred, and they were the two that would have been hardest politically: a possible spin-off of the core Volkswagen brand, and immediate plant closures. Europe carries more than 500,000 units of excess capacity. Four German plants — Emden, Zwickau, Hanover and Neckarsulm — have no secured follow-on product from 2031 to 2034. The full European production concept is due by the end of June 2027.
So the plants are not closing. They are scheduled for a decision about closing, in twenty-one months.
Worth noting that closure isn't the only option for a plant. Rheinmetall's CEO publicly identified a Volkswagen site as suitable for armoured vehicle production, and another German defence manufacturer has already converted a railcar factory to build tank components. Nothing has been agreed at any of the four plants named here, but it does mean the excess capacity line has a possible buyer attached to it.
Deutsche Bank's note afterwards put it plainly: the approval removed the concern about whether the company was still capable of making hard decisions at all.
That is a repricing of decision-making capacity, not of profit. A company that cannot decide has no path to any outcome. But the plan and the result are separated by four and a half years.
Four companies, one label
German autos get discussed as a single trade. Up close, they don't behave like one.
Every German carmaker is dealing with the same headline problems. China turned from profit engine into a shrinking, hostile market. US tariffs on European-built cars have been moved, negotiated, litigated and threatened repeatedly. The EV transition arrived slower and more expensively than planned. German cost and energy stayed high while European volumes stayed below pre-Covid levels.
Same weather, four boats. But the market has not priced them anywhere close to alike, and the gap between the valuations is far wider than the gap between the businesses.
Volkswagen
The volume problem in its purest form. An operating margin around 4% and a return on equity under 3%. Nine million vehicles a year produced by a company that struggles to make money on any of them.
The market's verdict is the most extreme in the sector: roughly a fifth of book value. When a company trades there, the market is not saying "bargain." It is saying that a large share of those assets — the plants, some of the brands, the Chinese joint ventures — will not earn their cost of capital. The bad outcome is already assumed.
BMW
This is the one quietly working, and it gets much less attention than the others.
More profit than Volkswagen on 40% of the revenue, on double the operating margin and more than double the return on equity.
Here is the cleanest way to see what that's worth. The two companies earn almost exactly the same amount per share: €10.46 at Volkswagen against €10.38 at BMW. Volkswagen's shares cost €81.30. BMW's cost €62.64.
Same earnings per share, and Volkswagen costs 30% more. Because the per-share figures are near-identical, the price gap is the valuation gap.
BMW also pays a higher dividend, posted the only earnings beat in the group last quarter, and is down more this year — roughly a third against Volkswagen's fifth.
BMW's China deliveries fell about 20% in the first half. It is not immune. It has simply been hit less hard, and it went into the downturn with a stronger mix and a more flexible plant structure.
Mercedes-Benz
The China luxury story, in full. First-half China sales fell roughly 28%.
Operating margin sits between VW and BMW, and the dividend yield is the highest of the four. But it is not the cheap one — Mercedes trades at a higher multiple of earnings than Volkswagen and considerably higher than BMW, and its payout ratio is the most stretched of the group at roughly two-thirds of earnings, against under 40% at the other two.
Mercedes carries a specific structural exposure the others don't share equally: a large share of what it sells in the US is built in Europe, which makes it more sensitive than most to whatever the tariff rate turns out to be.
Porsche AG
And then there's this one.
Porsche's China deliveries fell about a third in the first half — the worst of the four. The dividend has been cut. The most recent quarter was a loss.
It trades at roughly 1.9x book, against Volkswagen's 0.2x.
There is something that partly explains the premium. Porsche's EBITDA margin is about 23.6%, comfortably the highest of the four and well ahead of Volkswagen's 15%. The business is more profitable than the loss suggests — depreciation and charges are doing the damage. The market isn't only paying for the badge.
The comparison
Trailing P/E — Volkswagen ~7.8x, BMW ~6.0x, Mercedes ~9.0x, Porsche ~40x
Price to book — Volkswagen ~0.20x, BMW ~0.5x, Mercedes ~0.5x, Porsche ~1.9x
Dividend yield — Volkswagen 6.5%, BMW 7.0%, Mercedes 7.6%, Porsche 2.4%
H1 China deliveries — Volkswagen −26%, BMW −20%, Mercedes −28%, Porsche −32%
All four reported recently, into the same conditions. Volkswagen missed expectations by about 46%. BMW beat by roughly 9%. Mercedes missed by around 10%. Porsche lost money. One quarter is noisy and auto earnings are lumpy with provisions and charges — but four companies, one set of headwinds, four different results is the argument of this whole piece in a single row.
Now look at Volkswagen and Porsche together.
Volkswagen's entire market capitalisation is about €40.8 billion. Volkswagen owns roughly 75% of Porsche AG, which the market values at about €38.7 billion — so that stake alone is worth somewhere near €29 billion.
Which implies the market values everything else inside Volkswagen — nine million vehicles a year, Audi, Škoda, SEAT, Cupra, Bentley, Lamborghini, Ducati, the Traton truck group, PowerCo, financial services — at something like €12 billion.
Caution here, because this is the kind of observation that looks like free money and isn't. VW carries a large net debt position, most of it inside captive finance. Holding-company and conglomerate discounts are completely normal and usually permanent. A stake you cannot sell is not worth the same as cash.
What the charts say
I've marked the zones where price reacted on each one
What they share: Volkswagen, BMW and Mercedes sit near the bottom of multi-year ranges.
Volkswagen has been in a trading range for about 4 years. It has bounced off a band near 69 that has now held twice. The zone above, around 101–109, is where the stock has been sold and price turned down again.
Four years of going nowhere is its own kind of information. A stock repeatedly sold at the top of its range and bought at the bottom is a stock the market has made up its mind about, and a fifth of book value is what that verdict looks like on the balance sheet. This is roughly where value investors do their shopping — after the damage, not during it.
BMW ranged widely between the high 50s and the mid 90s for four years and only arrived at the bottom of that range this summer - which puts the best numbers of the four at their lows for the first time in years.
Mercedes is also in a wide trading range. The line near 44 has held four times. In spring 2025 price fell through it and touched a lower support zone that had held since 2022. But price quickly reversed and moved up to the upper zone.
Porsche has spent more than a year inside a band roughly between 34 and 48. Its downtrend line broke over a year ago and it has been building a base since.
It's tempting to say the market has simply refused to reprice Porsche. It hasn't. Porsche fell about 65% from its 2023 peak — the worst of the four — and sits only a few percent above its all-time low. The repricing happened. It started from a level extravagant enough that losing two-thirds of the price didn't make it cheap.
What's actually shared, and what only looks shared
The headwinds are shared. The exposure isn't.
China hit all four, and hit the most expensive brands hardest — which is the opposite of what the valuations imply. Tariffs hit whoever builds in Europe and sells in America, which is Mercedes and Porsche far more than the others. Overcapacity and the German cost base are Volkswagen's problem far more than BMW's, because scale that can't be filled is only expensive when you have a lot of it. The EV transition is everyone's problem, but the money already sunk into it is very unevenly distributed.
So what it comes down to is this: the market has applied one discount to a sector containing four quite different companies, and then applied a completely separate rule to the one whose brand still commands a premium its reported earnings don't.
Whether that is a mistake or good judgement is the actual question here.
What I'd watch rather than predict
A few things that will tell you which way this goes before the 2030 targets do.
VW's June 2027 European production concept. That is the real test of whether capacity comes out or the deadline moves again.
Margin progression rather than margin targets. The gap from 3.8% to nine percent is enormous. Mid-single digits by 2028 would be a completely different story than flat.
Chinese relative share rather than absolute volume, since the whole market is shrinking and absolute numbers currently tell you as much about China as about any German carmaker.
Whether Volkswagen's next quarter looks anything like the last one. A 46% miss is one data point. Two in a row is a pattern.
And whether Porsche's premium survives another year of the numbers it has been printing. That gap closes eventually — the open question is from which direction.
Where I land personally
I might add some of these to my European dividend portfolio. Real assets that hold something in an inflationary environment. These carmakers will never move like the hot US tech and AI names, and that's fine, because that's not the job they're doing. As a European I also like holding assets in my home currency. Different portfolios, different logic, different risk profile.
And to be clear about what I'd be buying it for: two things, not one. The dividend is the part that pays for waiting. The re-rating is the part that pays if the turnaround is real. Neither alone would probably interest me much — a high yield on a business that keeps shrinking is just a slower way to lose money, and a turnaround with no income attached would mean paying to wait. Together they're a reasonable shape for me.
So this sector is naturally on my list. If I buy here, the bet is simple: that the turnaround is real, and that the market is currently paying me to wait while it happens.
Do I think the Germans can do it? On the manufacturing side, probably. This is a country that has spent a century being extremely good at building things, and Volkswagen's plan attacks the right variables — model sprawl, headcount, capital discipline, decision speed. Those are problems German industry has solved before.
What gives me more pause is the layer above the companies. Energy costs in Germany are among the highest in Europe, and that is a structural input none of these four control. They can fix their model portfolios. They cannot fix what it costs to run a factory in Lower Saxony. Some of what's weighing on these businesses is not a company problem at all.
Porsche I'd leave out either way because whatever discount I'd be buying, it isn't there. That doesn't mean the price can't go higher.
Beyond that I haven't yet decided, and the deciding is a decent mental exercise in itself. A few versions of the same idea:
Equal weight across Volkswagen, BMW and Mercedes. The lowest-conviction version — it takes the sector view without needing to be right about which company. The cost of not choosing is that you put the same money into the best-run one, and the cheapest on earnings, as into the most expensive one.
Tilted toward Volkswagen. Something like half in VW, a quarter each in the others. This is the restructuring bet: VW is by far the cheapest on assets, so it has the most to re-rate if the plan works. What you're accepting is that you're paying more per euro of current earnings than BMW asks, for a company with half the margin — and one that just missed expectations by 46%.
Tilted toward BMW. The mirror image, and the one the numbers point at more directly. Cheaper on earnings, double the margin, higher dividend, the only beat in the group last quarter. This isn't a bet on a turnaround at all — it's a bet that a company already working has been marked down with the sector and gets re-rated when the sector does.
Volkswagen alone. The highest-conviction version, and a different bet entirely — one company and timing, since it assumes the plan was the turn rather than just an event on the way. Both can be wrong independently, and the last quarter is a reminder that the operating business hasn't turned yet even if the governance has.
Or nothing yet. Wait for more data and monitor price action. After all, sidelines are a position, and there's no rule saying this has to be decided now.
Five versions, and they don't even agree on what cheap means. Volkswagen is cheapest on what it owns. BMW is cheapest on what it earns. Which of those you find more convincing decides most of the answer before you get to the weightings.
Three German carmakers is company diversification, not diversification. They share a sector, a country, a currency, a labour system and a tariff exposure. In the scenario that actually hurts — Chinese brands take another ten points of European share, or the trade situation goes the wrong way — all three go down together. It removes the risk of picking the wrong one. It does nothing about the risk of being wrong on the whole thesis.
The dividend makes the waiting bearable, not free. A 7% yield covers a 7% decline. It does not cover a 40% one. And it's calculated on earnings that have already fallen a long way — a payout that looks safe against depressed profits looks different again if profits fall further. It softens the wait. It is not a floor.
One thing before I finish
Everything above is dated 4 September 2026 and half of it will be wrong within a year. Auto data is genuinely messy — captive finance, equity-accounted joint ventures and one-off items land differently on different screens. Just check the date on anything that matters to a position.
Which of the four looks most interesting to you — the cheapest one, the best-run one, or the one whose premium hasn't cracked yet? Or no sound investment here? Feel free to get a discussion going in the comments.
Thanks for reading 😉  Long
Long
SDLF Earnings | Profits Up, Big Acquisition AheadStandard Life plc came out of its latest earnings release with a pretty solid message:
the retirement specialist is still growing cash generation and operating profits while pushing aggressively into the UK pensions market
The company reported H1 2026 operating cash generation of £745 million, up 6% year over year, while total cash generation jumped 15% to £900 million. IFRS adjusted operating profit was even stronger, rising 25% to £563 million, and assets under administration increased to £333 billion from £317 billion at the end of 2025. That combination of higher profits, more assets and stronger cash generation suggests the underlying business is moving in the right direction, even though the headline IFRS result remained a £179 million loss after tax
The Retirement Machine Is Getting Bigger
The most important story behind these numbers is Standard Life's focus on Pensions & Savings, particularly workplace and retail retirement products. That division delivered £324 million of IFRS adjusted operating profit in H1, up 13% from £286 million a year earlier, with the operating cash generation margin holding at a healthy 222 basis points. Management says growth in assets and improving margins are driving the earnings improvement, while the company expects to deploy up to roughly £200 million of capital into Pension Risk Transfer and Individual Annuities during 2026. In other words, SDLF isn't simply trying to collect pension fees and chill. It is deliberately moving deeper into the retirement income market, where long-duration assets and recurring fee income can create a much more predictable earnings base
Aegon Deal Is The Big Wild Card
Then comes the elephant in the room, Aegon UK .. Standard Life agreed to acquire the business for approximately £2 billion, using a mix of cash, debt and 181 million newly issued shares. The transaction would make Standard Life the largest UK pensions and savings player on a pro forma basis, with particularly strong positions in workplace and retail pensions. Management expects the deal to generate around £800 million of net synergies and increase excess cash by roughly £400 million over five years
Completion is expected around the end of 2026, subject to regulatory approval. Strategically, this is huge because SDLF is effectively betting that scale will make its retirement platform more profitable and capital efficient. The risk, obviously, is execution, large acquisitions can create integration costs, dilution and balance sheet pressure before those promised synergies actually arrive
Pension Risk Transfer Could Be The Next Growth Engine
Standard Life is also going after the increasingly attractive UK Pension Risk Transfer (PRT) market. In August, the company announced a partnership with CVC, Prudential Financial, Goldman Sachs, MS&AD and other institutional investors with up to £2 billion of combined initial capital commitments, including £500 million from Standard Life. The goal is to allow SDLF to compete for much larger defined benefit pension transactions. That matters because the UK buy in/buyout market has become highly competitive, and Standard Life is trying to move toward the largest deals rather than fighting only for smaller mandates. Just days before the earnings release, Standard Life also awarded £3 billion in emerging markets and Asia ex Japan mandates to Ninety One, showing that the company continues to actively reshape how it manages customer assets.
The Bull Case Is Strong, But Watch The Capital
Overall, the latest results leave SDLF looking more like a steady compounder in the retirement and pensions space than a high growth financial stock. Operating profit is growing quickly, cash generation is improving and management says it remains on track for its 2026 targets, including roughly £1.1 billion of adjusted operating profit and £250 million of annual run rate cost savings. Cost savings had already reached £210 million by the end of H1. The main thing investors need to watch is capital: the shareholder capital coverage ratio slipped from 176% at year-end 2025 to 169%, while the Solvency II leverage ratio improved to 29%, right around management's target. The company also raised its interim dividend to 28.05p per share, up from 27.35p.
So the story is increasingly compelling, but the next phase depends on SDLF proving that the Aegon acquisition and new PRT partnership can translate all this strategic ambition into sustained earnings and cash returns. For now, the earnings trend is bullish, the strategic setup is ambitious, and the market has a very clear catalyst to watch as Aegon moves toward completion.  Long
Long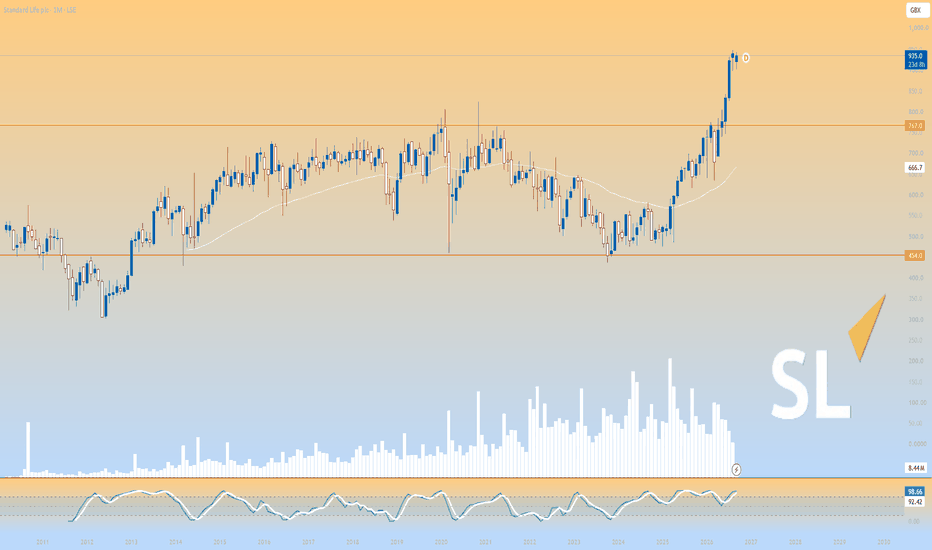
 Long
Long
Broadcom Just Dropped a Massive AI ForecastBroadcom’s Q3 revenue jumped 86% Y/Y to $29.6 billion, beating expectations by $160 million. Non GAAP EPS came in at $3.32, $0.08 above estimates
The semiconductor business was the main growth engine. Semiconductor solutions revenue surged 127% to $20.8 billion, with AI semiconductor revenue up an impressive 221% Y/Y and 54% Q/Q to $16.7 billion. That was also above the $16 billion outlook Broadcom gave last quarter. Infrastructure software continued to improve as well, with revenue rising 29% to $8.8 billion
The bigger story, however, was Broadcom’s updated outlook for the years ahead. The company now expects $115 billion in AI semiconductor revenue for FY27, up from its previous $100 billion target. It is also forecasting a massive $230 billion for FY28.
Q4 AI semiconductor revenue is expected to hit $21.7 billion, representing 236% Y/Y growth and another major acceleration
Broadcom’s customer base includes some of the biggest names in AI. Anthropic is expected to become its largest custom XPU customer in FY27, with OpenAI potentially moving into second place. Google is already generating a multi tens of billions dollar annual business, while Meta is ramping across several generations of chips
Management also says demand from its four largest AI customers is still higher than what Broadcom can physically supply.
That supply constraint is pushing Broadcom toward more vertical integration. The company plans to bring substrate production online in Singapore during FY27 while continuing to expand its networking business alongside custom AI compute. Its new 200 Tbps Tomahawk 7 Ethernet switch is another key part of that strategy
After Q2, investors were questioning whether Broadcom’s $100 billion FY27 AI target was simply conservative guidance. One quarter later, the company has raised it by $15 billion. The new $230 billion FY28 target suggests AI semiconductor revenue could nearly quadruple from FY26 levels in just two years  Long
Long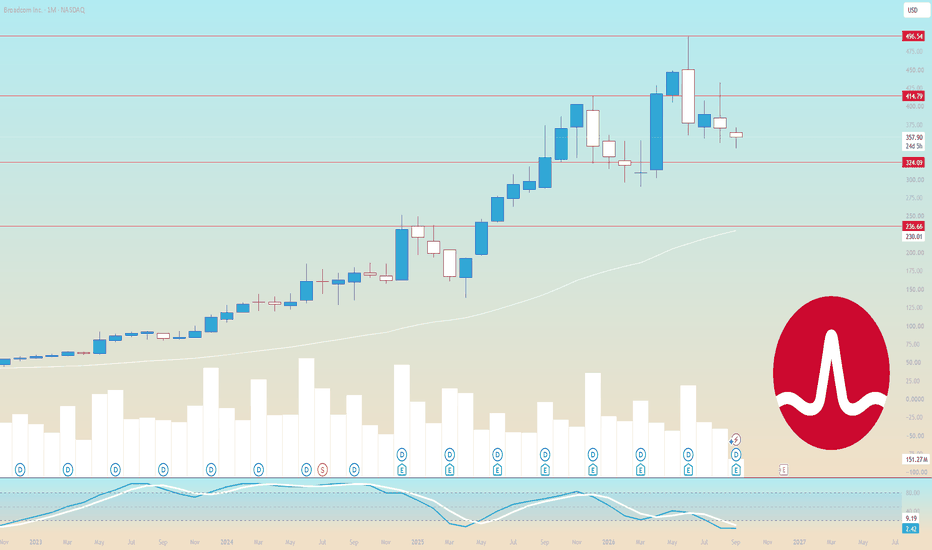
"LULULEMON (LULU) — $516 to $100: Is the Pain Priced In?”LULULEMON NASDAQ:LULU — FROM $516 TO $100: FALLING KNIFE OR GENERATIONAL RESET?
———————————
NASDAQ:LULU has finally reached an area where I'm becoming interested from a long-term perspective.
But I'm approaching this one very differently from simply saying, "the stock is down 80%, so it must be cheap."
NASDAQ:LULU has fallen from its 2023 all-time high around $516 to approximately $100, and the latest earnings show that there are legitimate reasons behind the decline.
So I'm not trying to catch the exact bottom.
I'm looking for evidence that the business AND the chart are beginning to stabilize.
———————————
MONTHLY STRUCTURE
My immediate area is $97–105.
The psychological $100 level is important, but after such a powerful downtrend I don't consider it confirmed support yet.
If $100 fails, my major downside areas are:
$88–92
$78–82 — Major Monthly Demand
$68–72 — Major Long-Term Support
$55–60 — Deep Capitulation Zone
These are areas where I would reassess price action rather than automatically buy simply because price reaches them.
———————————
WEEKLY STRUCTURE
The first thing I want to see is NASDAQ:LULU stop making lower lows.
My preferred sequence would be:
$98–105 holds → base develops → higher low → $120–125 reclaimed.
Above that, I'm watching:
$135–145
$160–175
$200–225
If NASDAQ:LULU can eventually reclaim $160–175 and establish it as support, I would consider that a much more meaningful long-term change in structure.
———————————
LONG-TERM PROJECTIONS
If a genuine turnaround develops, my progressive upside roadmap becomes:
$120–125 → $135–145 → $160–175 → $200–225 → $250–275 → $300–325
I'm deliberately NOT projecting an immediate return to the $516 ATH.
The company needs to earn that valuation again.
———————————
FUNDAMENTALS
This is where the story gets interesting — and risky.
Lululemon's NASDAQ:LULU latest quarter showed continued deterioration in the business. Revenue was approximately $2.42B, Americas revenue declined 8%, and management cut FY2026 guidance again.
The company now expects revenue to decline approximately 5–7%, with FY EPS expected around $9.48–$9.73.
The decline in its core leggings business is particularly concerning.
LULU isn't simply fighting a weak consumer. It is dealing with changing fashion trends, product execution problems and much stronger competition.
That makes this a genuine turnaround.
However, the valuation has also undergone an extraordinary reset.
At roughly $100, LULU trades at a fraction of the valuation investors were previously willing to pay for the business.
The company still has a globally recognized premium brand, significant cash resources and a new CEO coming in with the opportunity to reset product strategy and rebuild consumer momentum.
———————————
MY THESIS
I'm not buying the story simply because NASDAQ:LULU has fallen from $516 to $100.
What I'm looking for is convergence:
Historically depressed valuation + major technical support + business stabilization + improving product momentum.
If those begin appearing together, I believe the long-term risk/reward could become very attractive.
Technically, my bullish roadmap is:
Hold $98–105 → reclaim $120–125 → higher low → break $135–145 → attack $160–175.
From there, $200–225 becomes my first major long-term recovery objective.
The bearish roadmap is equally clear:
Lose $98 → $88–92 → $78–82 → $68–72
with $55–60 reserved for a deeper capitulation scenario.
At this stage, I see LULU as a potential turnaround/accumulation opportunity — NOT a confirmed bottom.
I'm watching $100 closely, but I'm letting price prove the thesis rather than trying to predict it.
———————————
Market Analysis with Ken
NFA — these are my personal chart observations and market analysis.
Not Financial Advice
The content published here including articles, analysis, market commentary, tools, and any other information, is for informational and educational purposes only. It is not, and should not be construed as, financial advice, investment advice, trading advice, or any other form of professional advice.
Snowflake Earnings Show AI MomentumSnowflake’s growth acceleration is starting to look more like a trend than a one quarter jump
Product revenue grew 37% Y/Y to $1.49 billion, accelerating from 34% last quarter and 30% two quarters ago. Total revenue increased 35% Y/Y to $1.55 billion, beating estimates by $70 million, while nonGAAP EPS came in at $0.62, $0.17 above expectations
Management also raised FY27 product revenue guidance by $230 million to $6.07 billion, pushing expected growth to 36% Y/Y
Looking at the bigger picture, Snowflake’s FY27 product revenue growth outlook has gone from 27% to 31% to 36% in just six months. And the momentum may not be slowing
Q3 guidance calls for 37% to 38% product revenue growth, slightly ahead of Q2
CEO Sridhar Ramaswamy said AI products directly account for roughly half of Snowflake’s recent growth acceleration. But the overall impact could be even bigger because AI is also helping drive migrations and increasing usage across Snowflake’s core data platform
Key numbers
Net revenue retention: 126% (+1pp Y/Y)
$1M+ customers: 828 (+27% Y/Y)
Remaining performance obligations: $9.0 billion (+30% Y/Y)
NonGAAP operating margin: 15% (+4pp Y/Y)
GAAP operating margin: -17% (+13pp Y/Y)
RPO was one of the weaker numbers, falling from $9.2 billion to $9.0 billion sequentially despite growing 30% Y/Y. Management pointed to Q2 renewal seasonality and customers consuming more quickly than their contractual schedules.Given Snowflake’s consumption-based model, actual usage and product revenue are arguably better indicators of the underlying business
The gap between GAAP and adjusted margins is still significant, largely because of Snowflake’s heavy use of stock based compensation, which represented 27% of revenue. That’s still a very high level, but it has fallen 12 percentage points from a year ago, so the trend is moving in the right direction
AI is strengthening the core business
Cortex Code (CoCo) surpassed 9,100 accounts, adding more than 2,000 during the quarter. CoWork also grew to 5,800 accounts
These products generate direct AI consumption, but the bigger opportunity may be what they do for the rest of Snowflake’s platform
As companies deploy more AI applications, they need more governed data for those systems to access. More employees can interact with that data through conversational interfaces, while AI agents can retrieve information, analyze it, and eventually take actions. Every new workload can translate into more Snowflake consumption
AI is also helping Snowflake move existing workloads onto its platform faster. Coding models can automate parts of legacy migrations that previously required large teams and months or even years of manual work
That creates an interesting flywheel. AI generates new workloads while also making it easier to migrate existing ones to Snowflake. That helps explain why the core business is accelerating alongside the AI portfolio instead of being replaced by it
The customer numbers tell a similar story.Snowflake added 692 net new customers,up 32% Y/Y
The number of customers generating more than $10 million in trailing annual product revenue also jumped to 65, compared with 45 a year ago. For a consumption based business, that expansion is important. Snowflake needs customers to keep finding new ways to use their data, and AI is creating plenty of those opportunities
The gross margin tradeoff
Snowflake lowered its FY27 nonGAAP product gross margin outlook from 75% to 74%, partly because AI workloads come with additional model and inference costs
At the same time, the company raised its operating margin guidance from 13.5% to 14.5%
That combination is important. Snowflake is accepting some additional AI related costs at the gross margin level while still finding operating leverage as revenue grows
Snowflake’s AI story is starting to look less defensive and more like a genuine growth driver. Product revenue has accelerated from 30% to 37% in just two quarters, while operating margins continue to improve
Palo Alto Earnings | The AI Security Boom Is HerePalo Alto Networks wrapped up Q4 FY26, ending in July, with revenue up 34% year over year to $3.4 billion, beating estimates by $60 million. NonGAAP EPS came in at $1.02, $0.04 above expectations
The headline growth numbers are still somewhat distorted by acquisitions, but the underlying demand was strong.. Palo Alto added a record $970 million in net new Next Gen Security ARR and completed roughly 220 net new platformizations, up 44% year over year and roughly double Q3. In simple terms, more customers are choosing to buy multiple Palo Alto products instead of individual security tools
The company ended FY26 with a 38% adjusted free cash flow margin, maintaining its high 30% profitability even after absorbing two major acquisitions, CyberArk and Chronosphere
GAAP results looked much worse, with Palo Alto reporting a $282 million net loss. However, much of that was driven by accounting items rather than the underlying business. The quarter included a $524 million mark to market loss tied to CyberArk convertible notes, $281 million in acquired intangible amortization, and $487 million in stock based compensation
For FY27, Palo Alto expects revenue of $14.1 billion to $14.2 billion, implying roughly 23% to 24% growth and coming in above consensus. Management expects NGS ARR to grow 22% to 23% to around $11.1 billion, while maintaining its 38% adjusted FCF margin target
Management also reaffirmed its goal of reaching a 40%+ adjusted free cash flow margin in FY28 and $20 billion in NGS ARR by FY30
For investors, the biggest question is whether Palo Alto's aggressive M&A strategy can create meaningful synergies rather than simply adding revenue. So far, the early cross-selling data is encouraging.
Platformization Is Accelerating
Next Gen Security ARR reached $9.1 billion, up 63% year over year, while remaining performance obligations climbed 34% to a record $21.2 billion
Those figures still benefit significantly from the CyberArk and Chronosphere acquisitions, so they shouldn't be treated as purely organic growth. But Palo Alto also provided a clearer look at how its individual platforms are performing:
Network & AI Security revenue: +17% Y/Y
Cortex revenue: +25%
Idira, the rebranded CyberArk business: +21% on a pro forma basis
Each major platform is therefore still growing at a healthy double digit rate
More importantly, customers are consolidating more of their security spending with Palo Alto. Net retention among platformized customers remained above 120%, and more than 65% of NGS ARR now comes from platformized customers
The company's largest customers are also spending more. Customers generating more than $5 million in NGS ARR increased 45% year over year to 223, while those spending more than $10 million rose 50% to 78
One Q4 telecom deal alone was worth $126 million and included firewalls, SASE, Idira, and Cortex XSIAM. That's exactly the type of multi-product adoption Palo Alto is trying to build its platform around.
The AI Security Stack Is Coming Together
AI agents are creating a completely new security challenge. They generate machine-to-machine traffic, use credentials, access internal data, and increasingly perform tasks without direct human involvement
Palo Alto says agentic traffic across SASE has increased more than 9x in just nine months. That makes AI a growing attack surface, but it also creates a strong reason for companies to upgrade older security infrastructure
Palo Alto is positioning its platform around three major layers
Prisma AIRS: Secure the AI. ARR reached roughly $120 million just one year after launch, making AIRS the company's fastest-scaling product. Customers increased from more than 300 in Q3 to over 800 in Q4. The platform now covers runtime security, agent identities, red teaming, observability, and agent gateways
Cortex: Detect and respond. XSIAM ARR passed $700 million, up roughly 70% year over year, with nearly 1,000 customers. Chronosphere's observability ARR also exceeded $500 million, more than 2.5x its level just two quarters earlier. Even more interesting, half of Chronosphere's Q4 new logos included an XSIAM cross-sell, suggesting Palo Alto is already integrating the acquisition into its wider platform
Idira: Control identity and access. The $25 billion CyberArk acquisition gives Palo Alto control over the credentials and permissions used by humans, machines, and AI agents. Early results are promising. CyberArk ACV grew 27% year over year, Palo Alto won more than 200 new CyberArk customers from its existing installed base, and shared leads between the two sales teams have increased roughly 50% since May.
Put together, the strategy is relatively straightforward: AIRS secures AI applications and agents, Cortex detects and responds to threats, and Idira controls what those users and agents are allowed to access
And there's another piece to the puzzle: autonomous action
Alongside its earnings report, Palo Alto announced the acquisition of Console, an AI-native platform that allows users to create agentic workflows using natural language. The broader goal is to push Cortex beyond simply identifying security problems and toward AI agents that can investigate and remediate those problems automatically.
CEO Nikesh Arora described this evolution as the move toward "software as an agent."
Palo Alto is beginning to show that its acquisition strategy could create something more valuable than the individual businesses it has bought
Platformization is accelerating, AIRS is scaling quickly, and both CyberArk and Chronosphere are already showing signs of cross-selling into Palo Alto's existing customer base. At the same time, AI isn't just creating a new security threat. It's becoming a meaningful source of demand and revenue.
XAUUSD | Gold Market Structure & Liquidity AnalysisXAUUSD | Gold Market Structure, Liquidity & FVG Analysis
This 1D Gold analysis presents a complete price-action study, focusing on candle-by-candle market behaviour, structural shifts, liquidity, Fair Value Gaps (FVGs), support and resistance, and major reaction zones
The chart begins with a strong bullish expansion, where consecutive candles created higher highs and higher lows. Buyers maintained control as price continued to break previous swing levels, producing multiple BOS confirmations. The strong upward candles show aggressive buying pressure and a clear bullish phase
After reaching the major high area, price experienced a sharp rejection. The large bearish candles indicate that sellers entered strongly from the premium region. The following candles became increasingly corrective, creating lower highs and lower lows. This shift in candle behaviour produced MSS and CHoCH signals, confirming a change from the previous bullish structure
During the subsequent decline, bearish candles repeatedly respected the descending structure. Several FVG areas appeared during the impulsive moves, showing zones where price could later return for mitigation. Each retracement candle was followed by renewed selling pressure, keeping the short-term structure bearish
As price approached the lower demand region, bearish momentum gradually weakened. Smaller candles, repeated rejections and consolidation showed that sellers were losing strength. The market eventually formed a base around the major liquidity area, where buyers began to absorb selling pressure
The later candles produced a clear MSS followed by bullish expansion. Strong consecutive bullish candles pushed price away from the demand zone and created a new bullish leg. This move also left several FVGs behind, highlighting potential areas of future price reaction
The latest price action shows a sharp reaction from the lower area followed by rejection from the FVG Resistance zone. The current structure is therefore at an important decision point.
The 4,432 Key Support area is an important level to monitor. If price holds above this region and buyers regain momentum, the next significant area is the 4,619 FVG Resistance, followed by the 4,800 Primary Target and ultimately the higher resistance region around 5,200
On the other hand, if the current support fails, price could return toward the 4,112 Major Demand Zone. A deeper bearish continuation could expose the lower liquidity area around 3,800
Overall, every major candle is interpreted according to its relationship with the previous candles, momentum, liquidity, market structure and reaction zones. The purpose of this analysis is to demonstrate how institutional-style price action can be studied through structure, displacement, FVGs and key liquidity levels
Educational analysis only — not financial advice  Long
Long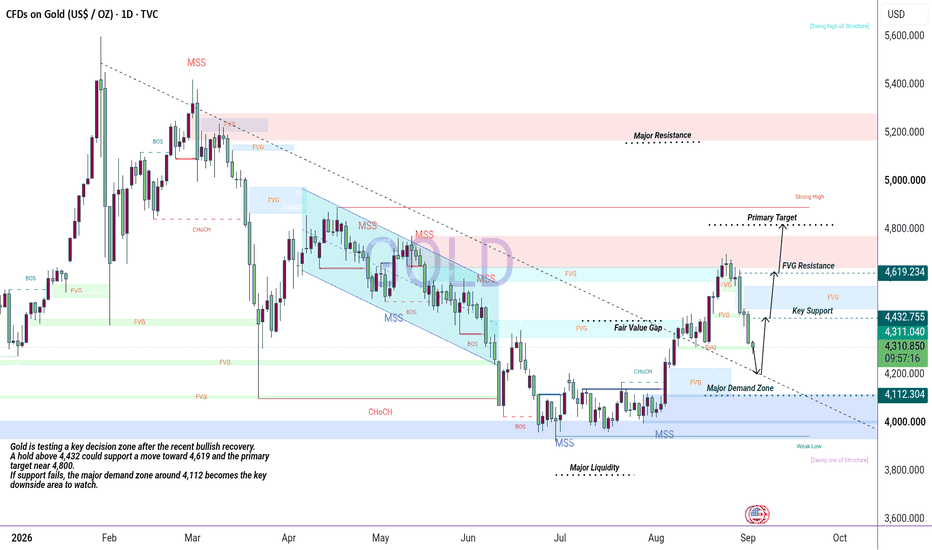
Education 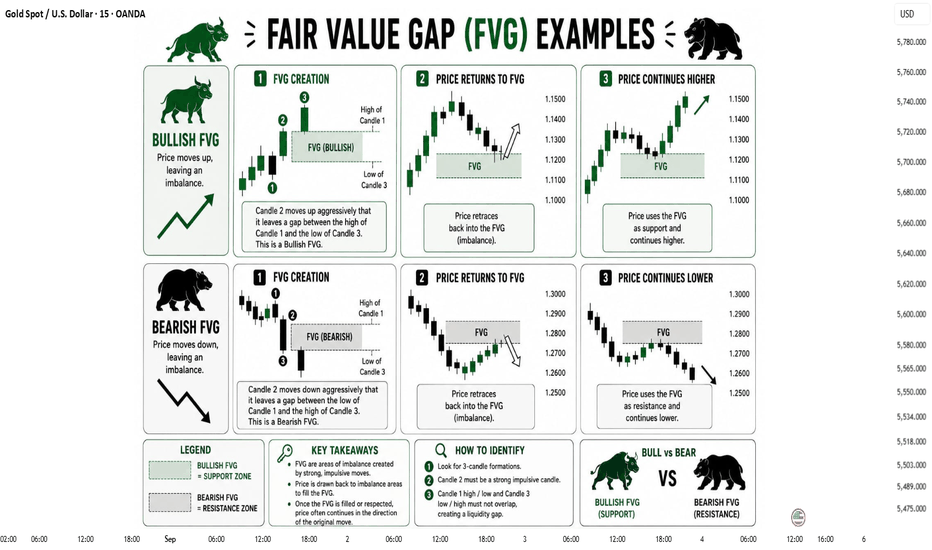
GRAM Has Telegram , So Where’s the Growth?Gram has already shown that it can pump, the problem is that it has also shown the other side of the cycle . After reaching an all time high around $8.25 in June 2024, GRAM has fallen dramatically and is still trading roughly 84% below that peak. That kind of performance tells us something important, the market has been willing to price the Telegram narrative aggressively during bullish periods, but it has not yet been willing to sustain that valuation through a bear market..And that becomes even more important in the next bull cycle.
Even if GRAM manages to pump again, it is competing for attention against hundreds of newer altcoins, memes and emerging gems that can deliver much higher percentage returns from smaller valuations
A large cap token cannot simply rely on its old narrative and expect traders to rotate back into it. The opportunity cost is too high.. The market wants growth, fresh narratives, real adoption and asymmetric upside
The frustrating part is that Telegram has already done the hardest part: distribution. Telegram provides an enormous potential user base, and TON/Gram is deeply integrated into that ecosystem. Telegram also took a more direct role in TON in 2026, while the network received major performance and fee improvements. But the gap between Telegram's enormous audience and actual blockchain usage remains the key question. The infrastructure and distribution are there.. What is missing is turning that distribution into sustained economic demand for GRAM
So no matter how many times they rebrand the token, refresh exchange chart data or try to give the asset a new narrative, the strategy has to change. Gram should be much bigger than what the market currently expects from it, because Telegram has already built the distribution machine that most crypto projects spend years trying to create
The next step is not another rebrand. It is converting Telegram's users into real, recurring on-chain activity and making GRAM indispensable to that economy. They already did the hard part. Now they need to actually capitalize on it
September Could Be a Make or Break Month for Crypto September is shaping up to be one of those months where the market has no shortage of catalysts. Crypto is heading into a dense calendar of macro events, regulatory decisions, network upgrades, major tech earnings, and central bank meetings
That combination could create some serious volatility, because traders will be forced to price in several competing narratives at the same time. The big question is whether September brings another leg higher for risk assets or becomes the month where the market finally reprices
💵 Liquidity Is Still the Main Game
The first major checkpoint comes with the U.S. jobs report on September 4, followed by CPI on September 11 and the FOMC rate decision on September 16. For crypto, these three events matter more than almost anything else on the calendar because they directly influence expectations for rates and liquidity. A softer labor market and cooling inflation could reinforce the bullish case for risk assets, while hotter than expected data could push yields higher and put pressure on Bitcoin, Ethereum, and high beta altcoins. The Treasury's plan to double the scale of government bond buybacks starting September 9 also adds another liquidity variable that traders will be watching closely
🏦 Then Comes the BOJ Risk
The Bank of Japan is another major wildcard. The September 18 rate decision could become especially important if markets start pricing in a higher probability of further policy tightening. Any meaningful shift in Japanese rates can affect global carry trades and liquidity conditions, which means the impact does not stay inside Japan.
For crypto and equities, the risk is simple, if global liquidity tightens while U.S. data is also running hot, traders could start reducing exposure to the most speculative parts of the market
🪙 Crypto Has Its Own Catalyst Stack
Crypto is not just waiting for macro this month. Solana's Transaction V1 upgrade, Mina's Mesa upgrade, MultiversX's Supernova activation, VET's Interstellar upgrade, Arc's mainnet launch, and several governance and buyback events create a separate stream of potential volatility. At the same time, exchange delistings involving assets such as ICX, SCRT, STORJ, BONK, JASMY, IOTX and others could create short term liquidity shocks in individual tokens. This is exactly the kind of environment where capital can rotate aggressively between narratives rather than simply moving with the broader market
🤖 Tech Could Keep Risk Appetite Alive
The equity side is equally important. Broadcom and other major technology names remain a key read on AI spending, while Nvidia's G20 appearance, Apple's product events, Tesla's Cybercab developments, and the upcoming Mac lineup could keep the AI, semiconductor, and automation themes in focus. If investors continue rewarding AI and growth, crypto could benefit from the same riskon appetite.. But if tech starts rolling over, crypto will have a much harder time ignoring that signal, especially after a strong run
⚠️ September Has Very Little Room for Complacency
Later in the month, the U.S China summit, Robinhood's summit, OpenAI DevDay, Korea Blockchain Week, and Ethereum-related ETF developments could create new narratives and trading opportunities. That means September is unlikely to be a straight line market. There are simply too many events capable of changing positioning. The bullish setup remains intact as long as liquidity expectations improve and macro data stays supportive, but traders should expect violent rotations and sharp pullbacks along the way
September is not a month to blindly chase green candles.. It is a month to watch liquidity, rates, inflation, and positioning. If NFP and CPI cooperate, the Fed remains supportive, and BOJ tightening does not trigger a broader liquidity shock, crypto could have the perfect environment for another expansion phase..
But if macro data comes in hot and central banks turn more restrictive, September could quickly become a month of repricing instead. In other words, the catalysts are stacked
Now the market has to decide which narrative wins..but no matter what
IM ALL IN Understanding Types of Currency Pairs in Forex TradingIn forex trading, currencies are always traded in pairs. Understanding how these pairs are categorized is essential for every trader, as each group comes with different levels of liquidity, volatility, and trading conditions. Generally, forex currency pairs are divided into three main categories: Major Pairs, Minor or Cross Pairs, and Exotic Pairs.
1. Major Currency Pairs
Major currency pairs represent the most heavily traded currencies in the global market. The defining characteristic of a major pair is that it always includes the US Dollar (USD) on one side of the trade, paired against another major global economy's currency.
EUR/USD GBP/USD
USD/JPY USD/CAD
AUD/USD NZD/USD
Because these economies are highly active and stable, major pairs offer the highest liquidity, lowest spreads, and most predictable price movements. This makes them ideal for both beginners and experienced traders.
2. Minor Currency Pairs (Cross Pairs)
Minor pairs, often referred to as cross currency pairs or simply crosses, consist of major global currencies traded against each other without including the US Dollar.
EUR/GBP GBP/JPY
EUR/JPY AUD/CHF
CHF/JPY NZD/JPY
GBP/CAD EUR/AUD
Even though the US Dollar is absent, these pairs still involve strong economies, providing decent liquidity and tight spreads, though volatility can sometimes be higher compared to major pairs.
3. Exotic Currency Pairs
Exotic pairs consist of one major currency combined with a currency from a developing or emerging market economy.
USD/TRY USD/ZAR
EUR/TRY USD/MXN
Exotic pairs typically feature lower liquidity, wider spreads, and significantly higher volatility, making them more suitable for advanced traders with specific risk management strategies.
Which Pairs Should You Trade?
For beginners and retail traders, focusing on Major pairs and select Minor pairs is usually recommended due to higher market depth, smooth price action, and cost-effective trading spreads.
What are your favorite currency pairs to trade? Share your thoughts and strategy in the comments below!
Education 
RKLB train is ready to departNASA awarded Blue Origin a firm-fixed-price contract worth up to $700 million on September 1, 2026, to design, build, launch, and operate the Mars Telecommunications Network (MTN) orbiter, beating out competing bidder Rocket Lab (RKLB). The news was most likely known ahead of time and triggered consistent selling at around $80 down to $60.
Now, at the bottom of the short term downtrend, we see new announcements.
- Berenberg initiated coverage on the U.S. and European space sector, assigning a Buy rating to Rocket Lab (RKLB).
- ARK Invest doubled down on two high-growth targets, purchasing $38.1 million in Block and $12.8 million in Rocket Lab USA while simultaneously reducing its stake in several major tech stocks.
- Rocket Lab reached a major milestone by successfully deploying its 94th Electron rocket, carrying a new Earth-observation satellite into orbit for Synspective.
RKLB is ready to move up very soon. The chart looks attractive in a number of ways:
- Confluence: Order block fill around low $60s and price nearing ascending trendline support
- Price is trading below volume POC around $80
- MFI is depressed into oversold territory
- RSI is curling up to go higher
- ASTS and RKLB seem to trade as a pair and they share a similar chart structure. The fact that ASTS popped today is another reason to turn bullish here.
I suspect the price is going to zigzag possibly forming an ABC pattern starting from tomorrow until earnings in an ascending triangle. Since the last ER dumped despite positive results, I imagine the next ER has a higher chance of making a 10-25% move. Perhaps, we'll see $100 then.  Long
Long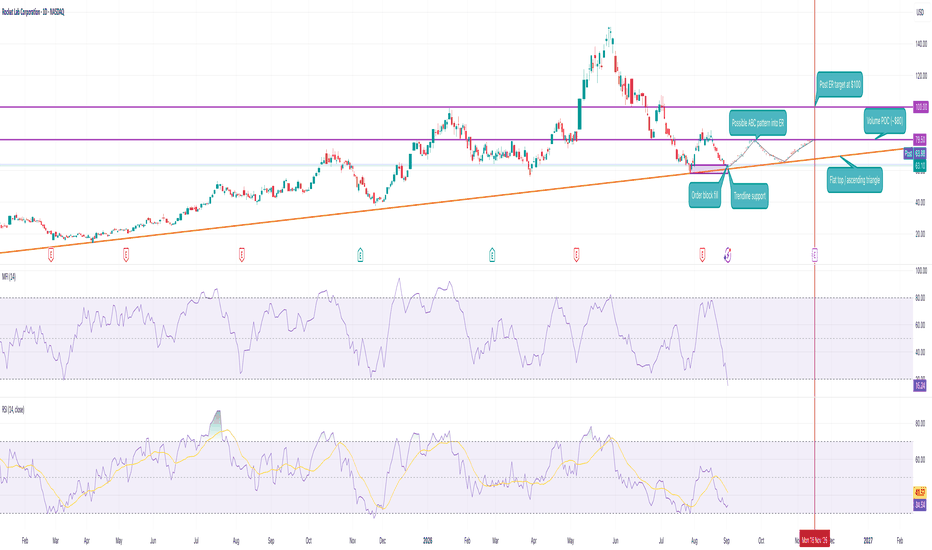
Daily Analysis and Reaction Locations [2026-09-01]Since the market finished its pullback last Friday, I'm looking for a continuation of lower prices this week. The calendar isn't showing much, except the NFP numbers coming Friday.
Looking at the charts, the sub-structure low is confirmed, and its demand zone got consumed in the previous session — which weakens the sub low, supporting the continuation-lower case. That previous session also created a small location based on the demand zone consumption, which is interesting for a potential scalp trade if price reaches it before the liquidation event. If the liquidation event gets reached first instead, that long scalp location is only used for targets, not as an entry.
The main trade direction for this week so far: short around the liquidation level, which aligns with a potential reaction zone — that reaction zone also aligns with a high volume node in the volume profile, and that volume profile is anchored to the pullback high, so it's monitoring the continuation lower specifically.
As long as the sub-structure high is holding, my primary bias is downward, toward the swing pullback target.
Grab the chart or zoom out on the preview to see all zones.
Trade Idea 1 — Short, liquidation level.
Needs directional confirmation first — the only safe risk reference on first touch would be the sub-structure high, and that's too far for me, so the confirmation itself provides the risk reference instead. Targets: the target location and the sub-structure low.
Trade Idea 2 — Short, supply zone.
Risk reference is the sub-structure high, main target the sub-structure low. I have a preferred entry inside the supply zone, but I'll take a 1-contract early entry on first touch and build the position up from there as price moves into the zone.
Shared for educational and analytical purposes only — not financial advice or a trade recommendation. Entries, stops, and targets are shown for study, not signals to copy. UBER: Elliott Wave Rebound Loading toward $100+ Uber Technologies ( NYSE:UBER ) is showing a textbook technical bottoming pattern while building a multi-year fundamental moat.
Following the massive $14.8B acquisition of Delivery Hero, institutional accumulation remains heavily stacked. The current technical setup on the 4H frame points toward a major Wave (5) expansion taking price well back above $100.00.
Technical Snapshot: Elliott Wave Structure
Wave (1) & (2) Completion: Price successfully carved out a local swing low near $68–$70, completing Wave (2) consolidation and signaling a clear shift in local market structure.
Wave (3) Impulsion: Currently initiating the primary motive wave. A push through the $80.00 resistance band validates the structural acceleration into Wave (3).
Wave (5) Macro Target: The completed 5-wave Elliott sequence projects a macro target reaching $100.00+, filling key overhead liquidity levels.
Fundamental Catalysts & News Flow
The $14.8B Delivery Hero Acquisition: Uber signed a definitive $14.8 billion agreement to acquire Delivery Hero, expanding its mobility and delivery platform across 99 countries. This creates a global network with over $236B in combined pro-forma gross merchandise value, drastically accelerating market share across Europe, Asia, and Latin America.
Heavy Institutional Backing: Institutional ownership sits at over 80%, with top long-term asset managers (BlackRock, Vanguard, PIF) continuously accumulating shares. Institutional flows remain net positive as wall street prices in the margin expansion from global delivery consolidation.
Free Cash Flow & Scale: Beyond rideshare, Uber’s delivery segment continues to show compounding profitability, positioning the company to benefit from long-term subscription growth via Uber One.
Key Technical Levels to Watch
Immediate Resistance: $80.00 (Breakout confirmation for Wave 3 continuation).
Key Support Zone: $70.00 – $72.00 (Wave 2 invalidation shelf).
Macro Target: $100.00+ (Wave 5 structural projection).
Bottom Line
Between the scale unlock from Delivery Hero, massive institutional support, and a clean Elliott Wave structure, the risk/reward ratio favors the bulls. Watch for volume expansion on a break above $80.00 to confirm the move toward $100+.
What’s your take on NYSE:UBER at these levels—are you riding Wave 3 up to triple digits? Let’s hear your thoughts below!
Disclaimer: This post is for informational and educational purposes only to highlight market metrics, technical patterns, and news events. It does not constitute financial advice or a recommendation to buy or sell any security  Long
Long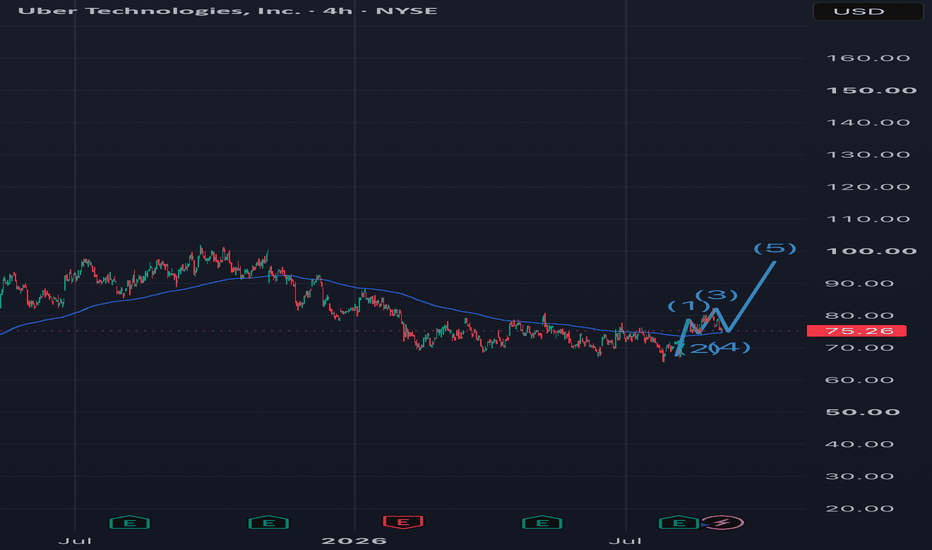
XRP Just Hit a Make-or-Break Level at $1.34Hi guys, so I spent way too long on the XRP chart today. Moving lines around, throwing RSI and MACD on top, checking SMAs, and yeah, most of that ended up not mattering. For me the whole thing comes down to one number: $1.40. XRP spiked to $1.69-$1.70 last week, got sold off hard, and now it's just sitting there around $1.36-$1.38 like it's thinking about its next move.
Underneath that, though, $1.34 on the 4H is the one I'm actually watching. Supertrend flipped support there; it's the 50% retrace of the whole August move, and there's a nasty liquidation cluster sitting right on it too. Buyers already saved it once this week already. If it holds, we're fine. If it goes, honestly, there's nothing until $1.20, so I'm not trying to catch a falling knife here.
Here's my plan, nothing fancy: long $1.35-$1.37 if we retest, but I want RSI back in the mid-40s and MACD turning up first, not just buying because a candle went green. Stop $1.33, first target at $1.40, and stretch to $1.50. If $1.40-$1.50 rejects again like last time, whatever, I'll just flip and look at shorts instead.
Also worth knowing, spot XRP ETFs just had their best inflow week all year, and that CLARITY Act vote mid-September is a real wildcard either way. That's probably why dips keep getting bought.
Anyway, I'm just sitting here staring at $1.34. Is anyone already in, or are you waiting to see if $1.40 actually breaks first this time?
Disclaimer: Trading crypto involves substantial risk, and this is only my personal read of XRP's structure, not financial advice. I always define invalidation before entering, size positions carefully, and accept that price can do something different from my base case.
Short 
MRNA | Moderna’s $60B Valuation Makes No SenseModerna’s story is shifting from a COVID vaccine company toward a broader mRNA platform, and the biggest potential catalyst is its personalized cancer immunotherapy
The concept is built around identifying mutations unique to a patient’s tumor, creating a personalized neo antigen, and using mRNA to instruct the patient’s own cells to produce that target. The immune system can then recognize and attack cancer cells carrying that specific marker
🧬The Technology Is Powerful, But It Isn’t New
The market is treating Moderna’s cancer program as something almost entirely revolutionary, but that deserves some skepticism . Neo antigen immunotherapy has been studied for decades, with hundreds of trials exploring different cancer types, delivery methods, dosing strategies and combinations. Moderna’s potential advantage is its mRNA delivery system, which could make personalized treatments faster and more practical to manufacture
💰 The Real Opportunity Is Scale
This is where the Moderna bull case gets interesting. Personalized cancer treatment sounds enormously expensive, but the underlying process may ultimately be far cheaper than the headline prices suggest. DNA sequencing and much of the computational work are becoming inexpensive, while mRNA could allow the therapeutic component to be produced without manufacturing large quantities of the protein outside the body
If Moderna can turn that process into a repeatable, scalable platform, the addressable market could extend well beyond one cancer type
⚠️ But the Market May Be Pricing in Too Much Too Soon
Here is the problem for MRNA shareholders, a promising technology is not the same thing as a commercially dominant drug. Moderna still has to prove that its approach works consistently across cancers, demonstrate safety, optimize combinations and dosing, and ultimately establish that personalized manufacturing can work at scale
also if similar neo antigen treatments can eventually be produced outside Moderna’s ecosystem, the company may not have the monopoly investors currently imagine
The Moderna bull thesis isn't simply “cancer vaccine = stock goes higher.” The real thesis is that Moderna could transform its mRNA technology from a COVID era product into a broader therapeutic platform, with personalized oncology potentially becoming its most valuable application. But after the stock's dramatic repricing on positive cancer data, investors need to separate the scientific breakthrough from the economic moat
If Moderna can prove that personalized mRNA immunotherapy is safe, scalable and commercially defensible, the upside could be enormous. If competitors can reproduce the process cheaply, however, today's enthusiasm could prove far ahead of the actual economics.
 Long
Long
Comparative Analysis of US, China, and Iran GDP (1960–2026)1. The United States ($30.77 Trillion - Top Line)
The US exhibits the most stable and mature economic trajectory in the chart. From 1960 to 2026, the curve is remarkably smooth and consistent, representing a steady annual growth rate of roughly 2% to 3%. The only noticeable dips correspond to major global events: the 2008 Financial Crisis and the brief 2020 COVID-19 shock. However, the economy quickly recovered and continued its linear upward trend. This reflects a highly diversified, consumption-driven economy with enormous structural resilience, where growth is generated from within rather than relying on external shocks.
2. China ($19.5 Trillion - Middle Line)
China presents the most dramatic narrative, often referred to as the "Economic Miracle." In 1960, China's GDP was on par with (or even lower than) Iran's. However, starting in the early 1990s, the curve bends upward with a steep, unprecedented slope. This rapid acceleration represents China's massive industrialization, urbanization, and deep integration into global supply chains. Because the scale is logarithmic, the steep angle indicates that China's growth rate has been consistently and significantly higher than that of the US for decades. While its absolute GDP is still lower than America's, the slope suggests it is actively closing the gap, positioning itself as a global economic superpower.
3. Iran ($362.68 Billion - Bottom Line)
Iran's economic story is one of extreme volatility and sluggish long-term growth. In the 1960s and 1970s, Iran had a relatively healthy growth rate, matching or even exceeding the global average. However, starting with the 1978 Revolution and the subsequent Iran-Iraq war, the curve becomes highly jagged, marked by steep peaks and deep troughs. The peaks usually correspond to oil price booms, but these are consistently followed by sharp declines caused by economic sanctions, rampant inflation, political instability, and capital flight. As a result, Iran has been trapped in a "high-volatility, low-growth" cycle for decades, falling drastically behind China and widening its gap with the US.
Conclusion
This chart beautifully illustrates how structural stability and global market integration (China) can unlock explosive, exponential growth, while political volatility and economic isolation (Iran) prevent a nation from realizing its potential. Meanwhile, the US demonstrates that consistent governance, diversification, and innovation allow a massive, mature economy to maintain a steady upward trajectory without suffering from the extreme volatility seen in developing or sanctioned nations.