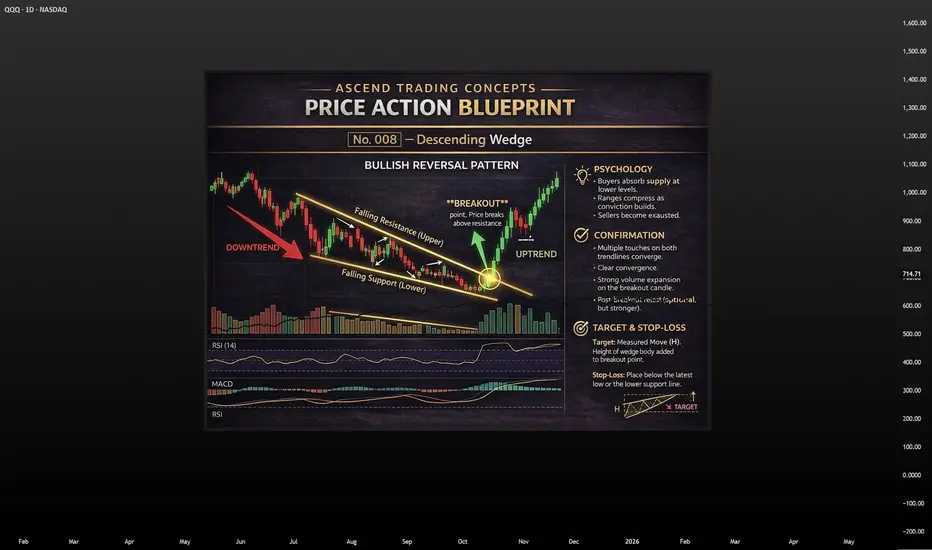
Price Action Education Series: Descending Wedge PatternA descending wedge is a bullish pattern that often forms while price is still drifting lower, which is why many traders misread it at first.
At a glance, the chart looks bearish. Price is falling, momentum looks weak, and the market seems heavy. But in a true descending wedge, both trendlines slope downward and converge, meaning the range is tightening as price falls.
That tightening matters.
👉 Sellers are still pushing price lower
👉 Each push lower is becoming less effective
👉 The downtrend is losing force
That is what gives the pattern its bullish potential.
🧠 What the Pattern Looks Like
A descending wedge is built from:
• a falling upper resistance line
• a falling lower support line
• repeated price swings inside a narrowing range
The two lines are not parallel. If they were, the pattern would look more like a channel. A wedge is different because the compression itself is part of the message.
Price is still moving lower, but the market is no longer expanding downward with the same strength. That often signals seller exhaustion.
🔍 The Psychology Behind It
This pattern reflects a battle between weakening sellers and increasingly patient buyers.
As the wedge forms:
• weak holders keep selling
• bears remain active
• buyers begin absorbing at lower prices
• volume often starts to dry up
Each decline creates fear. Each bounce creates hope. Over time, fewer sellers remain aggressive enough to keep driving the market lower with authority.
That is why the descending wedge can become a bullish reversal setup. The market is still moving lower, but the quality of the selling pressure is deteriorating.
✅ What Confirms the Pattern
The pattern is not confirmed just because you can draw the lines.
A strong descending wedge usually includes:
• multiple touches on both trendlines
• clear convergence of the lines
• reduced activity during formation
• a decisive break above the upper resistance line
• ideally, stronger participation on the breakout
That breakout is the real signal. Until resistance breaks, the wedge is only a possibility.
📈 What Happens After Breakout
The breakout does not always lead to an immediate straight-up move.
Sometimes price breaks out and runs. Other times it breaks out, pauses, or lightly pulls back before continuing higher. That does not automatically mean failure.
A modest pullback after breakout can simply be the market testing whether the breakout level will now hold as support. The real warning sign is when price falls back inside the wedge.
🎯 Targets and Stops
A common way to estimate an upside target is to measure the height of the wedge at its widest point and project that distance upward from the breakout area.
Stops should also make sense structurally, such as:
• below the most recent important low
• below the lower wedge boundary
• below the post-breakout swing low
The goal is to define risk logically if the breakout fails.
🚨 Common Mistakes
Traders often misuse this pattern by:
❌ assuming every falling pattern is bearish
❌ entering before breakout confirmation
❌ ignoring whether the lines truly converge
❌ panicking over a normal post-breakout pullback
❌ confusing a retracement with a failed breakout
🔑 Bottom Line
📍 A descending wedge is a bullish reversal pattern
📍 It shows a falling market with weakening selling pressure
📍 The real signal is the break above resistance
📍 Small pullbacks after breakout can be normal
📍 A move back into the wedge is the real warning sign
📈 The message is simple:
price may still be falling, but sellers are running out of power — and once resistance breaks, the reversal can begin.  Education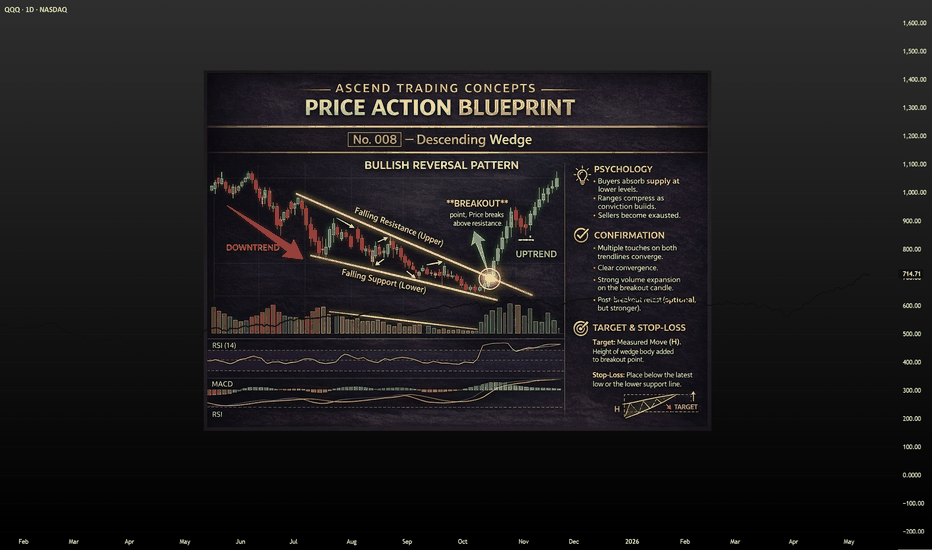
 Long
Long
Gold Roadmap (1H): Breakout Scenario in PlayToday, I want to share a long setup for Gold( OANDA:XAUUSD ) on the 1-hour timeframe—so stay with me!
Gold is currently moving near a resistance zone($4,991-$4,878).
From a classical technical perspective, it appears that gold has formed a descending broadening wedge pattern. If we break above the upper lines of this pattern, we can anticipate bullish momentum in the coming hours.
From an Elliott Wave perspective, it seems gold can continue its upward corrective wave, likely a ZigZag Correction(ABC/5-3-5).
I expect gold, after a small correction near Fibonacci levels and support zone($4,991-$4,878), to start rising toward at least $4,976. If we break the resistance zone($4,991-$4,878), we can set the next target around $5,081.
In case of heightened Middle East tensions, gold could experience a sudden bullish surge—so be prepared for that scenario as well!
What is your idea about Gold!? Up or Down at least for the short-term!?
First Target: $4,976
Second Target: $5,081
Stop Loss(SL): $4,591
Points may shift as the market evolves
💡 Please respect each other's opinions and express agreement or disagreement politely.
📌 Gold Analyze (XAUUSD), 1-hour time frame.
🛑 Always set a Stop Loss(SL) for every position you open.
✅ This is just my idea; I’d love to see your thoughts too!
🔥 If you find it helpful, please BOOST this post and share it with your friends.  Long
Long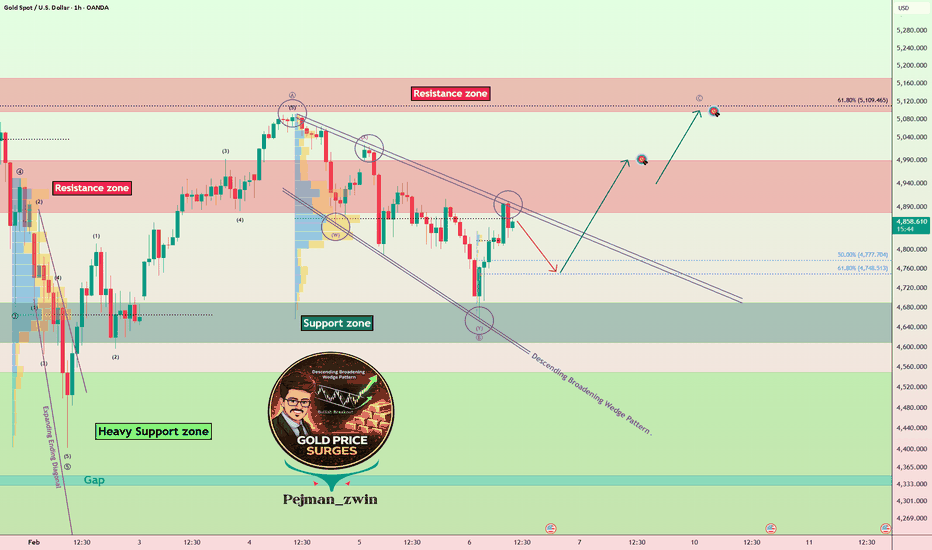
 Long
Long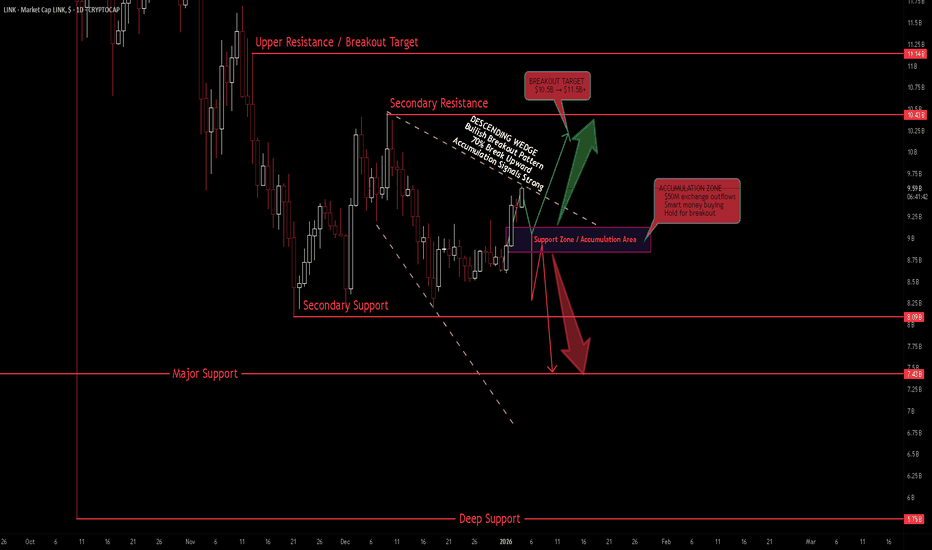
 Long
Long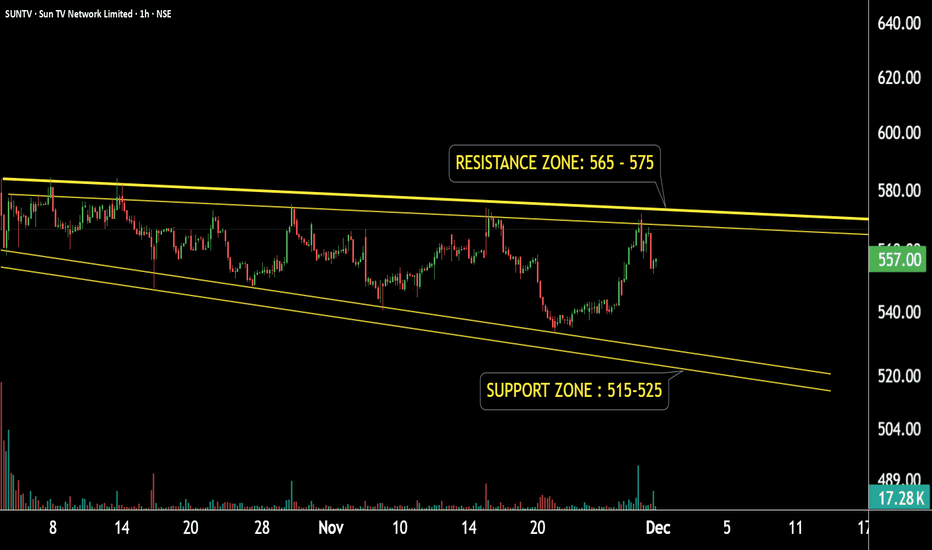
S&P 500 at Make-or-Break Level – Bulls’ Last Chance!As I expected in the previous idea , the S&P 500 index ( SP:SPX ) has reached its target.
Given that the S&P 500 index has a strong correlation with other financial markets, especially Bitcoin ( BINANCE:BTCUSDT )—sometimes even tracking them candle-by-candle—it's a good idea to pay extra attention to the S&P 500 index these days.
Currently, the S&P 500 index is moving in a Heavy Support zone($6,775_$6,689) , although it entered this zone with a lot of downside momentum.
From a classic technical analysis perspective, there's still a chance that the descending broadening wedge pattern will hold. As long as this pattern isn't invalidated, we can still hope for at least a short-term bullish move.
From an Elliott Wave perspective , it seems like the S&P 500 index is completing the microwave 4 of the microwave C of the main wave Y within the descending broadening wedge.
I expect that after the next small dip, the S&P 500 index will start rising again from near the lower boundary of the wedge, the 50_SMA(Daily) , and Support lines .
Note: If the S&P 500 index falls below about $6,650, we should expect further downside. So let's keep an eye on that level.
Please respect each other's ideas and express them politely if you agree or disagree.
S&P 500 Index Analyze (SPX500USD), 1-hour time frame.
Be sure to follow the updated ideas.
Do not forget to put a Stop loss for your positions (For every position you want to open).
Please follow your strategy and updates; this is just my Idea, and I will gladly see your ideas in this post.
Please do not forget the ✅' like '✅ button 🙏😊 & Share it with your friends; thanks, and Trade safe.  Long
Long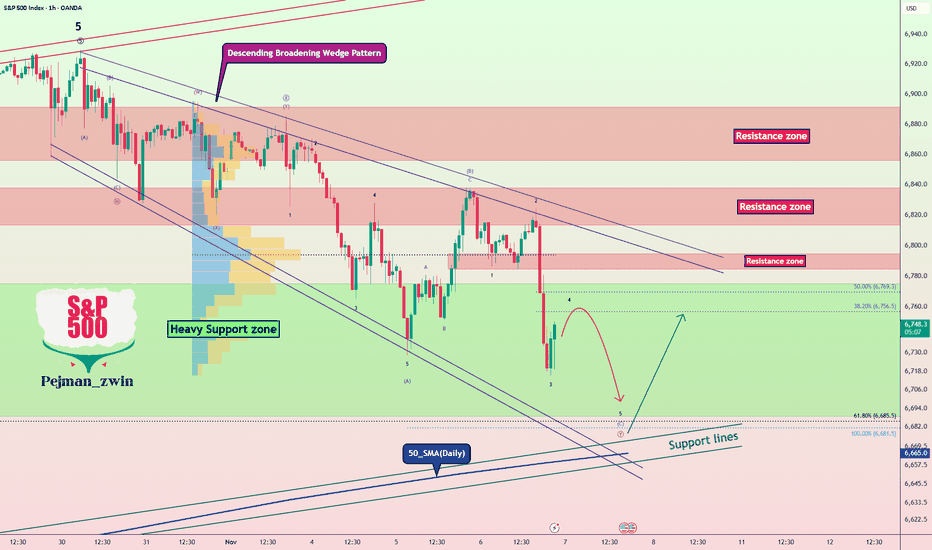
 Long
Long
 Long
Long
 Long
Long
Gold Roadmap=>Short termGold ( OANDA:XAUUSD ) currently appears to have broken through the Resistance zone($3,350-$3,325) .
The Resistance zone($3,350-$3,325) was broken with the help of the Descending Broadening Wedge Pattern , the upper line of this classic pattern having served as an important resistance line for us in previous ideas .
In terms of Elliott wave theory , Gold has completed the Double Three Correction(WXY) within the Descending Broadening Wedge Pattern . It is currently completing the next five impulse waves . Wave 5 of these waves could end in the Potential Reversal Zone(PRZ) .
I expect Gold to rise to the Potential Reversal Zone(PRZ) , and of course, given the momentum of gold approaching PRZ , we can also look for Short positions in PRZ .
Note: Stop Loss (SL) = $3,329
Gold Analyze (XAUUSD), 1-hour time frame.
Be sure to follow the updated ideas.
Do not forget to put a Stop loss for your positions (For every position you want to open).
Please follow your strategy; this is just my idea, and I will gladly see your ideas in this post.
Please do not forget the ✅ ' like ' ✅ button 🙏😊 & Share it with your friends; thanks, and Trade safe. Long 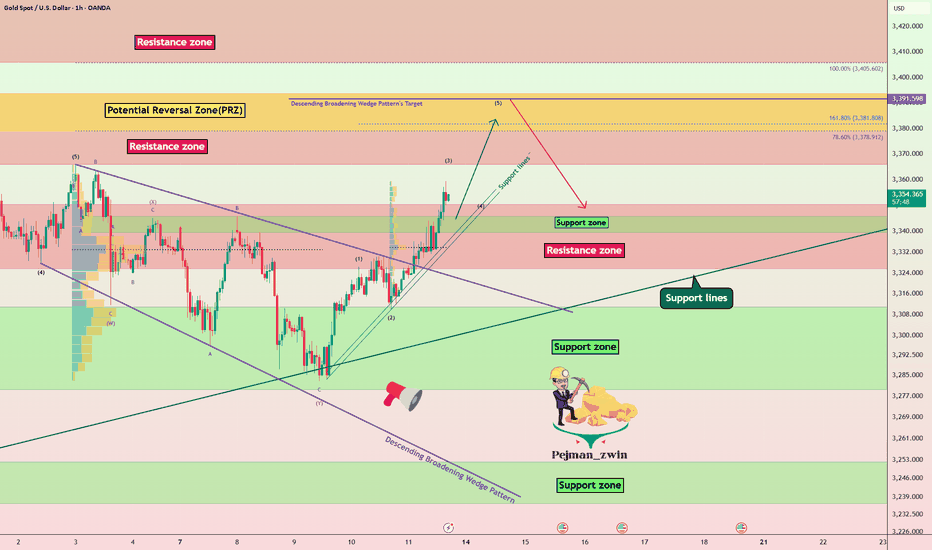
 Long
Long
 Long
Long
 Long
Long
Failed Wedge, New Setup. Is SUI About to Break Out?In my previous post about BYBIT:SUIUSDT , I mentioned a potential falling wedge pattern. However, the breakout above the 4.0040 resistance turned out to be a false breakout, and the price eventually dropped to the invalidation level at 3.5868. This made the setup invalid.
But despite the failed wedge breakout, BYBIT:SUIUSDT remains in a bullish trend overall. During the current consolidation, the price appears to be forming a new bullish pattern — a Descending Broadening Wedge (DBW).
This pattern typically starts with low volatility and gradually widens. Once price reaches its lower boundary, it often experiences a strong breakout to the upside.
Let’s break down the key price action in this DBW setup:
Price is moving within a Descending Broadening Wedge and is currently near the lower boundary of the pattern.
It’s also sitting around a key support level at 3.4833.
A rejection candle formed right at 3.4833, showing the market’s response to this support area.
A reversal confirmation would come if the price breaks above 3.6102.
A bullish divergence is also visible — price is forming lower lows, while the stochastic indicator is forming higher lows.
Based on these five price action signals, it seems that buyers are still in control, even though short-term volatility has created a series of lower lows.
That’s why I still believe BINANCE:SUIUSDT has more room to go up. What’s your take on this?  Long
Long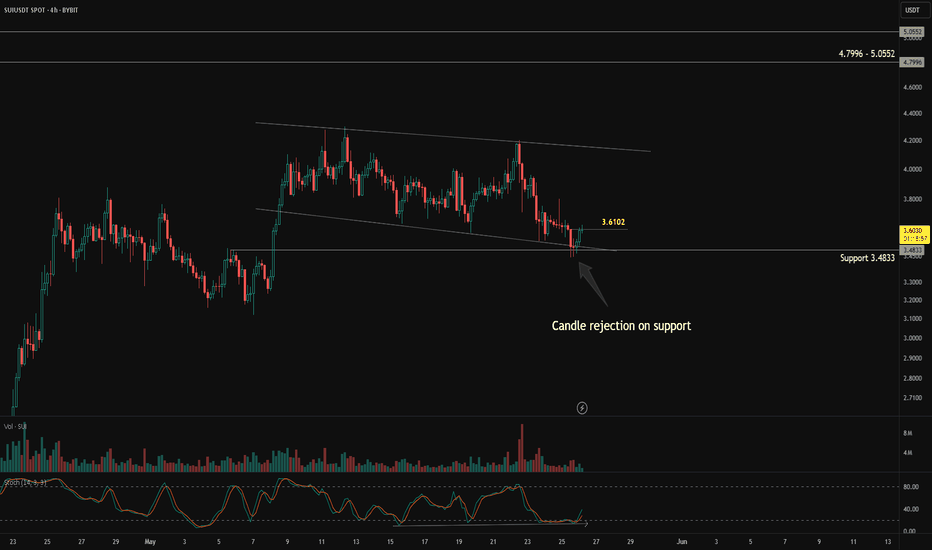
Crucial Level to Watch on BTC.DWe can see that CRYPTOCAP:BTC.D is still in a bullish trend and is currently testing a crucial level, which will determine whether it continues to make a higher high or starts weakening towards its previous low.
The influence of CRYPTOCAP:BTC.D on the crypto market is simple: if CRYPTOCAP:BTC.D moves higher, it means more money is flowing into Bitcoin. For example, if CRYPTOCAP:BTC.D is at 64%, it means 64% of the total crypto market capitalization is in Bitcoin, and the remaining 36% is spread across altcoins like CRYPTOCAP:ETH , CRYPTOCAP:SOL , CRYPTOCAP:DOGE , CRYPTOCAP:PEPE , etc.
Conversely, if CRYPTOCAP:BTC.D moves lower, it means more money is shifting into altcoins.
Strategy when CRYPTOCAP:BTC.D is rising:
You can allocate more into Bitcoin rather than altcoins. Alternatively, you can find altcoins that are outperforming Bitcoin.
How to find altcoins that outperform Bitcoin?
Look for altcoin/BTC pairs, for example: BINANCE:WIFBTC , BINANCE:NEARBTC , or $BINANCE:TAOBTC.
If the price of BINANCE:WIFBTC is going up, it means SEED_WANDERIN_JIMZIP900:WIF is gaining more value compared to $BTC. If it's going down, it means Bitcoin is performing better than $WIF.
Back to CRYPTOCAP:BTC.D :
Currently, CRYPTOCAP:BTC.D is testing the 64.19% – 64.10% zone.
This area will determine whether CRYPTOCAP:BTC.D continues upward or starts to weaken.
To get early confirmation, you can zoom into the 1-hour chart and look for signs of bullish divergence.
If bullish divergence appears on the 1-hour chart, it often leads to a bounce on the 4-hour chart and a potential continuation of the bullish trend, possibly breaking the previous high.
However, if there's no bullish divergence confirmation, or if there's a strong rejection at the support level, CRYPTOCAP:BTC.D is likely to weaken and move towards its previous low. Long 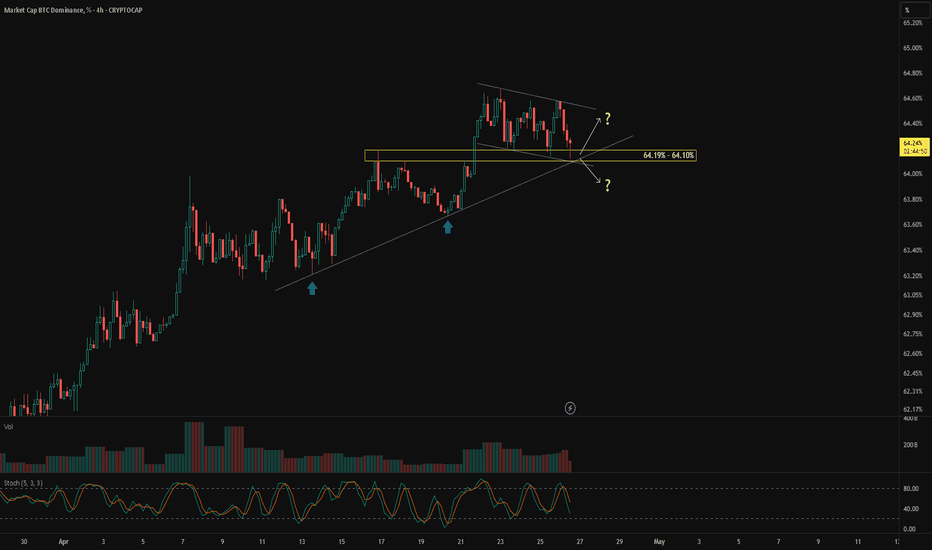
 Long
Long
Short 
Bitcoin Roadmap: Breaking the Broadening Wedge – A Buy Signal?After the tariffs that Donald Trump approved for the European Union and China , Bitcoin ( BINANCE:BTCUSDT ) received a shock with each approval. Otherwise, Bitcoin should have returned to the upward trend, at least in the short term.
Bitcoin seems to have failed to break 200_SMA(Daily) , and most of the time the invalid break is accompanied by the opposite movement of that break with high momentum. Also, Bitcoin seems to have broken the Resistance zone($83,530_$82,250) and is pulling back to this zone .
In terms of Classic Technical Analysis , it seems that Bitcoin has succeeded in completing the Descending Broadening Wedge Pattern .
According to the theory of Elliott waves , Bitcoin seems to have completed five downward waves and we should expect Bitcoin to rise .
Also, we can see the Regular Divergence(RD+) between Consecutive Valleys .
I expect Bitcoin to rise AFTER breaking the upper line of the Descending Broadening Wedge Pattern up to the targets I specified on the chart.
Do you think Bitcoin correction is over?
Note: If Bitcoin goes below the 200_SMA(Daily), expect more dumps.
Please respect each other's ideas and express them politely if you agree or disagree.
Bitcoin Analyze (BTCUSDT), 1-hour time frame.
Be sure to follow the updated ideas.
Do not forget to put a Stop loss for your positions (For every position you want to open).
Please follow your strategy and updates; this is just my Idea, and I will gladly see your ideas in this post.
Please do not forget the ✅' like '✅ button 🙏😊 & Share it with your friends; thanks, and Trade safe. Long 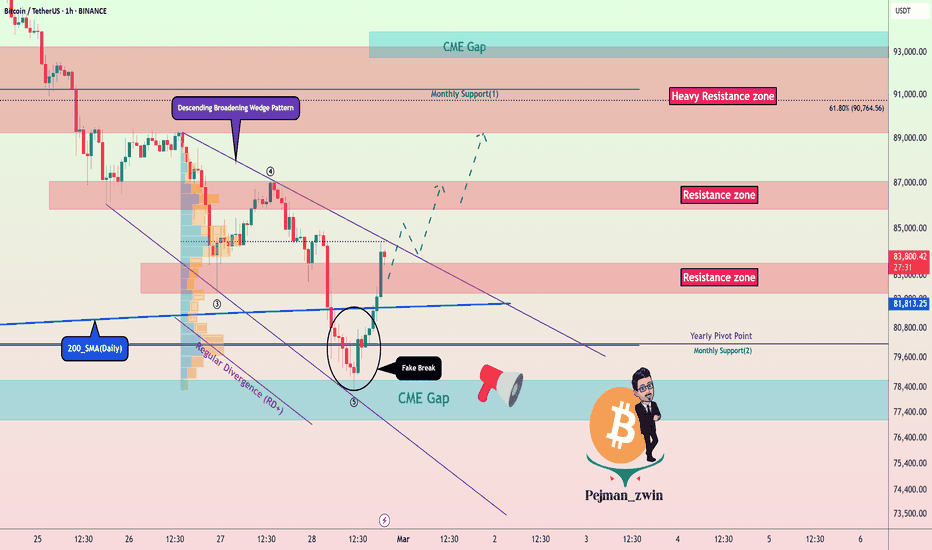
Long 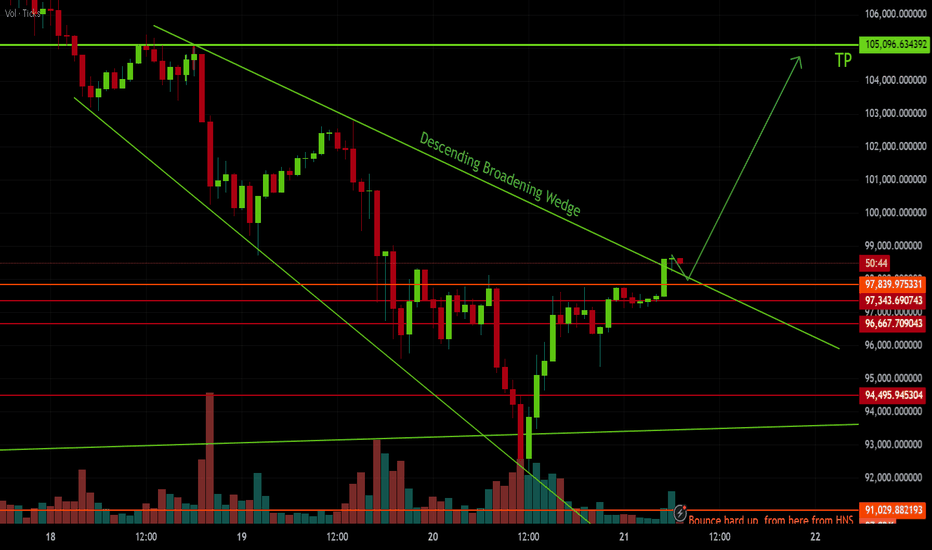
Long 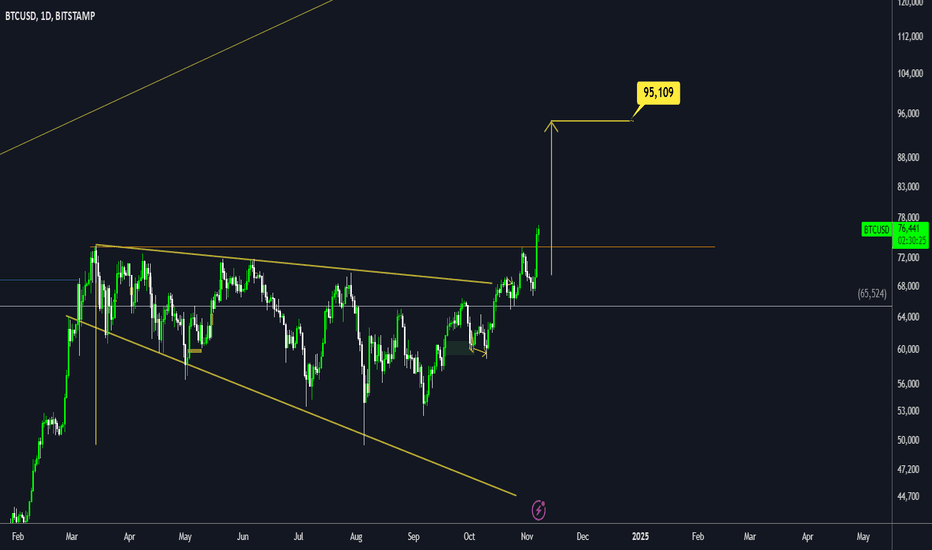
Bitcoin Roadmap!!!(New ATH)Bitcoin( BINANCE:BTCUSDT ) started pumping after it was almost certain that Donald Trump was the future president of the United States because Donald Trump announced his support for cryptocurrency during the last year .
In terms of Classic Technical Analysis , Bitcoin started pumping with the help of the Descending Broadening Wedge Pattern . ( Educational ).
Bitcoin has already managed to break the Heavy Resistance zone($73,900-$70,900) , but it has entered an important Potential Reversal Zone(PRZ) ; we have to see how long it can continue.
According to the Elliott wave theory , Bitcoin succeeded in completing the Double Three Correction(WXY) and is currently completing wave 4 .
I expect Bitcoin to start rising again from one of the Targets I have identified on the chart and at least rise to the upper line of the ascending channel . It probably needs Bitcoin correction to create another New All-Time High(ATH) .
⚠️If Bitcoin goes below the Heavy Resistance zone($73,900-$70,900), we should expect more dumps.⚠️
Bitcoin Analyze (BTCUSDT), 1-hour time frame⏰.
🔔Be sure to follow the updated ideas.🔔
Do not forget to put Stop loss for your positions (For every position you want to open).
Please follow your strategy and updates; this is just my Idea, and I will gladly see your ideas in this post.
Please do not forget the ✅' like '✅ button 🙏😊 & Share it with your friends; thanks, and Trade safe. Long 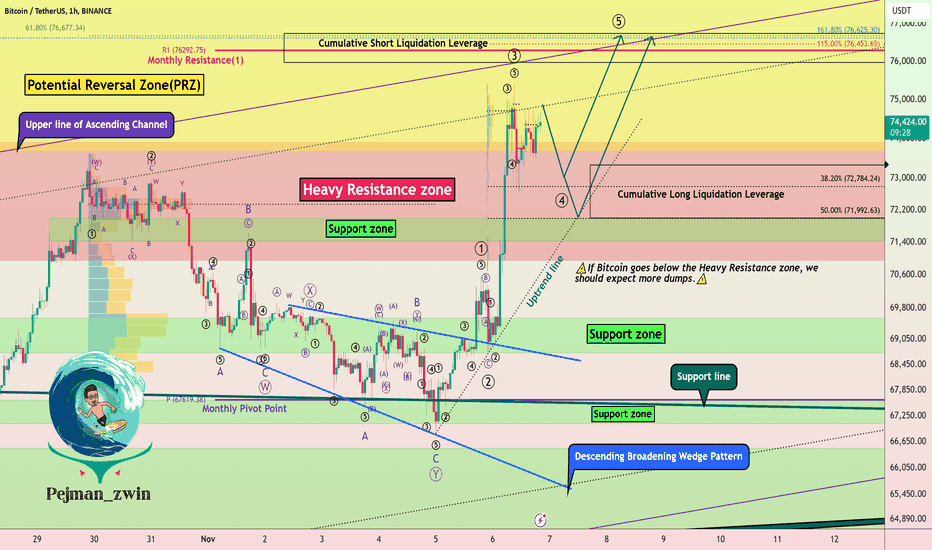

 Long
Long