GBPUSD: Mapping the Evolution of a Macro Structural Cycle🌐GBPUSD: The Macro Vector Matrix and the Spatial-Temporal Evolution of Vector Delta
━━━━━━━━━━━━━━━━━━━━━━━━━━━━━━━━━━
1. Structural Hypothesis
This study presents a comprehensive macro-structural framework for the GBPUSD currency pair, developed through a proprietary analytical model designed to decode market cycles via the convergence of price, time, geometric hierarchy, and multi-layered structural coordination.
The foundation of this framework originates from a multi-decade structural architecture.
As illustrated within the macro cycle, the first Primary Compression Phase unfolded over an exact 30-year period, extending from the historical peak at 2.6125 in June 1972 to Node 1 at 1.4089 in March 2002.
This phase was followed by a secondary structural consolidation lasting 13.5 years, ultimately terminating at the primary transition vector, Link 1, located at 1.5497 in November 2015.
From this pivotal structural intersection, the current long-term cycle of GBPUSD established its directional framework inside the governing macro channel designated as L: α-ω.
Following the complete execution of the structural pathway from Vector Alpha through the equilibrium reset at Vector Gamma during late 2022, the market formally initiated the present expansionary phase.
━━━━━━━━━━━━━━━━━━━━━━━━━━━━━━━━━━
2. The Geometric Evolution of Vector Delta
The current phase of the model is entirely focused on the evolution, progression, and eventual completion of Vector Delta .
This directional vector is advancing through a mathematically constrained trajectory toward the upper resistance boundary of the macro vector matrix.
Rather than developing through arbitrary price movement, the projected termination of Vector Delta is synchronized with predefined spatial-temporal execution windows.
Initial Time-Price Gate — June 21, 2027
Aligned with the 0.5 temporal coordinate, where price is projected to engage the first major structural resistance cluster between 1.4822 and 1.5583.
Intermediate Time-Price Gate — Late 2030
Corresponding to the subsequent 0.5 temporal extension, where the upper structural boundary continues guiding the expansion pathway.
Terminal Time-Price Gate — 2034
Representing the absolute 1.0 temporal maturity coordinate and the maximum theoretical boundary for the current Vector Delta expansion.
━━━━━━━━━━━━━━━━━━━━━━━━━━━━━━━━━━
3. Structural Transition Toward Vector Omega
Each execution node identified along the upper structural boundary represents a potential termination gateway for the current expansion phase.
Upon satisfying the structural, geometric, and velocity conditions required for the completion of Vector Delta within any of these predefined execution zones, the present directional phase will reach structural expiration.
Once this process is confirmed, the macro framework anticipates the initiation of the next primary cycle through a comprehensive structural reorganization and compression process governed by Vector Omega .
Until those predefined spatial-temporal coordinates are reached and structurally validated, the dominant directional bias remains focused on the completion of the current Vector Delta expansion.
✍🏻 Mohsen Nirumand Gold | One More Wave… or Has Wave B Already Begun?XAUUSD | 2H Elliott Wave Update
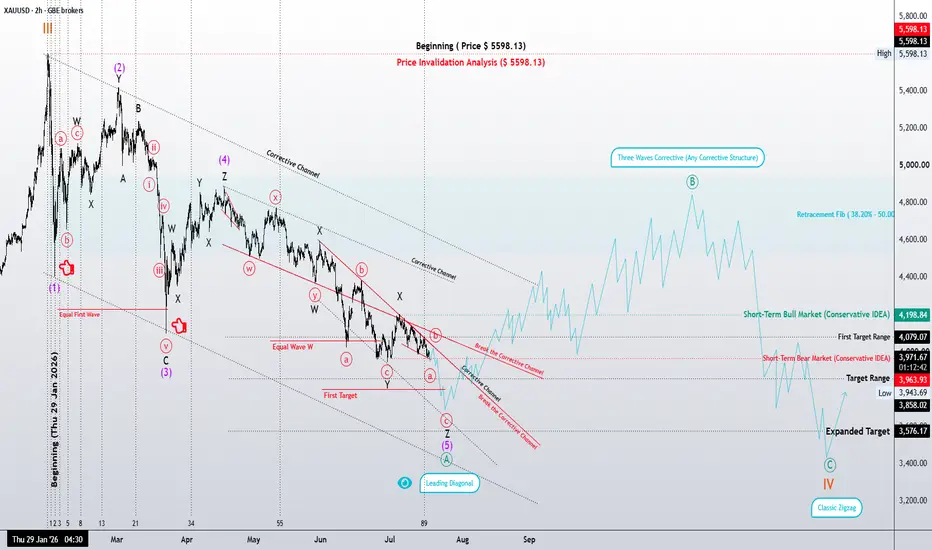
According to the higher-degree Weekly and Daily wave counts, Gold continues to develop Wave IV. This analysis is based on the Elliott Wave Principle, following both its core rules and structural guidelines while focusing on market structure rather than price prediction.
The primary focus of this update is a Leading Diagonal, currently identified as part of Wave A. Price has now reached a region where this structure may be complete. However, until the market provides structural confirmation, the Leading Diagonal cannot be considered finished with certainty.
According to the Elliott Wave Principle, Waves 2 and 4 within a Leading Diagonal must unfold as Zigzag corrections, whether single, double, or triple. Likewise, Waves 1, 3, and 5 may develop either as Impulses or as Zigzags, with those Zigzags also appearing in single or multiple forms.
At the current stage, Wave 5 of the Leading Diagonal is displaying signs of structural complexity. Therefore, two scenarios remain equally valid. The first suggests that the Leading Diagonal has already been completed and the market is ready to begin Wave B. The second assumes that one final minor decline—or a brief capitulation move—is still required before the diagonal can be considered complete.
From a structural perspective, a confirmed breakout above the descending corrective channel would provide the first meaningful evidence that Wave B has begun. Until then, additional downside movement within the current structure remains a valid possibility.
Once the Leading Diagonal is confirmed complete, the preferred scenario is for Wave B to unfold, followed by Wave C, ultimately completing Wave IV as a classic A–B–C Zigzag. Fibonacci retracement levels may help identify potential reversal zones, but in this analysis, market structure always takes precedence over price ratios.
Research Notes
One observation that has repeatedly caught my attention is the visual similarity between some Leading Diagonals and Triple Zigzags. In several markets, I have seen price confined within converging trendlines, initially appearing to be a textbook Leading Diagonal. However, as the structure matured, it became evident that the market was actually developing a Triple Zigzag.
This occurs because multiple Zigzags can sometimes produce a wedge-like appearance. For that reason, visual pattern recognition alone is never sufficient. The internal wave relationships and the structural rules of the Elliott Wave Principle remain the decisive factors.
Another key element is the relationship between Gold and the U.S. Dollar Index (DXY). Although these markets generally maintain an inverse correlation, historical observations suggest that this relationship is not always constant. There have been periods in which Gold continued building a bullish structure despite a rising Dollar Index. In such situations, one market appears to be correcting through time, while the other progresses toward a price objective.
For this reason, I place greater emphasis on wave structure and price behavior than on traditional intermarket correlations alone.
Unless the market proves otherwise, my preferred expectation remains unchanged: once the Leading Diagonal is complete, Wave B should develop first, followed by Wave C, ultimately completing Wave IV as a classic Zigzag correction.
Price is the outcome; Structure is the cause.
Patterns whisper. I listen.
— Mr.Nobody
Gold Spot / U.S. Dollar
7 days ago
Gold | One More Wave… or Has Wave B Already Begun?
Gold Spot / U.S. Dollar
May 17
Gold 4H: Leading Diagonal or Just the Beginning?
 Long
Long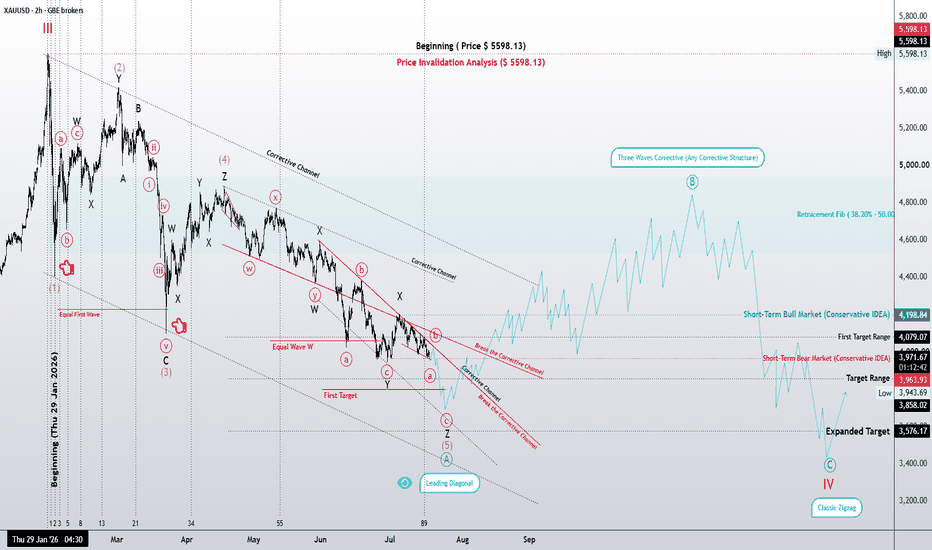
 Long
Long
 Long
Long
4H Roadmap: The Structure That Will Decide the Weekly Scenario# **DXY | 4H Roadmap: The Structure That Will Decide the Weekly Scenario 🌀**
Greetings, fellow wave practitioners.
In the previous weekly analysis, I presented two valid long-term scenarios for the U.S. Dollar Index (DXY): an **Aggressive Scenario** and a **Conservative Scenario**. The purpose of this 4-hour update is to determine which of those higher-degree paths the market is currently constructing.
From the most recent major high, the initial decline is unfolding as a **three-wave structure**. This is a crucial observation because those three waves form the foundation for interpreting the higher-degree count. The real question is not where price is going next—it is **what structure these three waves actually represent.**
At this stage, the current rally may simply be a corrective move. If this correction completes within the highlighted reaction zone, the preferred interpretation is that the market is developing **Wave (4) of a Leading Diagonal**. Under this scenario, one final decline would be expected to complete **Wave (5)** of the diagonal, thereby finishing the entire higher-degree **Wave (A)**.
However, markets rarely choose the simplest path. Should the current correction extend beyond the expected characteristics of a typical fourth wave, more complex corrective structures must also be considered. What appears today as a simple correction could evolve into a **Double Zigzag (W-X-Y)** or even a **Triple Zigzag (W-X-Y-X-Z)**, requiring additional time before the correction is fully completed.
For this reason, the focus should not be placed solely on price targets. The highlighted reaction zones, corrective channels, and—most importantly—price behavior around those areas will provide the strongest evidence for identifying the market's true structure. Until that structure becomes clear, every wave count that remains consistent with the rules and guidelines of the Elliott Wave Principle deserves consideration.
Ultimately, the interpretation of this 4-hour structure will determine which of the two weekly scenarios gains confirmation.
If the market completes the current correction and then produces one final decline to finish the Leading Diagonal, the **Aggressive Scenario** will gain significant credibility. In that case, the recent decline would represent only **Wave (A)** of a much larger corrective sequence, to be followed by a higher-degree **Wave (B)** and eventually **Wave (C)**.
On the other hand, if price decisively breaks above the key structural levels and no longer behaves consistently with the expected diagonal or corrective pattern, the **Aggressive Scenario** would gradually lose validity. That outcome would strengthen the **Conservative Scenario**, suggesting that the larger correction has already ended and that the U.S. Dollar Index may be entering a new long-term bullish phase.
At this point, the answer will not come from prediction—it will come from **price behavior**.
As Elliott Wave analysts, our objective is not to forecast the future with certainty. Our objective is to identify the structure the market is building in real time. Once that structure reveals itself, the higher-degree roadmap becomes considerably clearer.
**Patterns whisper. I listen.**
**— Mr. Nobody** 📊🌀
Dollar Index Future
2 days ago
DXY | Corrective Structure Under the Microscope
 Long
Long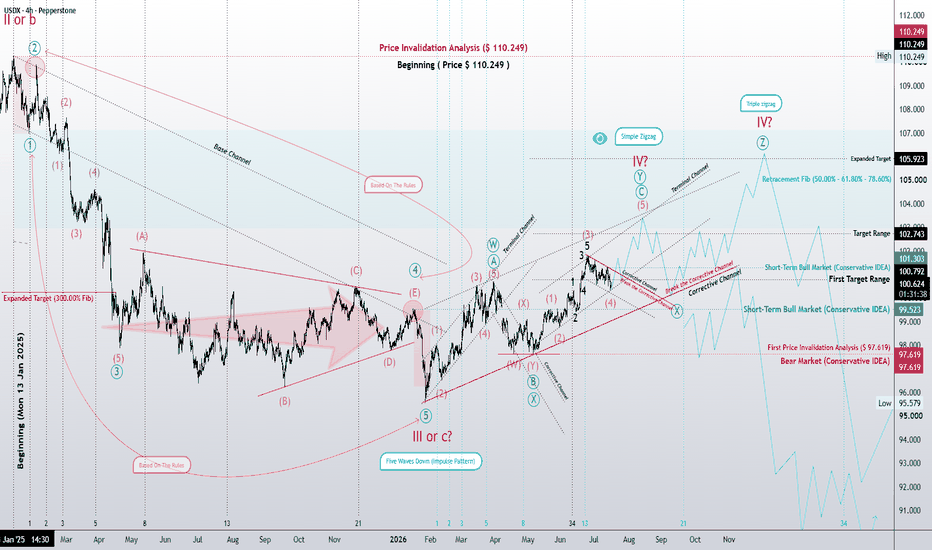
Long 
ETH update 16.07.26 - 24h Market Forecast (Wavelet Decomp.)Hi traders,
today's forecast has turned moderately bullish, with the model projecting a gain of approximately 20 units over the next 24 hours.
The signal is driven primarily by the underlying trend component (+31.4 units/day), which outweighs the two strongest bearish cycles—the 88.0-hour (−25.0 units/day) and 111.4-hour (−24.2 units/day) components. Additional support comes from several shorter- and medium-term cycles, including the 54.9-hour, 34.3-hour, 362.0-hour, 27.1-hour, and 286.0-hour components, all of which are contributing to the upside.
Although bearish cycles remain active, their influence is more than compensated for by the persistent positive trend and the broad participation of multiple bullish cycles. As a result, the aggregate forecast points to a steady upward move rather than a sideways consolidation.
It will be interesting to see whether the underlying trend continues to dominate or whether the longer-period bearish cycles regain influence during the next trading session.
Have a nice trading day! Two Valid Scenarios Remain | Elliott Wave AnalysisBitcoin (BTC/USD): Two Valid Scenarios Remain | Elliott Wave Analysis
In this analysis, both the conservative and aggressive scenarios remain valid. Until the market completes its structure, neither scenario has a decisive advantage over the other.
Under the conservative scenario, there is a possibility that the larger-degree Wave (IV) has already been completed, and the market is now developing Wave (1) of Wave (V). If this wave count is correct, the current correction may complete Wave (2) as a Double Zigzag, allowing the market to resume what could become the largest impulsive phase of Wave (V).
From this perspective, price action is the key factor. If the market begins to develop a strong Impulse or even a series of Nested 1-2, 1-2, 1-2 formations, it would significantly strengthen the probability that a new impulsive advance has already begun.
On the other hand, the aggressive scenario still suggests that the recent decline was only the first stage of a much larger corrective structure. In this case, the current rally may simply be another corrective phase, whether as a Simple Zigzag, Double Zigzag, Triple Zigzag, or any other valid corrective pattern. Once that structure is complete, another decline would be expected.
If this scenario unfolds, the larger corrective targets remain in the $30,000–$40,000 region. Furthermore, if the market is still developing the larger-degree Wave (IV), a deeper correction toward the Wave (4) of Wave (5) region, near $15,000, cannot be ruled out and remains a valid structural possibility.
At this stage, the most important question is not where price will ultimately trade, but whether the current advance marks the beginning of a new bullish trend or is simply a corrective rally before the next decline.
As with every Elliott Wave analysis, this is a structural interpretation of the market—not a price prediction. As long as the rules and guidelines of the Elliott Wave Principle continue to support these wave counts, both scenarios remain valid. Ultimately, the market itself will determine which structure unfolds.
We do not predict price—we follow the structure the market builds.
— Mr. Nobody
Independent Elliott Wave Principle Researcher
"Patterns whisper. I listen." 📊🎧
Bitcoin
Jun 2
BTCUSD 4H | The Geometry of Patience: Price, Time & the Triple Z
Bitcoin
May 22
BTCUSD — The Macro Structural Cycle (2026–2030)
Bitcoin Futures
6 days ago
Wave (IV) May Be Preparing the Next Bullish Cycle
Bitcoin
5 days ago
Bitcoin (BTC/USD): Simple Zigzag Remains the Preferred Structure
 Long
Long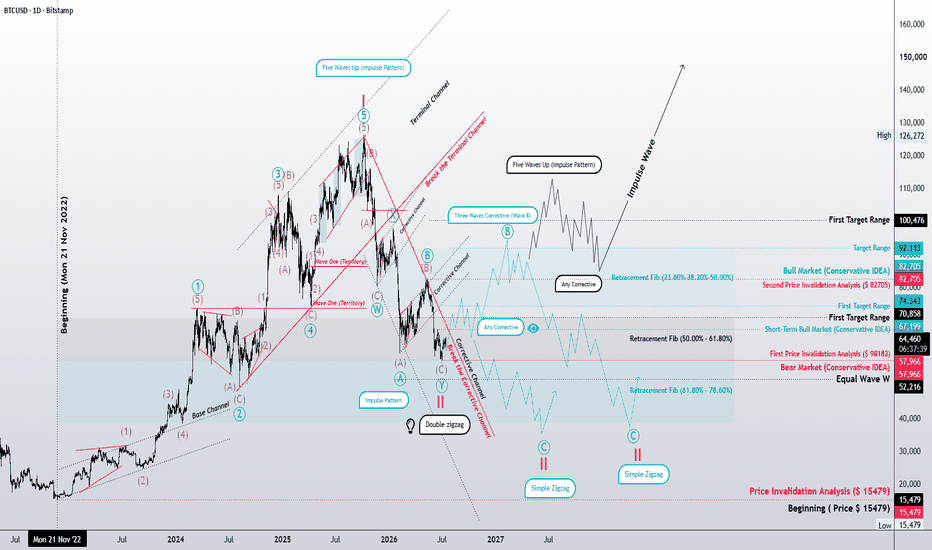
Impulse, Diagonal, or a Larger Correction?Crude Oil (USOIL)Crude Oil (USOIL) – 4H Elliott Wave Update
Impulse, Diagonal, or a Larger Correction?
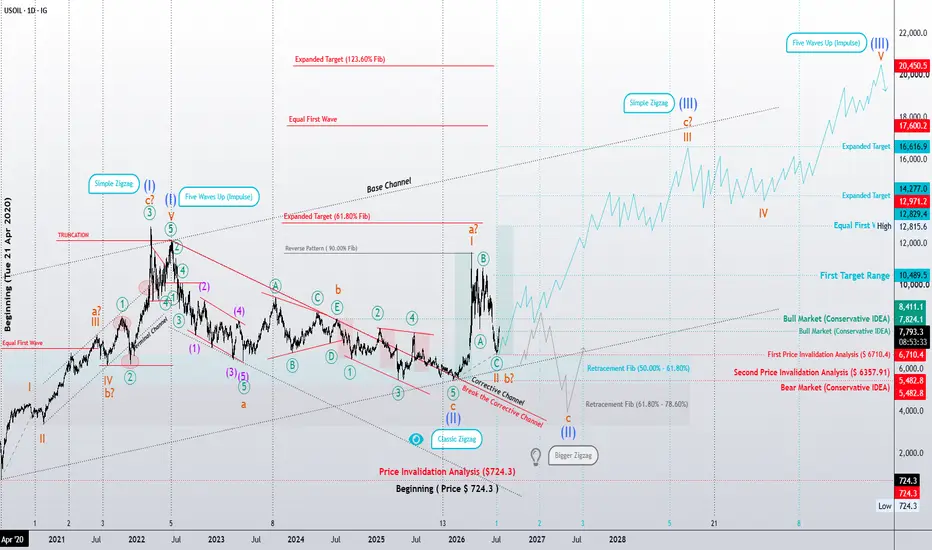
The recent decline may have completed either Wave II of a developing bullish cycle or Wave b within a larger corrective structure. At this stage, both interpretations remain valid, and the market has not yet provided enough structural evidence to confirm either scenario.
If the bullish count is correct, the next advance could unfold in more than one form.
The most straightforward scenario is a classic five-wave Impulse. However, Elliott Wave Principle also allows another possibility that deserves careful attention: Wave III itself may develop as a Diagonal.
Depending on how the structure evolves, this diagonal could appear as:
A Leading Diagonal, particularly if it marks the beginning of a larger fifth wave.
An Ending Diagonal if the market gradually loses momentum.
An Extended Ending Diagonal.
A Contracting Ending Diagonal, which currently appears to be the more probable diagonal variation.
In each of these diagonal structures, the internal subdivision would follow the familiar 3-3-3-3-3 sequence rather than the traditional impulsive subdivision.
On the other hand, if geopolitical conditions, supply disruptions, or market psychology suddenly intensify, the advance may instead develop into a powerful classic Impulse, producing a much stronger acceleration than a diagonal would normally suggest.
The projected path shown on this chart represents only a schematic illustration of a possible bullish sequence. It should not be interpreted as the exact path price must follow. As the structure develops, each wave may become more complex and subdivide into additional internal degrees.
For now, the primary objective is much simpler.
The market should first reach the initial target zone and successfully break above the previous Wave B, currently labeled as Wave III on this count. Only after that structural confirmation will higher Fibonacci objectives become increasingly reliable.
Alternative Corrective Interpretation
Another possibility is that the correction is not developing as a Zigzag at all.
Instead, it may be forming a Flat Correction—possibly even an Expanded Flat.
One reason this scenario deserves consideration is that Wave A retraced nearly 90%, behavior that remains consistent with several Flat variations. Although the structure currently appears somewhat irregular, Elliott Wave guidelines recognize that Flats can often develop with a relatively "messy" internal appearance.
If this interpretation proves correct, the equality relationships between corrective waves may become more reliable than extended Fibonacci projections during the early stages of the new advance. Until the market clearly reveals the character of the next motive structure, these proportional relationships deserve close attention.
The Conservative Scenario Remains on the Table
Despite the increasing probability of a bullish reversal, the conservative scenario shared in my previous long-term analysis remains completely valid.
Under that interpretation, the entire decline may still represent only Wave (II) of a larger degree, unfolding as a Classic Zigzag before the next long-term bullish cycle begins.
For those interested in the broader context, I encourage reviewing my previous long-term Crude Oil analysis, where this conservative roadmap is discussed in greater detail.
Final Thoughts
At this stage, the objective is not to predict the exact path of the market.
It is to recognize the structures that remain valid, identify the levels that confirm or invalidate each scenario, and allow price action to reveal the true character of the developing trend.
Sometimes the market advances through a clean Impulse.
Sometimes it progresses through a slow and overlapping Diagonal.
The difference is not only in price—it is in the character of the wave.
Patterns whisper. I listen.
— Mr. Nobody  Long
Long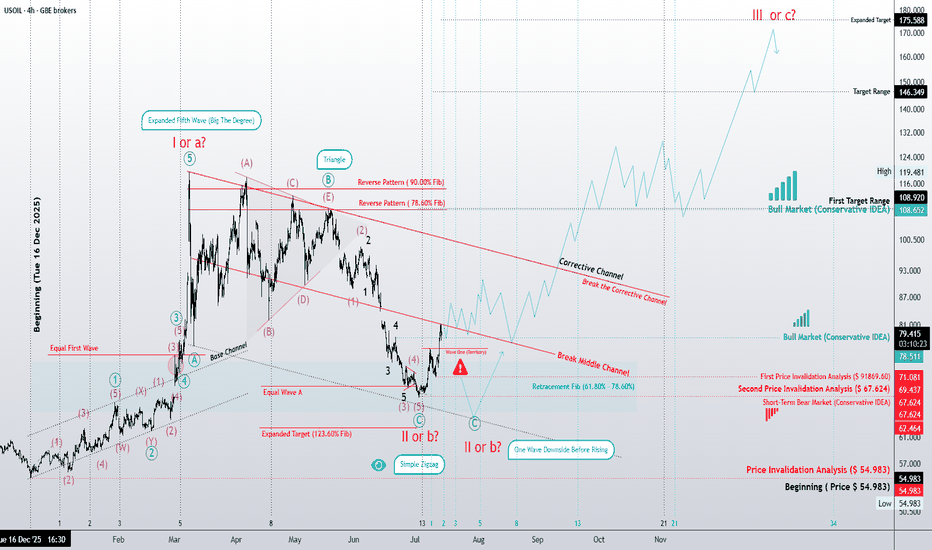
Reading the Character of the Next Market CycleCrude Oil: Impulse or Diagonal? Reading the Character of the Next Market Cycle
In my previous long-term analysis, the primary expectation was that crude oil was developing the final fifth wave of the largest degree as a classic Impulse. If that interpretation proves correct, the long-term bullish outlook remains valid and significantly higher price objectives could still become achievable over the coming years.
However, as the market structure continues to evolve, another equally valid Elliott Wave scenario deserves serious consideration.
Rather than unfolding as a traditional impulse, the final advance may develop as a Diagonal. At this stage, the structure could take the form of an Ending Diagonal, an Extended Diagonal, or—most likely—a Contracting Diagonal (wedge).
If this scenario unfolds, the long-term bullish outlook remains intact. The difference lies not in the direction of the trend, but in its character. Instead of a fast, decisive advance, price may continue to climb through an overlapping, grinding, and increasingly exhausting structure—behavior that is typical of terminal diagonals.
At the same time, the conservative scenario remains fully valid.
Under this interpretation, the decline from the previous major high represents only Wave A of a larger corrective structure. The following rally retraced more than 90% of that decline and reached approximately 11,555.4, a behavior that remains consistent with several corrective formations.
As a result, the current decline could be developing as an impulsive Wave C of a Classic Zigzag (A-B-C). Alternatively, it may become part of a larger Double Zigzag correction.
Another possibility that should not be overlooked is the development of a Flat correction—either a Regular Flat or an Expanded Flat. In such a case, Wave C could itself unfold as an Expanding Ending Diagonal. Although less common, this structure is fully consistent with Elliott Wave guidelines and is often characterized by increasing volatility, broadening price swings, and persistent overlap between waves.
At this stage, no single scenario has been confirmed. The evolution of price structure—and respect for key invalidation levels—will ultimately determine which path the market chooses.
Beyond Price: Studying the Character of Waves
Over the years, my research has gradually moved beyond simply counting waves or projecting price targets.
One question continues to capture my attention:
Can market structure reveal not only where price may go, but also the character of the environment in which future market cycles will unfold?
This is why I spend as much time studying the character of waves as I do their labels.
Many traders assume that every impulse must resemble the textbook ideal. My observations suggest otherwise. Every market has its own personality. Some trends unfold with exceptional strength and clarity, while others advance through prolonged overlap, hesitation, and exhaustion.
Perhaps these differences are not random.
Financial markets do not exist in isolation. They constantly interact with one another. Sometimes they move together through positive correlation. Sometimes they move in opposite directions. At other times, these relationships strengthen, weaken, or even reverse as global economic conditions evolve.
Understanding these relationships is far more complex than identifying a wave count, and I believe there is still much to discover.
In the case of crude oil, for example, a prolonged period of geopolitical tension, recurring disruptions to strategic energy routes, political conflicts, or a sustained war of attrition could create market conditions that are more consistent with the personality of an Ending Diagonal than with a clean, explosive impulse.
Conversely, an abrupt and severe supply shock could produce the kind of powerful momentum more commonly associated with a classic Impulse.
This is not an attempt to predict geopolitical events.
Rather, it is an attempt to understand whether market structure may reflect changes in collective psychology before those changes become fully visible through headlines and economic data.
This remains an ongoing personal research project rather than a definitive conclusion. My objective is not simply to forecast price, but to better understand the relationship between wave structure, crowd psychology, intermarket behavior, and the broader forces shaping future market cycles.
Perhaps markets do more than anticipate price.
Perhaps they also whisper something about the future itself.
Patterns whisper. I listen.
— Mr. Nobody
CFDs on Brent Crude Oil
Jun 6
Crude Oil: The Long-Term Elliott Wave Projection
CFDs on Crude Oil (WTI)
7 days ago
US Oil (WTI) – 4H Elliott Wave Update
Long 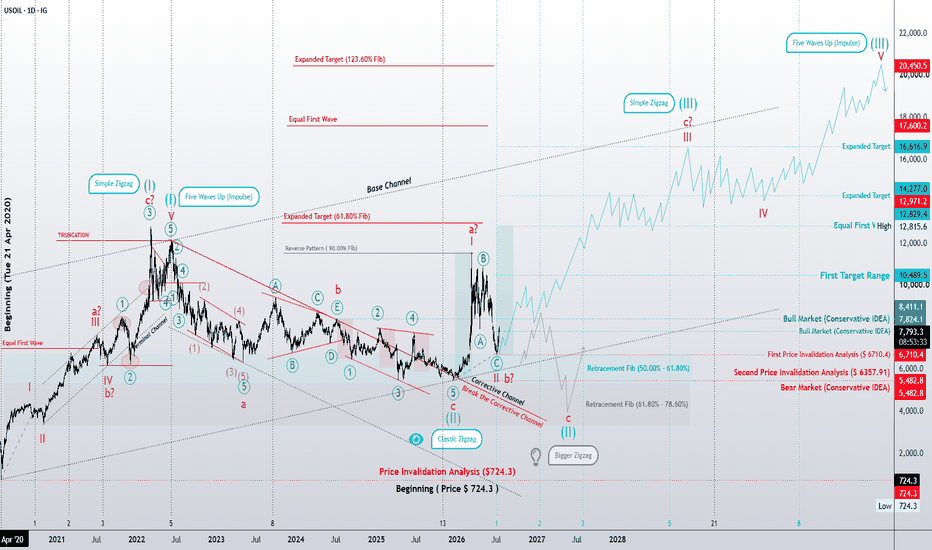
 Short
Short
Long 
DXY | Corrective Structure Under the MicroscopeDXY | Corrective Structure Under the Microscope: Leading Diagonal or Complex Zigzag? 🌀
Greetings, fellow wave practitioners.
The Aggressive Scenario assumes that the U.S. Dollar Index (DXY) has entered a higher-degree corrective phase from its major peak. According to the Elliott Wave Principle, Wave (A) may currently be developing through one of two valid structural paths.
The first possibility is a Leading Diagonal, a motive structure that fully satisfies Elliott Wave rules and guidelines while matching the current character of price action. If this interpretation is correct, the present recovery should eventually be followed by one more decline to complete Wave (a) and finalize the entire Leading Diagonal.
The second possibility is that Wave (A) is evolving as a Double Zigzag (W-X-Y) or even a Triple Zigzag (W-X-Y-X-Z). In this case, the market is still building a complex corrective structure that may require considerably more time than a simple Zigzag before reaching completion.
The common denominator between both counts is the expectation of a three-wave corrective structure on the higher degree. As long as the initial invalidation level remains intact, both scenarios continue to be technically valid.
From a structural perspective, the next decisive signal would be a break above Wave (B), followed by the development of another corrective pattern. Such behavior would provide the first meaningful confirmation that buyers are regaining control and would significantly strengthen the case for a long-term bullish phase in the U.S. Dollar Index.
At this stage, the objective is not to predict the future with certainty. The objective is to identify which Elliott Wave structure the market is constructing. Once that structure is confirmed, the long-term roadmap becomes substantially clearer.
Patterns whisper. I listen.
— Mr. Nobody 📊🌀
U.S. Dollar Currency Index
Jun 5
The DXY Time Paradox: Monday Engineering & Elliott Wave Dissecti
META's Explosion at Price-Time Gate: Legendary Surge or Trap? 🌐META: The Macro Vector Matrix and the Imminent High-Velocity Expansion Phase
━━━━━━━━━━━━━━━━━━━━━━━━━━━━━━━━━━
1. Structural Hypothesis
This study is not a conventional technical analysis, nor is it a collection of retail chart patterns or speculative price projections.
Instead, it is built upon a proprietary structural framework designed to decode market cycles through the convergence of price, time, geometric symmetry, and multi-layered structural compression across multiple macro timeframes.
Within this framework, the primary macro cycle of META has evolved through a sequence of highly coordinated structural vectors, each serving as a critical stage in the development of the broader market architecture.
The entire structural matrix originates from the historical Price-Time Box extending from the absolute low of 18.87 in November 2012 to the major cycle peak of 218.62 in July 2018. This foundational coordinate established the structural validation of Vector Alpha (v.α), which subsequently became the reference point governing every major macro development that followed.
From this origin, the market successfully completed its historical expansion phases before entering the deep equilibrium reset represented by Vector Gamma (v.γ). Rather than signaling structural failure, this phase fulfilled the necessary conditions for a new macro cycle by restoring long-term balance throughout the entire framework.
Following that reset, the market generated an upward directional correction toward Vector Delta (v.δ), completing the next major stage of the structural sequence. The inherent nature and behavioral dynamics of this Delta wave clearly demonstrate the immense potential and strength of the market's next directional move, which is anticipated to be highly sharp and accelerated.
Importantly, the peak established at Vector Delta did not initiate a classical markdown phase. Instead, it marked the beginning of a sophisticated structural reorganization process that initiated precisely on February 10, 2025, and concluded on June 29, 2026.
Throughout this period, price has continued to compress internally while maintaining the integrity of the broader macro structure. From the perspective of this model, the ongoing consolidation should not be interpreted as distribution or structural weakness. Rather, it represents a controlled phase of energy accumulation, during which both volatility and structural pressure are progressively compressed in preparation for the next macro expansion cycle.
Consequently, the current market environment is viewed not as the conclusion of the existing trend, but as the final stage of structural preparation preceding the next high-velocity phase transition.
━━━━━━━━━━━━━━━━━━━━━━━━━━━━━━━━━━
2. The Architecture of Terminal Compression
The corrective and sideways development observed since META's late-2025 peak is not a random consolidation or a market driven by uncertainty. Within this framework, it represents a structured sequence that has evolved according to the laws of the price-time vector system.
Throughout this period, the market has progressively constructed a flawless contracting compression matrix through the internal vector sequence of α➔β➔γ➔δ➔, culminating at Omega (ω) in July 2026. This entire consolidation cycle has successfully completed the higher-degree Vector Omega (v.ω) structure.
This terminal structure is not only geometrically complete but also perfectly synchronized with the Vector Beta temporal anchor. Such alignment confirms that both the spatial and temporal dimensions of the macro cycle have matured simultaneously.
The 540.40 level has consequently emerged as the definitive structural floor of the entire compression process. At this coordinate, structural compression, temporal maturity, and long-term geometric symmetry converge into a single decision zone, while continuing to respect the multi-year cycle originally established from the 2012 Price-Time Matrix.
Within this model, the significance of this region extends far beyond conventional support or resistance analysis. It represents the final stage of structural equilibrium, where price, time, and behavioral organization become fully synchronized before the market commits to its next directional expansion.
Historically, whenever price-time symmetry, structural compression, and geometric alignment reach this degree of coherence, the probability of a high-velocity structural phase transition increases dramatically.
From the perspective of this framework, the ongoing consolidation should therefore be interpreted as a process of structural preparation rather than structural deterioration. The market has gradually absorbed volatility, balanced internal pressure, and accumulated the energy required for the next macro expansion.
As a result, the current environment reflects a market that has reached structural maturity. Rather than remaining trapped in prolonged consolidation, the entire macro framework indicates that META is approaching the completion of its compression cycle and is becoming increasingly prepared for a decisive, high-momentum breakout into the next phase of its long-term structural evolution.
━━━━━━━━━━━━━━━━━━━━━━━━━━━━━━━━━━
3. Structural Decision Window & Multi-Decade Confluence
The macro and multi-year pathway ahead is strictly governed by two definitive structural boundaries:
• Confirmation Zone: The definitive horizontal and vertical trigger that activates the entire macro expansion process.
• 520.26 Level: The absolute structural invalidation boundary of the bullish framework. A high-volume breach below this level will signal that the complex reorganization process within Vector Omega (v.ω) at higher degrees is not yet concluded and requires further structural duration and corrective expansion.
However, because the spatial compression, temporal symmetry, and overall market behavior are currently organized at the highest level of coherence, the probability of this invalidation scenario under the price-time vector system is approaching zero.
━━━━━━━━━━━━━━━━━━━━━━━━━━━━━━━━━━
4. Primary Scenario: Generational Expansion & The 10-Year Structural Floor (High Probability)
Upon a clean and high-velocity breakout through the initial Confirmation Zone, the market will encounter two highly critical algorithmic validation targets (the two major execution coordinates marked on the chart):
1. First Strategic Confluence Node: 1083.18
2. Second Strategic Confluence Node: 1233.86
These two coordinates are not merely price targets; they function as absolute "Time-Price Gates." A decisive breakthrough above these two specific spheres within their designated time windows will provide the ultimate structural validation for a historic, multi-decade expansion. Once these gates are conquered, the price-time vector system guarantees that META will not revisit these current structural floors for more than a decade (10+ Years).
Following the successful unlock of these time gates, the macro trend will shift into a legendary, unhindered, and high-momentum expansion phase. Based on the hyper-extended matrix shown on the chart, the long-term targets are established at:
• Fibonacci Extension Coordinate of 127.20% to price: 12190.36
• Fibonacci Extension Coordinate of 138.20% to price: 15960.53
• Fibonacci Extension Coordinate of 161.80% (4187% on the chart) to price: 20455.21
This final level represents the absolute spatial boundary and expansion capacity of the current structural cycle under the strongest possible institutional capital flows and macro accumulation.
━━━━━━━━━━━━━━━━━━━━━━━━━━━━━━━━━━
Conclusion & Research Signature
This model defines the strict conditions under which actual market velocity can be evaluated against the predefined price-time vector system. The validity of this framework is measured not by random forecasting, but by the precise alignment of price and time. Ultimately, the market reveals its own path; however, the present structural setup indicates that META is on the verge of a massive, unavoidable phase transition that will completely redefine its valuation for the next decade.
━━━━━━━━━━━━━━━━━━━━━━━━━━━━━━━━━━
✍ Mohsen Nirumand  Long
Long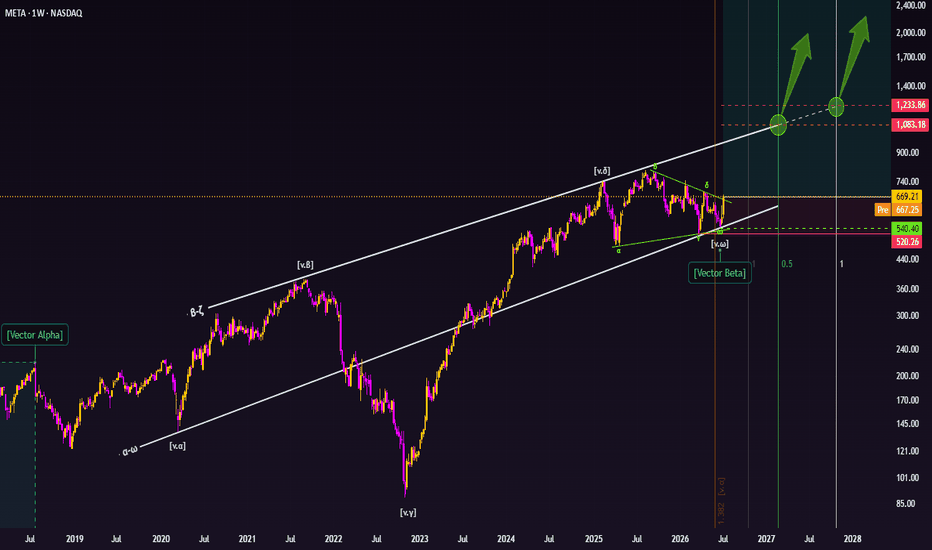
NQ Weekly Outlook: Mixed to Higher? | 13 to 17 July 2026The model read for the coming week contains three positive-bias days and two negative-bias days, suggesting a mixed structure with an overall tendency toward higher prices.
This outlook is based on the NQ Globex session, not only regular cash-session price action.
Monday, 13 July: Negative bias
Monday carries a negative bias, although positive momentum from the weekend may continue into the early part of the session and create choppy or conflicted price action.
NQ ended the previous week near an important resistance area. If Globex opens around the 30150 - 30200 region, the interaction with that resistance may become important in determining whether the negative bias develops cleanly or whether price remains supported.
The time-cycle structure also suggests that any early directional move may begin to weaken after approximately 9:00 AM ET, ahead of the regular cash-session open.
Tuesday, 14 July: Positive bias
Tuesday shifts to a positive bias, although another underlying model remains negative. This creates some disagreement within the broader model read, so the session may not produce a straightforward upward move even if the positive tendency ultimately aligns.
Wednesday, 15 July: Positive bias
Wednesday continues with a positive bias. However, the model indicates a greater possibility of volatility or changing behavior during the middle or later part of the session.
The broader direction may remain positive while the actual price path becomes less stable as the session progresses.
Thursday, 16 July: Negative bias
Thursday shifts back to a negative bias.
The model also suggests that the earlier portion of the session may behave differently from the later portion, making the timing and development of the move important when reviewing the outlook afterward.
Friday, 17 July: Positive bias
Friday returns to a positive bias, but the following Saturday shifts negative.
That transition may increase the possibility of weakening momentum, greater volatility, or a change in behavior later in Friday’s session rather than a clean continuation throughout the day.
Overall, the weekly expectation is mixed to higher, but not necessarily through a smooth or uninterrupted move.
These expectations come from a time-cycle driven, probabilistic market research framework. The purpose is to document possible directional tendencies and price-action behavior in advance, then compare them with actual NQ market behavior after the week unfolds.
Price action remains important. A directional bias should not be interpreted in isolation from support, resistance, momentum, and the market’s actual behavior during the session.
Disclaimer: This post is for educational, research, and review purposes only. It is not financial advice, investment advice, trading advice, a trade signal, or a recommendation to buy, sell, enter, exit, or hold any financial instrument. Futures trading involves substantial risk. Past performance does not guarantee future results.
#NQ #NasdaqFutures #WeeklyOutlook #TimeCycles #MarketCycles #PriceAction Copper Futures:The Structural Turning Point of a New Macro CycleHG1! | Macro Structural Convergence and Transition to a High-Velocity Expansion Phase
━━━━━━━━━━━━━━━━━━━━━━━━━━━━━━━━━━
1. Structural Hypothesis
This chart is not merely a technical analysis or a collection of price targets.
This study is based on a proprietary structural model developed to analyze the market through the convergence of price, time, structural behavior, structural compression, structural complexity, movement logic, and the framework of price-time coordination across all timeframes.
All scenarios, validations, and potential pathways presented in this report are directly derived from the interaction of these components and are built upon a coherent and measurable structure.
From the Macro Cycle Base at the price of 2.1420 in April 2020, the market initiated its first accelerated directional movement and completed the first expansion phase of the cycle by forming Pulse 1 at the 4.8095 level in April 2022.
From that point, the market did not enter a conventional correction; rather, it entered a multi-layered structural reorganization process; a process that, while preserving the integrity of the primary trend, has internally organized the required energy, time, and balance for the next stage of the cycle’s expansion.
━━━━━━━━━━━━━━━━━━━━━━━━━━━━━━━━━━
2. Dual Compression Architecture
The corrective behavior of the market throughout this cycle is not a random sequence.
This structure consists of two primary compression phases connected by an internal transition vector (Link 1), which together form the corrective architecture of the entire cycle.
Compression Phase 01 was completed over 687 days and ultimately concluded at Node 1 and the price level of 3.8370.
Following that, an intermediate expansion with an exact ratio of 2.06 developed, establishing the medium-term liquidity high around the 5.8460 region.
The market then entered Compression Phase 02; a structure that lasted exactly 345 days.
The precise 50% time ratio between the two compression phases represents one of the most important signals of temporal convergence within this model.
When symmetry between price, time, and structural behavior forms with such coherence, the market typically approaches the final zone of the reorganization process; a zone where the probability of a structural phase transition increases.
━━━━━━━━━━━━━━━━━━━━━━━━━━━━━━━━━━
3. Structural Decision Window
The market is now approaching one of the most important decision points of this cycle.
All upcoming pathways depend on price behavior relative to two key levels:
6.7160 → Trigger for the beginning of structural expansion
5.2460 → Structural invalidation boundary of the bullish structure
All scenarios within this study are defined based on how the market reacts to these two levels.
━━━━━━━━━━━━━━━━━━━━━━━━━━━━━━━━━━
4. Primary Scenario; Beginning of Macro Pulse 3 (High Probability)
If the market can break above the 6.7160 level with sufficient speed, strength, and momentum before August 5, 2026, alternative corrective structures, including triple correction scenarios, will lose their structural validity.
Under these conditions, the official beginning of Macro Pulse 3 from the current structural low will be confirmed.
The initial targets of this expansion are located within the 19.7 to 21.7 range.
If capital inflow continues, trend strength is maintained, and the structure continues its expansionary behavior, further extension toward the mathematical 261.80% coordinate at the price of 47.5 can also be evaluated within the framework of this model.
In the maximum scenario, if the market structure continues to demonstrate expansion capability, participation from major capital flows, and sustained momentum, the 361.80% level at the price of 104.1 will represent the final conceivable expansion zone for Macro Pulse 3.
This level is not a guaranteed target; rather, it represents the maximum structural expansion capacity of the model under the strongest possible conditions.
━━━━━━━━━━━━━━━━━━━━━━━━━━━━━━━━━━
5. Alternative Scenario; Extension of the Corrective Structure (Medium Probability)
If the breakout of the 6.7160 level does not occur within the initial time window and this breakout takes place near the beginning of September 2026 or later, the structure will enter the alternative pathway.
In this case, the upward movement will no longer be considered the direct beginning of Macro Pulse 3; instead, it will function as a secondary transition vector (Link 2).
This pathway may, through an extension of the corrective duration, guide the structure toward the formation of Compression Phase 03 and reaching the maximum temporal maturity boundary in April 2028.
After completion of this process, Node 3 is expected to act as the structural origin of Macro Pulse 3, with the next directional movement beginning from that region.
All possible pathways, decision branches, and validity conditions of this scenario are defined based on the temporal and price structure shown on the chart.
━━━━━━━━━━━━━━━━━━━━━━━━━━━━━━━━━━
Structural Invalidation Condition (Low-Probability Scenario)
The validity of this framework will remain intact as long as the market does not violate the defined structural requirements.
The structural invalidation scenario, although considered within the model and defined as a boundary condition, currently carries a very low probability of occurrence based on the present structural configuration.
Only if the market fails to reclaim the 6.7160 level with sufficient strength within the defined timeframe and subsequently loses the structural level of 5.2460 to the downside, will the bullish framework of this model enter a state of invalidation.
However, the convergence of spatial compression, temporal symmetry, geometric relationships, structural complexity, and the coherence of price behavior in the current state indicates that the market is positioned within a zone where the probability of completing the reorganization process and initiating a new expansion phase has increased
━━━━━━━━━━━━━━━━━━━━━━━━━━━━━━━━━━
Conclusion
This study presents a structural framework for examining major market cycles; a framework designed to identify the relationships between price, time, structural behavior, and movement logic.
The purpose of this model is not to provide a conventional market narrative or create certainty about the future; rather, it is to define conditions in which actual market behavior can be evaluated against predefined structural formations.
Each scenario presented in this report will only remain valid if the market fulfills the structural requirements associated with it.
The validity of this framework is not measured by absolute prediction, but by the degree of alignment between actual market behavior and the structural logic of the model.
Ultimately, it is the market that reveals its own path; however, whichever path is chosen, it must remain explainable and verifiable within the framework of the structural relationships defined by this model.
━━━━━━━━━━━━━━━━━━━━━━━━━━━━━━━━━━
Research Signature
“Each market cycle is formed across a set of structural degrees; degrees that interact with one another hierarchically, where the coordination between them, from the highest degree to the lowest degree, shapes the final structure of movement. Within this architecture, higher degrees determine the dominant structure, while lower degrees organize themselves within the same governing structure and logic. Every movement is the result of the convergence of price, time, structural complexity, structural behavior, and movement logic across all of these degrees. This framework is the result of studying and modeling these relationships; relationships that describe the path of the market rather than impose it upon the market.”
━━━━━━━━━━━━━━━━━━━━━━━━━━━━━━━━━━
✍🏻 Mohsen Nirumand  Long
Long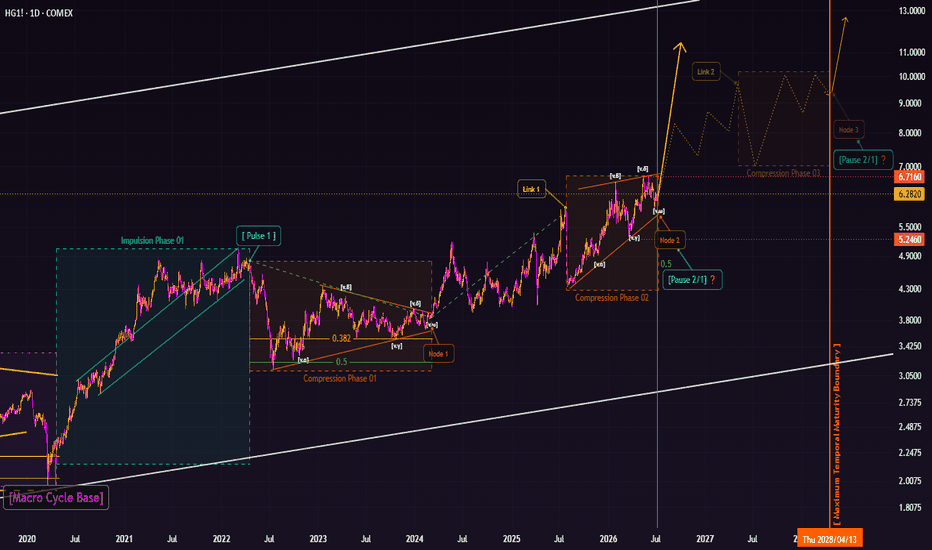
Is Wave C Complete, or Is the Correction Still Unfolding?Ethereum
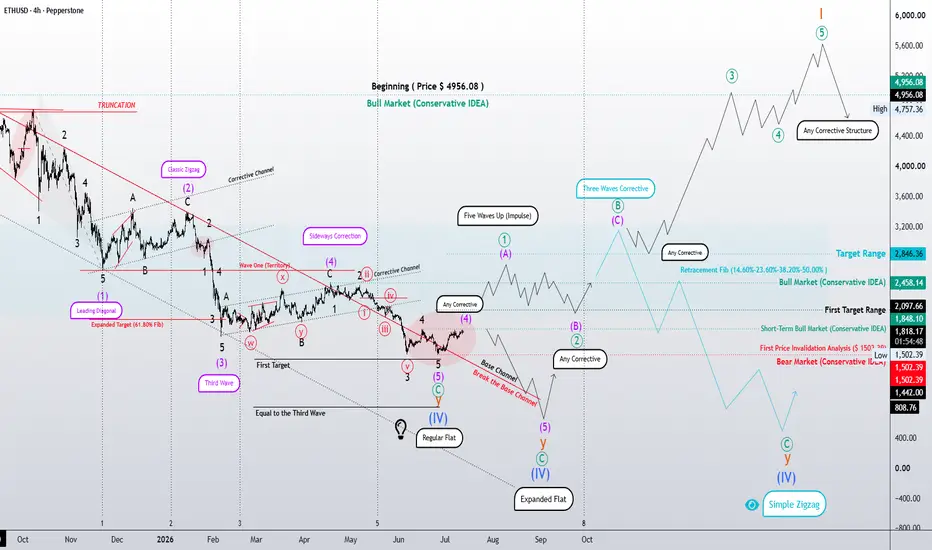
Following the broader structural outlook presented in the weekly analysis and the primary scenarios discussed in the daily chart, this 4-hour update focuses on the internal development of Wave C—the portion of the structure that may ultimately determine whether the higher-degree Wave (IV) correction is nearing completion.
Conservative Scenario
According to the rules and guidelines of the Elliott Wave Principle, Wave W appears to have completed as a Simple Zigzag, followed by Wave X as a Classic Zigzag. The market is currently developing Wave Y as a Flat Correction, with the structure so far remaining consistent with a Regular Flat.
However, until Wave C is fully completed, the possibility of the pattern extending into an Expanded Flat remains valid. For that reason, the primary focus is on the internal development of Wave C, where the completion of a five-wave impulsive sequence will help determine whether the correction ends as a Regular Flat or evolves into an Expanded Flat through an extended Wave C.
If Wave Y completes as expected, the higher-degree Wave (IV) would likely come to an end, allowing the market to transition into Wave (V). Under this scenario, the next objective will be to identify the beginning of a new motive sequence and evaluate the potential strength and extension of the fifth wave.
Nevertheless, if the correction remains incomplete after Wave Y has finished, the structure may continue evolving into a Triple Three (W-X-Y-X-Z). In that case, Wave Z is not limited to a specific corrective pattern. According to the Elliott Wave Principle, it may develop as a Zigzag, Flat, Triangle, or any other valid corrective combination, provided that the structural, time, and price relationships between W, Y, and Z remain consistent with the characteristics of the completed pattern.
Aggressive Scenario
The aggressive interpretation presents a different structural perspective.
In this view, Wave W is considered a completed Simple Zigzag, while the rally into the previous high is labeled as Wave X. Based on this count, the market is now developing Wave Y.
Rather than forming a simple corrective pattern, Wave Y may evolve into a larger Double Three combination. As long as the internal structure of this wave remains incomplete, the end of the higher-degree Wave (IV) cannot yet be confirmed. Consequently, every bullish movement should be evaluated in terms of its internal structure, wave personality, and structural relationships before concluding that a new impulsive trend has begun.
At this stage, the most important factor is not simply where price moves next, but how it moves. The emergence of a clear five-wave impulsive advance, accompanied by a decisive breakout from the corrective channel, would significantly increase the probability that Wave (IV) has been completed. Until then, any upward movement may still prove to be corrective in nature, leaving the broader correction structurally valid.
This analysis is not a prediction of the future. It represents my structural interpretation of the market based on the rules, guidelines, and structural relationships of the Elliott Wave Principle.
What you see here is the result of years of study, research, and practical experience dedicated to understanding wave structures and the language of the market. As new waves emerge, the market continuously provides fresh information that may refine—or even reshape—the preferred wave count.
For that reason, Elliott Wave analysis is less about predicting the future and more about objectively interpreting what the market is revealing at every stage of its development.
📌 Note:
If any part of these scenarios is unclear, I encourage you to review the previous analyses attached to this publication. This study is part of an ongoing structural research project, where each analysis builds upon the foundation established by the previous ones.
🌐 Intermarket Perspective:
When appropriate, I also compare correlated and inversely correlated markets, as structural confirmation—or divergence—across related assets can provide valuable evidence in support of the preferred wave count.
Price is the outcome; Structure is the cause.
Patterns whisper. I listen.
— Mr. Nobody | Elliott Wave Principle Long 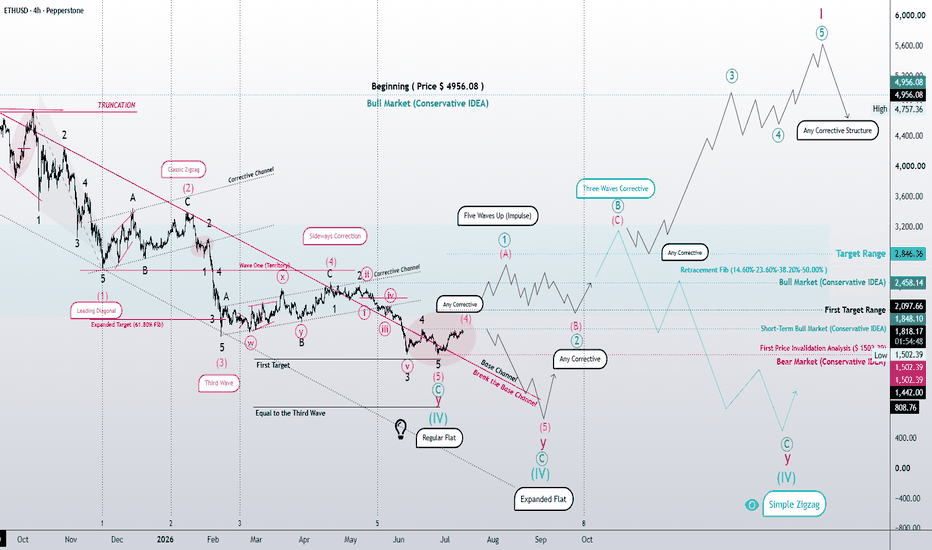

 Long
Long