DXY: Consolidation, Liquidity Hunts, and the Next Macro MoveHi!
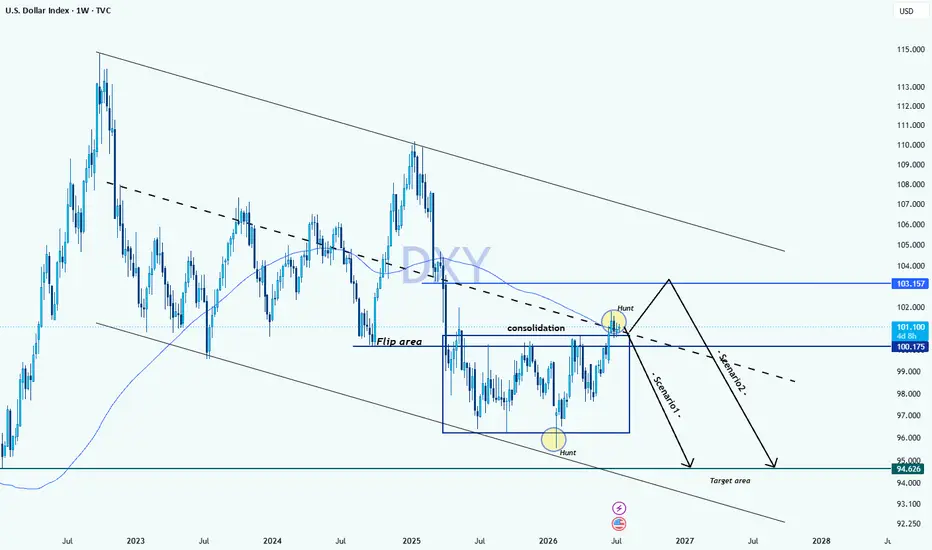
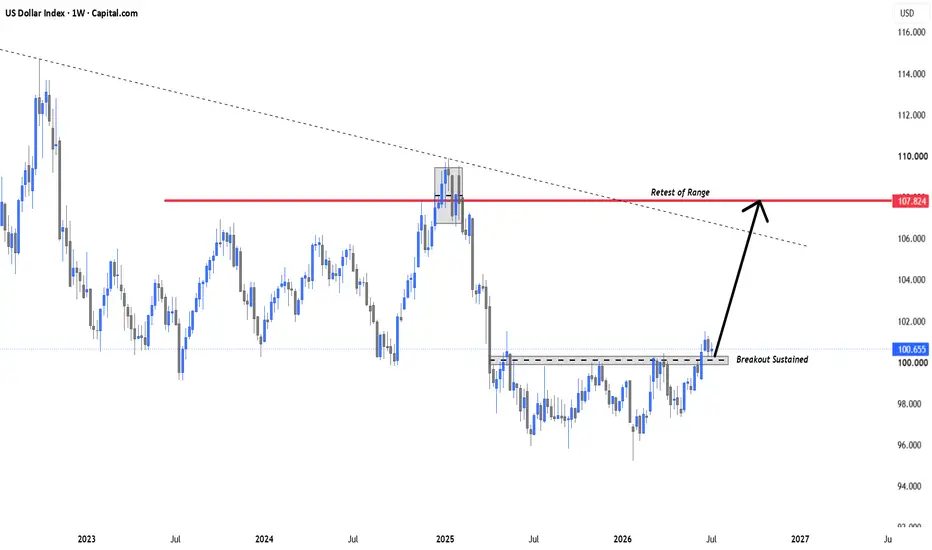
The US Dollar Index (DXY) is sitting at a critical macro inflection point on the weekly chart, currently trading around 101.109. After breaking down below a massive weekly support level (now acting as a Flip Area around 100.175), the index has entered a prolonged consolidation phase right in th
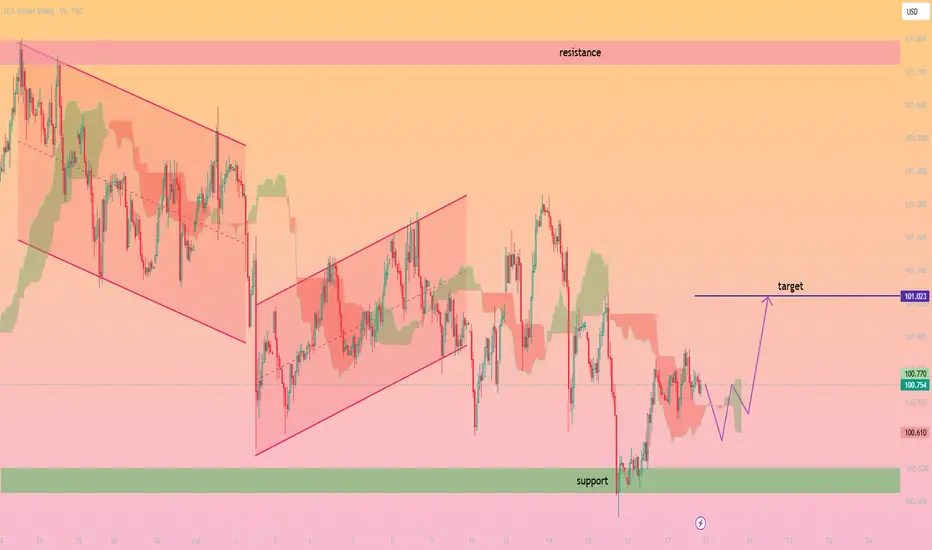
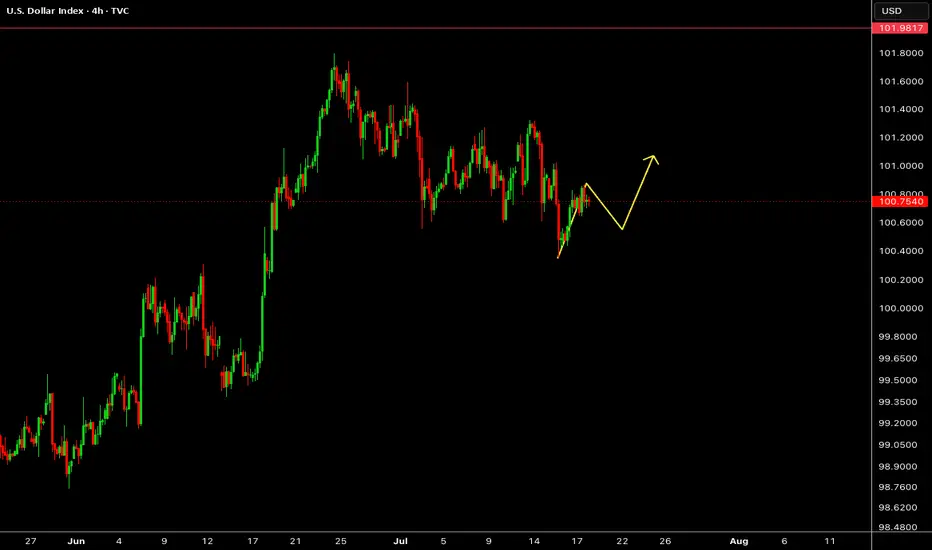
DXY Bullish Recovery from Support – Eyes on 101.02 Resistance
The **U.S. Dollar Index (DXY)** is showing signs of a potential bullish recovery after finding strong support around the **100.45–100.50** demand zone. Price recently bounced from this key support area and is attempting to stabilize above the **100.70** level.
Although the broader trend has been b
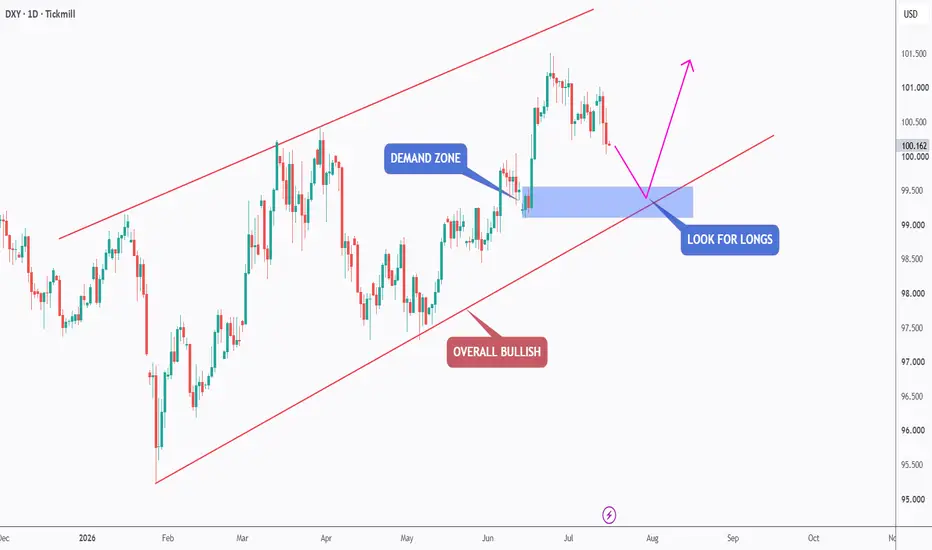
DXY - Bullish Trend Retests Key ConfluenceThe U.S. Dollar Index (DXY) has remained overall bullish, trading within the rising channel marked in red. After the latest impulsive rally, price is now entering a healthy correction phase. 📈
Price is currently approaching a high-confluence support area formed by the intersection of:
• The lower
17.07.26 Daily ForecastGood day guys!!
Apologies for the no uploads the past two days, I have been so busy with work, early starts and late finishes I have had no time to properly record a forecast.
I will do my best over the weekend to put together a short video just recapping my week, so far only one test trade take
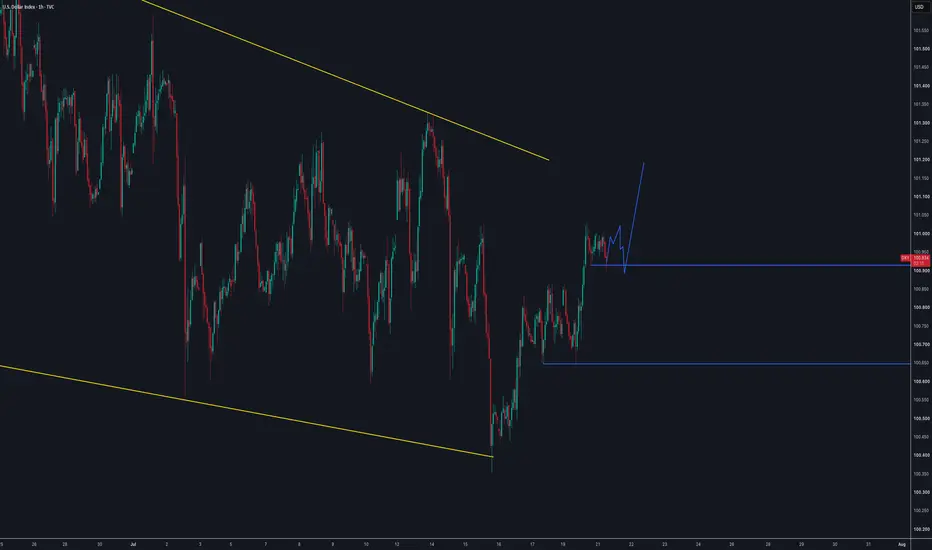
21.07.26 Daily ForecastGood day everyone!!
No video forecast today due to being out of the door early to work, hopefully this should be the last day before fully resuming video forecasts as normal.
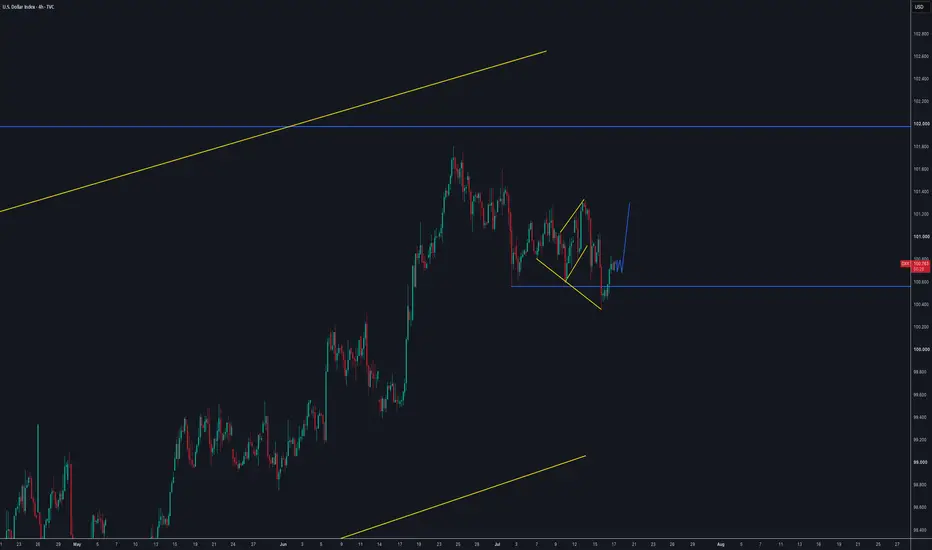
As you can see from previous forecasts with the DXY, we did get that move to the upside as expected. Now it is a question
14.07.26 Daily ForecastPairs on Watch -
FX:NZDUSD : The daily timeframe showing two tweezer tops and failing to see gives great confluence for the longs, and we have a larger structure forming almost a 123 move to the upside where we can play that last part long. If the DXY does sell short term, we can look for a 1H s
DXY (US Dollar Index) – 6H Chart Analysis
Title: DXY Testing Descending Trendline Resistance – Bearish Continuation Still Favored
The US Dollar Index remains under medium-term bearish pressure after failing to reclaim the previous swing high. Price is respecting a well-defined descending trendline that has capped every meaningful rally si
4H Roadmap: The Structure That Will Decide the Weekly Scenario# **DXY | 4H Roadmap: The Structure That Will Decide the Weekly Scenario 🌀**
Greetings, fellow wave practitioners.
In the previous weekly analysis, I presented two valid long-term scenarios for the U.S. Dollar Index (DXY): an **Aggressive Scenario** and a **Conservative Scenario**. The purpose of
DXY: Dollar Pullback Before the Next Impulse?The U.S. Dollar Index is approaching a pivotal stage after its recent decline, with price beginning to stabilize within the broader bullish structure.
At this stage, we're watching closely to see whether the current move develops into a corrective pullback before buyers attempt to regain control. T
See all ideas
Displays a symbol's value movements over previous years to identify recurring trends.
Frequently asked questions
US Dollar Index reached its highest quote on Sep 28, 2022 — 114.680 USD. See more data on the US Dollar Index chart.
The lowest ever quote of US Dollar Index is 88.143 USD. It was reached on Feb 16, 2018. See more data on the US Dollar Index chart.
US Dollar Index is just a number that lets you track performance of the instruments comprising the index, so you can't invest in it directly. But you can buy US Dollar Index futures or funds or invest in its components.