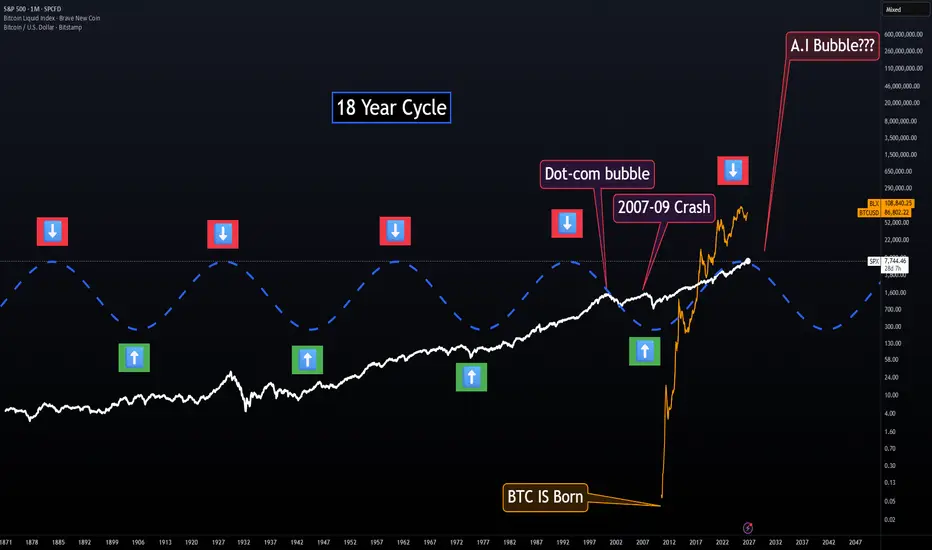
18-Year Cycle — Visual ModelThis is an easy-to-read visual version of my 18-Year Cycle model.
If you’re a visual person like me, this unfinished version makes the cycle much easier to see. The green arrows represent the stronger/good periods of the cycle, while the red arrows represent the higher-risk periods where major market stress and crashes have historically occurred.
Based on the way this model is lining up, it’s pointing toward another major risk window ahead. One possibility I’m watching is whether the current A
Economic Cycles
ETH update 02.10.26 - 24h Market Forecast (Wavelet Decomp.)# Ethereum — 24H Forecast & Reconstructed Price Analysis | October 2
Ethereum is showing a pattern broadly similar to Bitcoin.
The reconstructed/denoised price has tracked the subsequent real price movements reasonably well. The relationship between the reconstructed and actual prices around the September 28 decline was particularly notable.
Before the decline, the reconstructed price was significantly below the actual market price, indicating that the market price was potentially elevated re
BTC update 02.10.26 - 24h Market Forecast (Wavelet Decomp.)# Bitcoin - 24H Forecast & Reconstructed Price Analysis | October 2
The reconstructed/denoised Bitcoin price has been tracking the subsequent real price movements reasonably well.
Until around September 28, the reconstructed price was significantly below the actual market price. This suggested that Bitcoin was potentially overextended relative to the underlying reconstructed price and could move lower.
That scenario was confirmed on September 28, when the price dropped significantly.
After t
U.S. Election Cycle & BitcoinSolid blue lines mark presidential election windows.
Dashed blue lines mark midterm windows.
Bitcoin has repeatedly seen important price shifts around these periods. The goal is not to imply elections cause the moves, but to track whether the midterm timing window continues to align with major BTC cycle transitions.
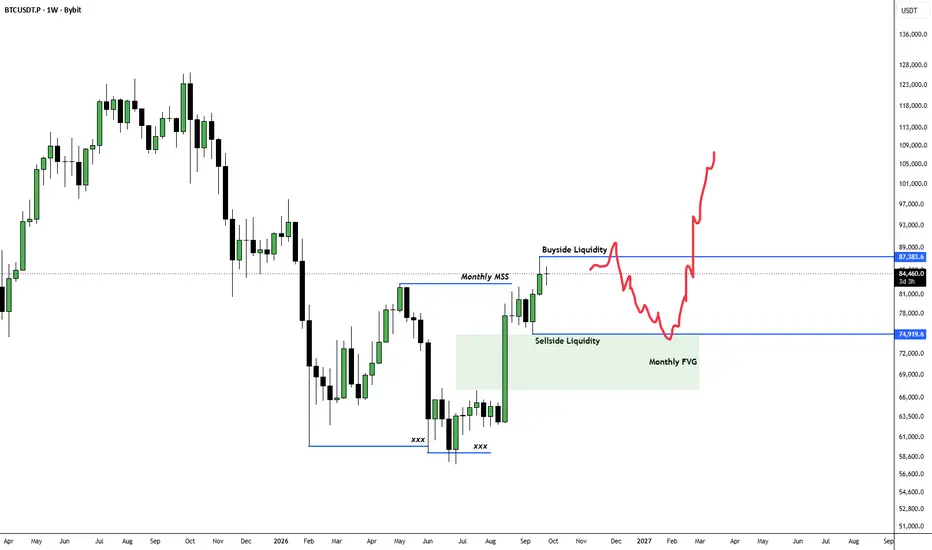
BTC HTF IDEAThis is the zone where Institutions would like to DCA.
So we could see atleast see 2 months of chop here.
- First we take out buyside liquidity and trap longs.
- Then flush the longs out while institutions build their orders through downtrend and take out Sellside liquidity.
- Fill the Monthly FVG and then start the journey to new ATH by 2027.
1) Monthly MSS
2) Multiple weekly close above 50sma on weekly
These two hint that the bear market is over.
WTI Crude Oil | Testing a Nested Wave III Structure⏱️ Reading Time: About 2 Minutes
For this update, I am focusing only on the bullish scenario and allowing price action to show us whether this structure can continue to develop.
One possibility I am currently tracking is a sequence of three nested 1–2 structures across different degrees. If this interpretation is correct, the market may be building the early stages of a larger Wave III, with each lower-degree structure preparing the next impulsive advance.
The recent decline is important, but
Two entry paths, two single-name winners: this morning's tapeThis morning gave a clean live read on two Cool-Off Sniper entry paths — on GOOGL and AMZN, not the usual QQQ/SPY.
GOOGL: the TREND signal fired ~09:40 at ~346.9. The underlying ran to 350.25 (+0.96%) in 18 minutes. The Sep-30 350 0DTE call premium went 1.03 to 2.09 intraday; the +100% target was achieved.
AMZN: the RECLAIM path printed twice ~09:38–09:44 (both B+ grade), then the TREND diamond ~09:48 confirmed the move. The underlying ran 246.46 to 250.29 (+1.55%) in 20 minutes. The 247.5 0DT
Bitcoin 4H | Bullish Structure & The Golden Possibility⏱️ Reading Time: ~3 minutes
Hey everyone,
In this update, I’m focusing only on the bullish scenario for Bitcoin, looking at it from two different structural perspectives.
At first glance, the larger-degree structure suggests that a motive pattern is developing or approaching completion. If this interpretation is correct, then after the current advance, I would expect the market to develop at least a three-wave corrective structure.
That’s why I’ve mapped the potential correction in blue. I s
DOGEUSDT Analyses-56, September 30, 2026
Welcome to my page! I share daily technical analyses of crypto and other charts here.
BINANCE:DOGEUSDT
🔍 Market Structure Analysis:
DOGE remains bearish overall on the 1H chart, with lower highs still controlling the broader structure. However, price is reacting from the 0.09250 support area, creating a short-term bullish setup.
🎯 Entry & Exit Signal:
Buy Entry: 0.09373
Stop Loss: 0.09283
Targets: 0.09553 R/R:2 - 0.09770 - 0.09950 - 0.10400
Key Support & Resistance:
Key Resistance
Bitcoin 4H | Two Paths, One Structure⏱️ Reading Time: ~3 minutes
Hey everyone,
In this 4H Bitcoin update, I’m looking at two main scenarios. Both are based on the rules and guidelines of the Elliott Wave Principle, but each one suggests a different structural path for the market.
🔴 Scenario 1 | Bearish Case
In the bearish scenario, the assumption is that the recent bullish structure has been completed and the market is now developing a higher-degree corrective pattern.
The current structure could develop into an Expanded Flat,
Silver | Behind the Structure of Wave IV⏱️ Reading Time: ~3 minutes
On the 4-hour timeframe, Silver remains at a point where the structure has not yet revealed its final path. The recent decline may still be part of a more complex correction, and in the bearish scenario, it could continue developing as a Double Zigzag.
🔵 Bullish Scenario
If Silver avoids a deeper decline from the current area and instead develops a valid motive structure, the picture changes. In that case, we could see at least three bullish waves at a larger degre
Gold | When the Structure Hasn’t Had the Final Word YetOn the 4-hour timeframe, the current structure can still support more than one path. If the recent decline has actually completed a corrective structure such as a triangle, the market now needs to reveal its next direction through Price Action followed by a valid motive structure.
In Scenario 1: Bullish Case, we would expect at least one recognizable bullish structure to develop after the correction is complete, allowing the market to extend higher. But even in this path, simply breaking a pric
18-Year Cycle — Late 2020s Risk WindowThis chart looks at the 18-year market cycle and how major financial disruptions have repeatedly appeared around similar phases of the cycle.
The tops and bottoms of the red sine wave both represent financial-stress windows. The idea is not that only the peaks or only the troughs matter. Different crisis events have appeared around both extremes of the cycle, which is why the chart marks crashes, panics, bear markets, and financial disruptions near both the upper and lower turning points.
Hist
Nifty 50 – Long-Term Trend at a Critical LevelThe 200-week SMA has acted as an important long-term trend reference for the Nifty 50 across multiple market cycles. The chart highlights several instances where prolonged corrections found support around this moving average before the broader uptrend resumed.
Nifty is now approaching the 200-week SMA near 22,606, with the index currently around 22,716 with a low at 22569.
The investment thesis is simple: this is an important zone to monitor for a long-term trend response. A sustained hold aro
Elliott Wave View: Gold (XAUUSD) Working Through Zigzag PatternThe short‑term Elliott Wave view in Gold (XAUUSD) indicates that the cycle from the August 25, 2026 high is unfolding as a zigzag corrective structure. From the August 25 peak, wave A concluded at $4282.23, followed by a rally in wave B that terminated at $4509.59. The metal has since resumed its decline in wave C, which is subdividing into a five‑wave impulse pattern. This development highlights the continuation of corrective pressure within the broader structure.
From the peak of wave B, wave
Iran | When the Value of Money Tells the Story⏱️ Reading Time: ~2 minutes
This is not just a chart about the dollar.
It is a long-term look at the changing value of the Iranian rial against the U.S. dollar.
When we step back and look at USD/IRR over several decades, the scale of this move becomes difficult to ignore.
But Elliott Wave asks a different question:
What is the structure behind the move?
On the chart, the area around 42,000 stands out as an important structural reference. The powerful move that followed raises a larger quest
Silver: The Bullish Case Rests on the Zigzag Family⏱️ Reading time: about 3 minutes
In the bullish case, the current structure could complete with a Simple Zigzag. One reason this scenario remains structurally valid from the perspective of the Elliott Wave Principle is the alternation between corrective waves. The Wave II at the higher degree was an Extended Flat, while the current correction may develop with a sharper and different personality. From a corrective-character perspective, this combination can therefore remain consistent with the pr
Episode 09 — When Elliott Began Drawing the Boundaries🎬 Mr. Nobody’s Chronicle
Season I — The History of Elliott Wave Principle
Episode 09 — When Elliott Began Drawing the Boundaries
⏱️ Reading time: ~3 minutes
“If this pattern truly exists, there must be a point where it can no longer continue.”
In the previous episode, we followed Ralph Nelson Elliott deeper into the world of structure.
He was no longer simply watching prices move up and down.
He wanted to understand something deeper.
How was a large movement built from smaller movements?
W
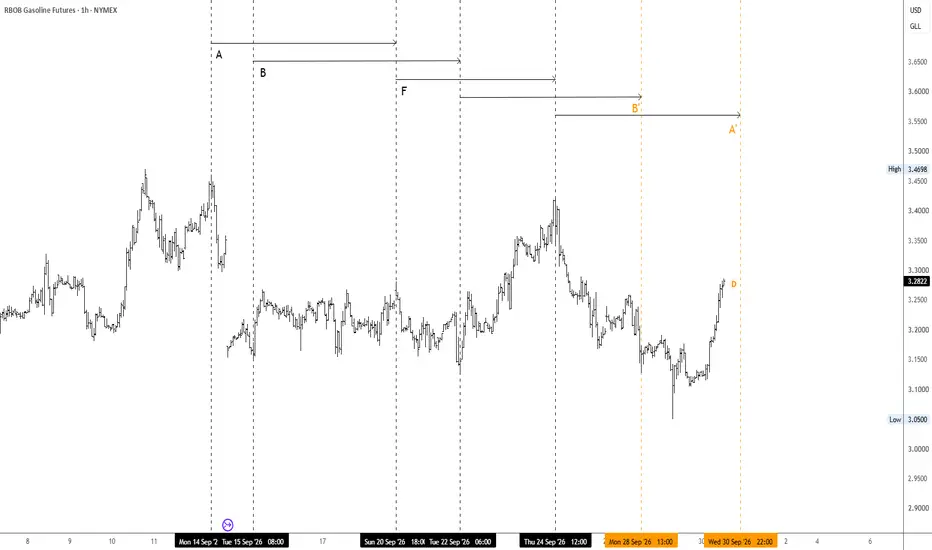
BTC Mirror CandidateThe current sequence is showing a possible 4 → 3 → 2 → 3 → 4 time structure, measured in monthly bars between alternating pivots.
If the mirror continues to develop, B′ would fall around October and A′ around January.
One detail worth watching: B′ may inherit the character of a relatively minor swing, while A′ carries the possibility of becoming a more significant H or L.
Still only a candidate at this stage. The next pivots will tell us whether the symmetry holds.
Gold: Fear or Structure?⏱️ Reading Time: ~2 minutes
In the market, no structure is carved in stone.
Price itself creates the structure with every move—and as its behavior changes, that structure can change with it.
On the Gold chart, what matters to me is not simply where the market goes next. The real question is:
What structure are the bulls and bears building?
Sometimes price looks calm and corrective, while underneath it, a force is developing that could completely change the path. At other times, a structure