Nifty IT Index: Reversal Signs and Structural Resilience!
🚀 Nifty IT Index: Reversal Signs and Structural Resilience!
Nifty IT – Technical View
• CMP: ~37,176
• Stop Loss: 29,700
• Target: 39,357
Nifty IT index mein ek strong structural resilience dekhne ko mil rahi hai. Index lagatar apne crucial breakdown levels ke upar sustain kar raha hai, jo ek bade trend reversal ka shuruati sanket hai.
📈 Key Technical Observations:
• Breakout Confirmation: Final confirmation tab aayegi jab index 32,080 ke upar majbooti se nikal jayega.
• The Big Picture: Con
Fibonacci Retracement
GOLD - Countertrend correction. The hunt for liquidity IC:XAUUSD maintains its global bearish trend, although a local countertrend correction is beginning to take shape. The fundamental backdrop remains weak...
The dollar is undergoing a correction amid profit-taking, as is oil. Warsh has not commented on the rate path. The Fed's policy outlook remains hawkish, with the probability of a pause this month at around 22%. However, geopolitics and elevated oil prices are limiting upside potential.
Gold is attempting to establish a foothold above $4
BCH: Is a Major Bullish Breakout Coming?Yello Paradisers! Could #BCH be approaching a significant bullish reversal while the majority of market participants remain focused on the recent correction? The latest 8-hour technical structure is revealing several important developments that deserve close attention, particularly as #BCH approaches a critical support region.
💎#BCH is currently trading near $275, following a corrective movement from its recent high around $370. Despite the recent selling pressure, the broader price structure r
TTMI #2: Half Given Back, Still in the Upper HalfIn the first idea I drew a Fibonacci retracement from the February 2022 low to the June 2026 high. Price was sitting just above the 0.5 Fibonacci line then, and I watched that line, reading the giveback as a pause inside the advance from February 2022.
Since then price has lost the 0.5 Fibonacci line, so more than half of that advance has been given back, and price is still above the rising regression channel middle line I added this time, in the upper half of the rising channel. The first circ
XAUUSD · H1 Elliott Wave + Fibonacci October 14, 2026 XAUUSD · H1
Elliott Wave + Fibonacci
October 14, 2026 · Chart captured at 08:20 UTC
1. Market Overview — Gold at a Critical Decision Zone
Gold is approaching a significant technical area around the 50% Fibonacci level at 4,142.218, following a decline from the recent high at 4,217.735.
The key question is whether the current decline represents the final stage of an A-B-C correction or the beginning of a more extensive bearish structure.
From an Elliott Wave perspective, both scenarios remain po
EURUSD - A countertrend correction ahead of the news FX:EURUSD maintains its medium-term bearish trend. A strong dollar index and a weak fundamental backdrop are putting pressure on the currency pair...
The dollar index continues to rise within a bullish trend. Yesterday’s inflation data pointed to an increase, and against this backdrop traders expect 2–3 rate hikes.
The global trend for the euro is bearish; however, the currency pair is forming a trading range, within which consolidation continues ahead of the news.
Another batch of news is b
GOLD - A countertrend correction ahead of the CPI. Downtrend...IC:XAUUSD is confirming another bearish structure within its medium-term downtrend. However, inflation data is due to be released, and the market could develop a corrective move.
The dollar has paused its correction, while Treasury yields have stabilized. Traders are taking profits following gold’s recovery last week. Rising oil prices, which have reached two-week highs, have intensified inflation concerns and supported the dollar.
CPI data will be the key factor determining gold’s next mo
BITCOIN - Consolidation Amid a Bull Market CycleBINANCE:BTCUSDT.P maintains its medium-term bullish trend while forming a local countertrend correction, potentially setting the stage for consolidation ahead of a possible medium-term distribution phase
Various analytical services point to temporary market stagnation, while also indicating fresh capital inflows. From a technical perspective, this may reflect improving market sentiment, with additional support coming from the strong S&P 500 and Nasdaq indices.
Globally, Bitcoin has broken
ICT + VOLUME PROFILE — ADVANCED MARKET ANALYSIS.
Smart Money Concepts • Liquidity • Market Structure • Volume Distribution
1. Introduction to ICT and Volume Profile
Successful trading requires more than identifying support and resistance. It requires a deeper understanding of market structure, liquidity, price delivery, and the areas where significant trading activity occurs. ICT (Inner Circle Trader) and Volume Profile provide two complementary approaches for analyzing these factors and building a structured trading strategy.
ICT focuses on
GOLD-XAUUSD | (15M) | Trend Analysis | Prof.TraderTilki Key Level: 4143
If a 15-minute candle closes below 4143, target 4120, stop 4169, RR ≈ 1.53
Upside Scenario: Close above 4172, target 4200, stop 4157, RR ≈ 1.86
Stop Management:
Initial stop will be 15$.
Below 4143 close: entry, stop 4169, target 4120
Above 4172 close: entry, stop 4157, target 4200
Breakeven Rule:
Once price moves 7$ in your favor, move stop to entry.
Guys, it’s thanks to each of your likes that I keep sharing these analyses.
To all of you who kindly suppo
HYPE Looks Amazing Here For A LongHyperliquid is trading at the bottom on the descending triangle which also lines up with th NAV Zone. and a 4 hour demand as well. This leads me to believe that we can expect a nice bounce here targeting 50% of channel.
Calculate Your Risk/Reward so you don't lose more than 1% of your account per trade.
Every day the charts provide new information. You have to adjust or get REKT.
Love it or hate it, hit that thumbs up and share your thoughts below!
This is not financial advice. This is for ed
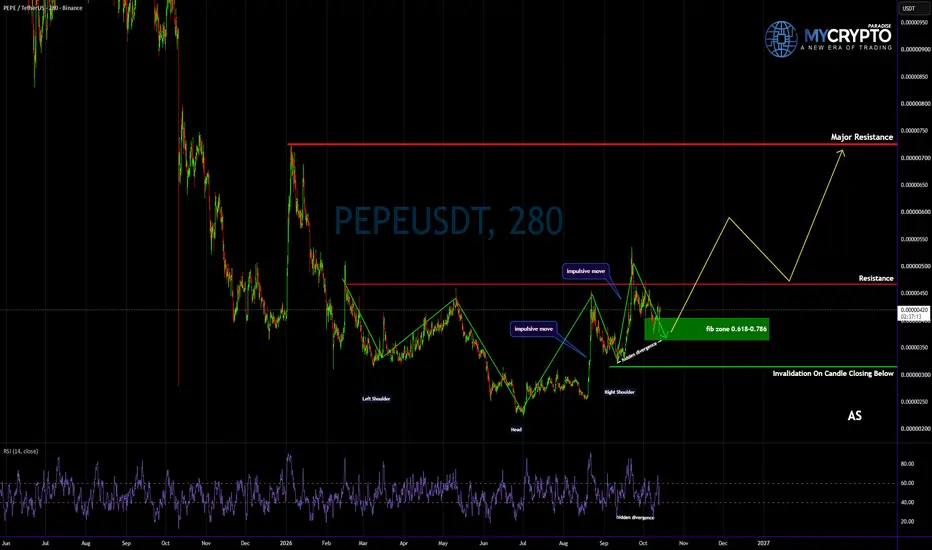
PEPE: Bullish Reversal Before a Major Rally?Yello Paradisers! Could #PEPE be preparing for a massive bullish breakout while most traders are still waiting for confirmation? The latest price action suggests that a potentially powerful bullish setup is developing, but one critical support zone must hold before we can expect the next major move.
💎#PEPE has been developing a potential inverse head-and-shoulders formation, a bullish reversal pattern that often appears when selling pressure begins to weaken and buyers gradually regain control
WMT #1: Every High Below the LastPrice is below the rising channel red dashed middle line, in the lower half of the rising channel, and since the 0 line each rally has topped below the one before.
What I watch is the 0.236 line, around 112. The first circle marks where the falling channel upper band crosses it, and price is at that circle now. Turning lower from the circle keeps the highs stepping down. Holding above both the falling channel upper band and the 0.236 line would mean the fall is over.
If the fall continues, t
XAUUSD Bearish Outlook | Liquidity Sweep & Reversal.
Gold (XAUUSD) is displaying a notable recovery from the lower price region, with recent bullish displacement and a Break of Structure (BOS) indicating a shift in short-term market behavior. Price is currently trading around 4,194, approaching a key technical area where liquidity, resistance, and potential supply-side reactions deserve close attention.
The primary focus of this analysis is to understand how price interacts with significant liquidity levels and Fair Value Gaps (FVGs), rather tha
GOLD - Bearish trend. Rebound from 4220 IC:XAUUSD maintains its bearish trend and is forming a bounce as part of my latest trading idea. The market remains within the 4,110–4,220 range. A reversal setup could trigger another decline.
A strong dollar, rising oil prices, an unstable fundamental backdrop, and anticipation of CPI data are weighing on gold. The market remains in a bearish trend and could extend its decline. Thin liquidity increases the risk of sharp price movements.
The key level is $4,200: holding above it would str
XAUUSD — 4,100 Is the Last Buyer Test
Gold is trading in a sensitive area again, and this chart is giving a very clear message: buyers are trying to defend the bottom, but the recovery still looks weak.
After the strong rejection from the upper area near 4,220, price failed to continue higher and quickly returned back into the lower range.
That rejection is important because it shows that the market did not accept higher prices. The move above the previous structure looked more like a liquidity grab than a clean bullish breakout.
H1 Liquidity Sweep Toward 4,207
Fundamental Analysis
Gold is recovering strongly today, supported by a softer U.S. dollar and easing oil prices. Spot Gold recently gained around 1.4%, while Treasury yields pulled back from their recent highs. Markets still see only about a 19% chance of another Fed hike in October, but December tightening expectations remain elevated around 84%, keeping volatility high. Reuters
The next important catalyst is U.S. consumer sentiment and inflation expectations, which could influence USD and Tre
FIBONACCI + EMA — PROFESSIONAL TRADING EDUCATION.
Fibonacci Retracement and Exponential Moving Averages (EMA) are two powerful technical-analysis tools that can be combined to build a structured and disciplined trading approach. Neither indicator predicts the market with certainty; instead, they help traders understand trend direction, potential reaction zones, momentum, and trade location.
1. Understanding Fibonacci Retracement
Fibonacci Retracement is mainly used to identify potential areas where price may retrace before continuing in the d
XAUUSD: Trendline Break or Bull Trap?
Market Context
Gold is starting to show a stronger reaction from the lower demand area after several weeks of bearish pressure.
The main trend has been bearish, with price moving inside a descending structure and respecting the downward trendline multiple times. However, the latest reaction from the lower channel area is important because buyers have finally created a short-term CHoCH and pushed price back above the immediate bearish pressure zone.
This does not mean gold has fully turned b
H1 Support Rebound Toward 4,220 Liquidity
Fundamental
Gold remains under pressure from a stronger U.S. dollar and elevated Treasury yields after the latest Fed minutes reinforced expectations for another rate hike later this year. Markets are currently pricing a low probability of an October hike but around an 85% chance of a December increase. Fed Governor Christopher Waller also said further hikes may be needed, although the timing can remain flexible. Reuters
This keeps the short-term macro backdrop challenging for Gold, while geopo
IBM #2: The July 2026 Low Still StandsIn the first idea the level I watched was the 224 area, where the channel lower band ran close to the 0.5 line. Holding that zone kept the July 2026 low as the low of this trend.
Since then IBM rallied to the 0.382 line, around 250, and turned there, with Pearson’s R still at 0.91. On the way back down it fell below the channel lower band. The channel lower band keeps rising while the Fibonacci lines stay flat, so the two tools that met in the 224 area have moved apart, and IBM now sits just ab
GOLD - A short squeeze in 4220 could trigger a decline IC:XAUUSD remains within a medium-term bearish trend. However, the market is recovering locally as part of a liquidity-hunting phase. The key focus is on the current trading range.
The dollar is stagnating as traders take profits ahead of the long weekend in the U.S. and await next week’s key CPI inflation report. However, the DXY remains in a bullish trend.
The CPI report will determine whether a Fed rate hike in October can be ruled out and whether a December hike remains on the table. G
SILVER 1D | 0.76 Fib Retracement After Bullish Structure ShiftSILVER (XAGUSD) | Daily Long Setup at the 0.76 Fibonacci Retracement
Context:
After a downtrend from May with clear lower highs and lower lows, silver formed a bullish RSI divergence at the July lows: price made a lower low while RSI made a higher low. In August, price broke above the previous lower high and rallied to a higher high near 71.47, shifting the daily structure to bullish.
Current position:
Silver has since pulled back and is now trading at the 0.76 Fibonacci retracement of the Jul
Bitcoin Rebounds From Key Support — Can Bulls Reclaim $84K?Bitcoin ( BINANCE:BTCUSDT ) reacted well to the Support Zone($81,950-$82,960) and has started moving higher from an area near the Cumulative Long Liquidation Leverage($82,570-$81,800).
After the bearish move over the past 24 hours, buyers are now attempting to regain short-term control.
Can Bitcoin break above $84,000 and extend the recovery toward $84,500?
Technical Analysis
From an Elliott Wave perspective, Bitcoin appears to have completed a Five-Wave Bearish Structure, suggesting that co