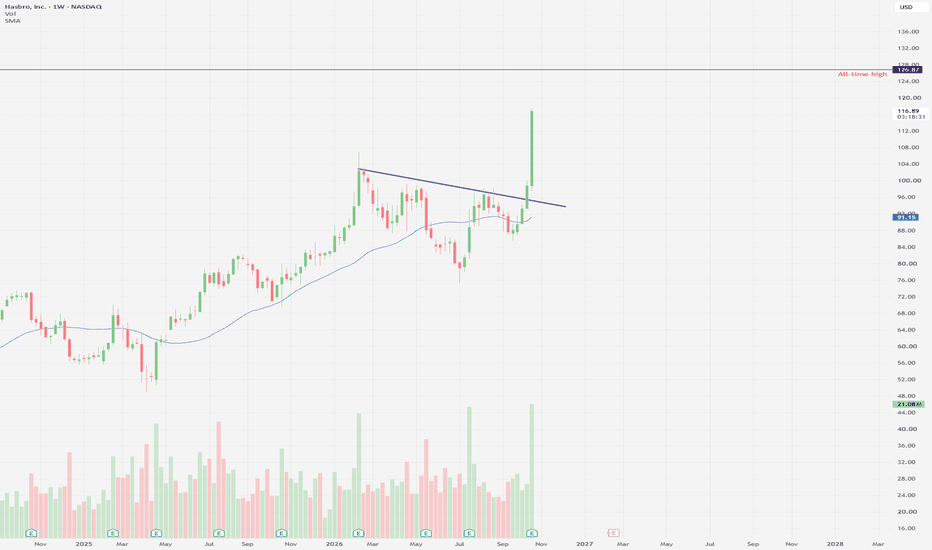
Hasbro shines in a mixed sectorA strong earnings reaction has pushed HAS out of a lengthy base and towards all-time highs. This move is accompanied by strong volume, so there's clearly interest in the name. Note: I have a position from about 113.
Let's review some of the things that I like:
Consumer retail has shown improvement in recent weeks, even if the consumer is getting hammered in a high inflation/high fuel price driven by war in Iran. There has still been some recent strength in other toy names - JAKKS, Mattel,
Flag
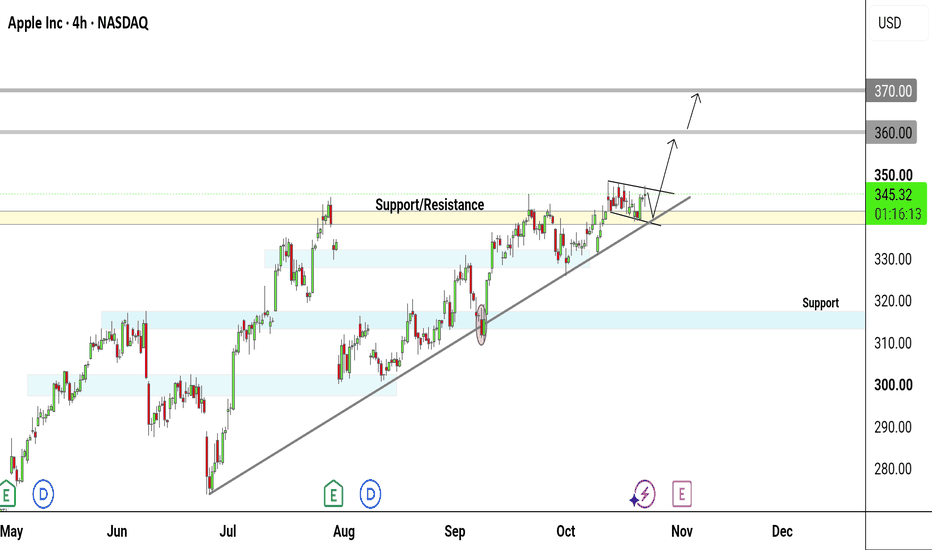
AAPL Holding Above Major Support and Bull Flag Setup Targets 370Executive Summary
Apple Inc. (AAPL) is demonstrating a strong bullish continuation setup on the 4-hour chart. The price is holding firmly above the key $340–$342 Support/Resistance flip zone while consolidating within a tight bull flag pattern. Supported by a multi-month ascending trendline, a breakout above the upper flag boundary signals a continuation toward the primary target at $360.00 (+4.20%) and extended upside toward $370.00 (+7.09%).
Key Technical Confluences
Support/Resistance R
Bitcoin, HYPE and ZEC Price Price Ready to Bounce BackBitcoin, Hyperliquid (HYPE) and Zcash (ZEC) are showing potential recovery signals after a sharp crypto market sell-off reportedly erased $70 billion in market value over 10 hours. Crypto analyst Ali Charts has identified new buy signals for all three assets, with their next moves depending on whether key support levels hold.
Bitcoin Price Prediction
Bitcoin fell 2.80% after approaching $85,000, retreating toward $82,000. The TD Sequential indicator has now flashed a buy signal, suggesting the
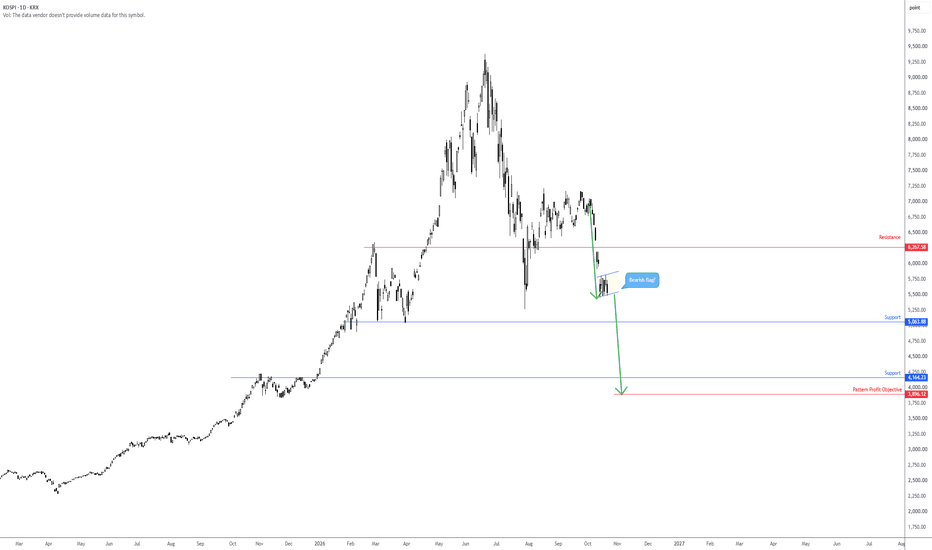
Bearish flag for South Korea’s KOSPI, anyone?From the daily chart of South Korea’s KOSPI, price action is on track to form a bearish flag pattern between 5,450 and 5,809. If the index breaks lower, chart pattern enthusiasts could target as far south as 3,896. However, before price can reach that low, support is at 5,063, followed by another layer of support at 4,164, which happens to be centred just north of the noted downside objective at 3,896.
Written by FP Markets Chief Market Analyst Aaron Hill
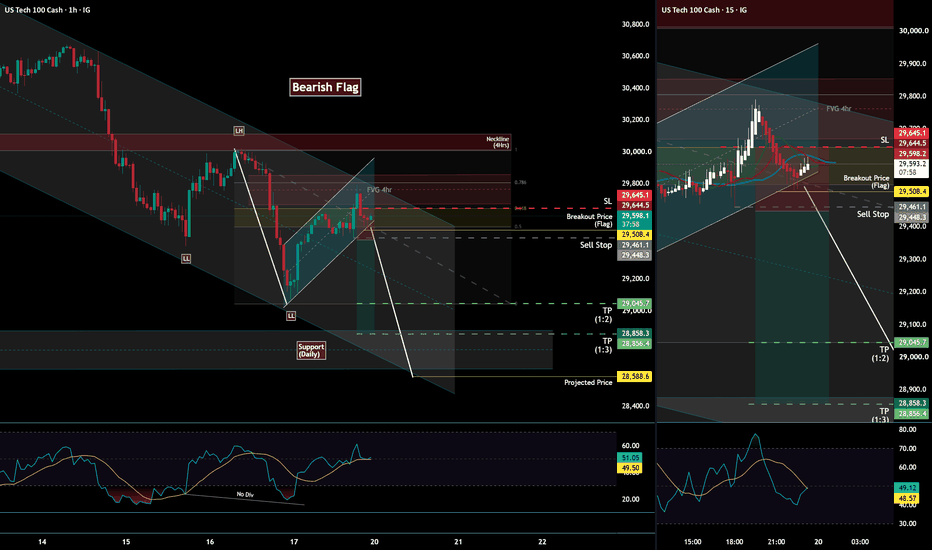
Nasdaq 100 (NAS100) – Multi-Timeframe Bearish Flag Continuation The Nasdaq 100 has been exhibiting signs of weakness since early October after forming a bearish RSI divergence on the 4-hour timeframe, followed by a decisive neckline breakdown that confirmed a shift in short-term market structure. Since the breakdown, price has continued to trade within a well-defined bearish channel, consistently producing lower highs and lower lows, reinforcing the prevailing bearish trend.
Following the initial decline, price entered a corrective recovery phase and has no
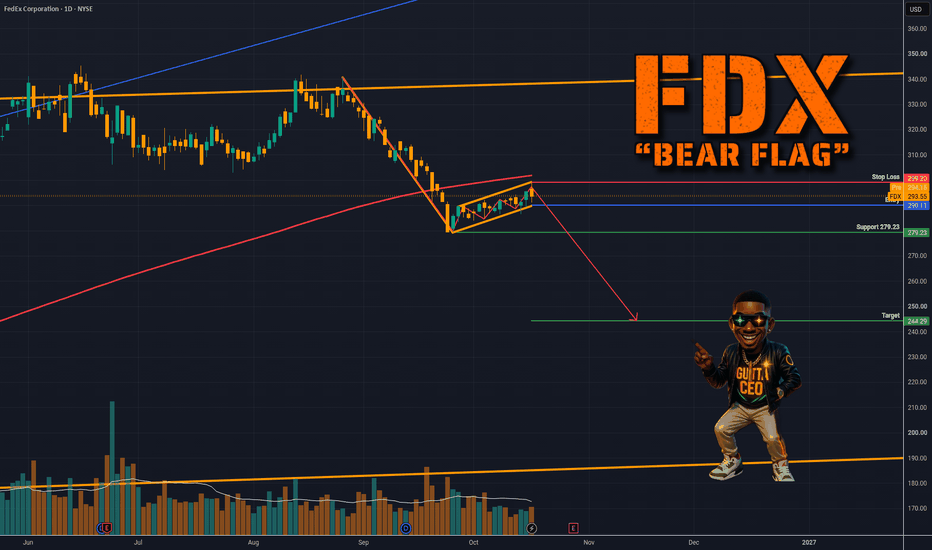
FedEx is signaling a Bear Flag on the DailyNYSE:FDX dropped sharply from about 341 to 279 (Aug–Sep) and is now drifting up in a tight bear flag just under its 200-day average.
The setup:
• Entry: break and daily close below 290.11 (the flag's lower line)
• Stop: 299.20, above the flag highs
• Support to watch: 279.23, the pole low
• Target: 244.29
• Risk/reward: about 5:1 from entry
The flag is rising on light volume after a high-volume drop, which is classic continuation behavior. Losing 279.23 opens the path to the target.
Risks: A
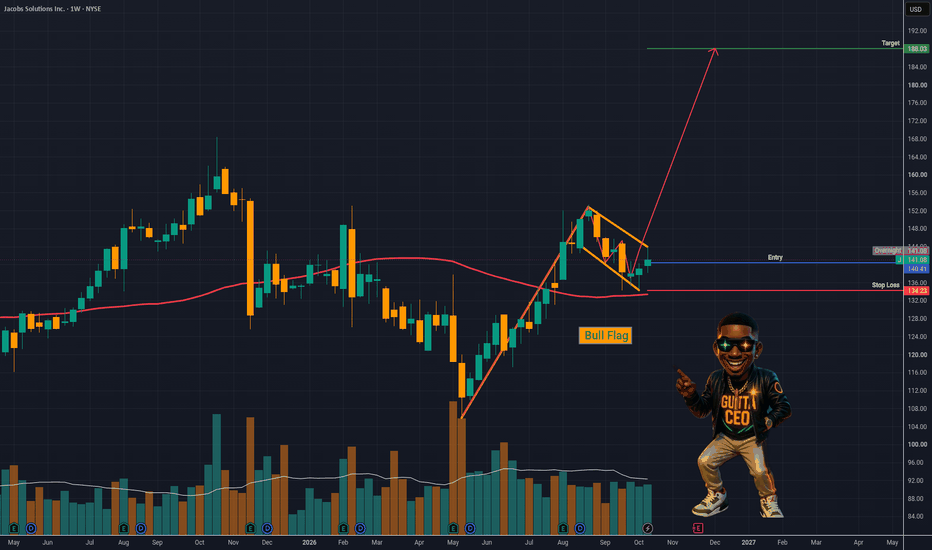
Jacobs is signaling a Bull Flag on the WeeklyNYSE:J is coiling in a tight bull flag on the weekly after a strong pole from about 106 to 153 (May–Aug).
The setup:
• Entry: weekly close / breakout above 140.41. A more conservative trigger is a daily close above 144.35.
• Stop: 134.23, below the flag lows
• Target: 188.03, the measured move from the pole
• Risk/reward: about 7.6:1 from entry
Price is holding the 50 and 200 averages while the flag tightens. Watch for volume expanding on the breakout.
Risks: Earnings are 11/19, so manage size
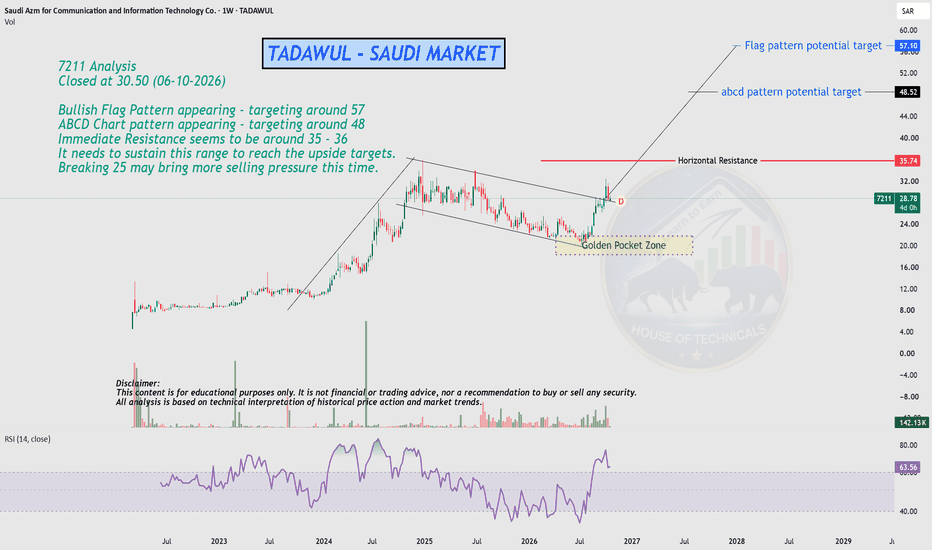
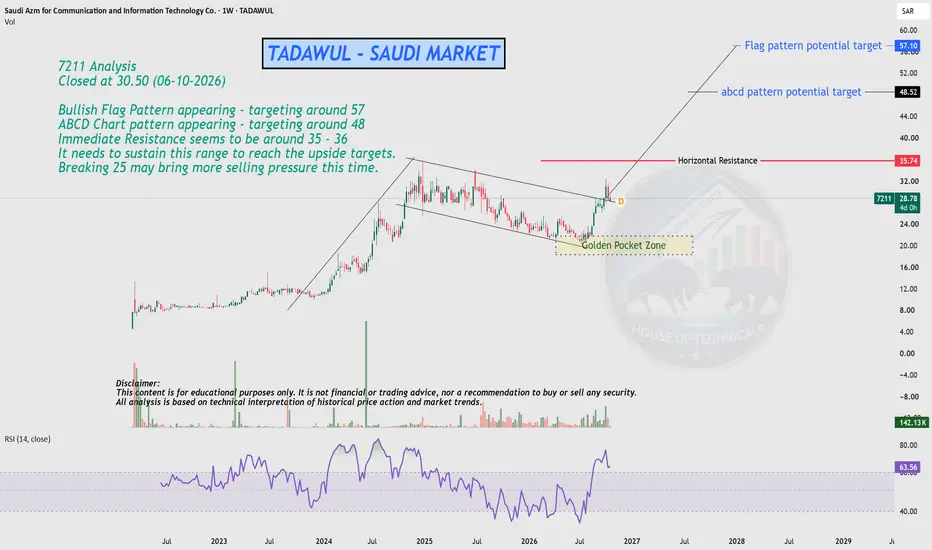
Bullish Setup in 72117211 Analysis
Closed at 30.50 (06-10-2026)
Bullish Flag Pattern appearing - targeting around 57
ABCD Chart pattern appearing - targeting around 48
Immediate Resistance seems to be around 35 - 36
It needs to sustain this range to reach the upside targets.
Breaking 25 may bring more selling pressure this time.
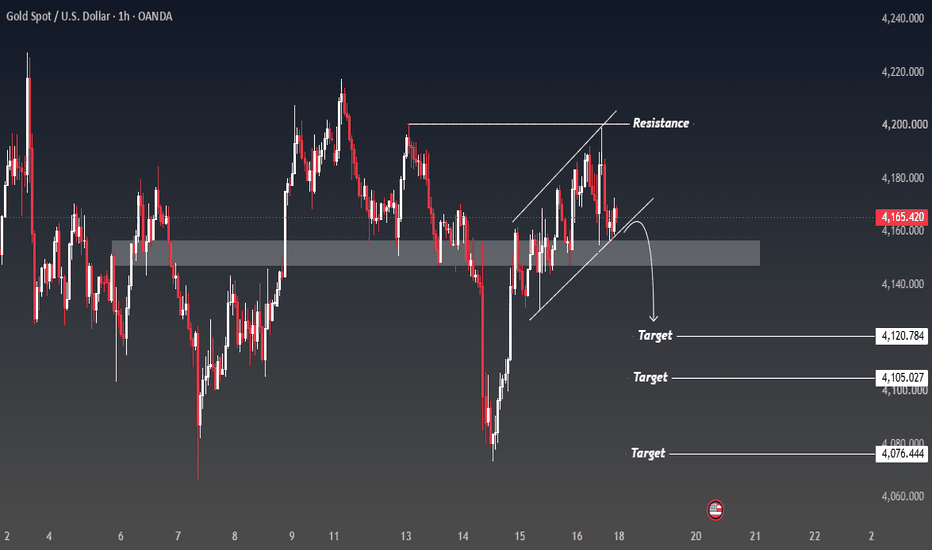
XAUUSD: Gold Is Losing Momentum Near Resistance — Is a Pullback?XAUUSD: Gold Is Losing Momentum Near Resistance — Is a Pullback Coming? 📉
Gold (XAUUSD) is approaching a critical decision zone on the 1H chart. After a strong recovery from the recent lows, price is struggling to sustain its move higher inside a rising channel.
The key question now: **Will buyers break above resistance, or will sellers take control and push gold lower?**
🔎 Technical Analysis
Gold is currently trading around **4,165**, near a marked support zone around **4,148–4,156**.
Pri
USDC Treasury Mints $250 Million in New TokensThe USDC Treasury has minted $250 million in new tokens, a move highlighted by the CryptoTwitter commentator @whale_alert. This significant minting event reflects growing demand for stablecoins amid shifting market dynamics. As stablecoins play a central role in liquidity provision, this could enhance trading activity across various platforms.
Inside the Move
The crypto market just witnessed a notable development as the USDC Treasury minted $250 million in new tokens, which could signal an inc
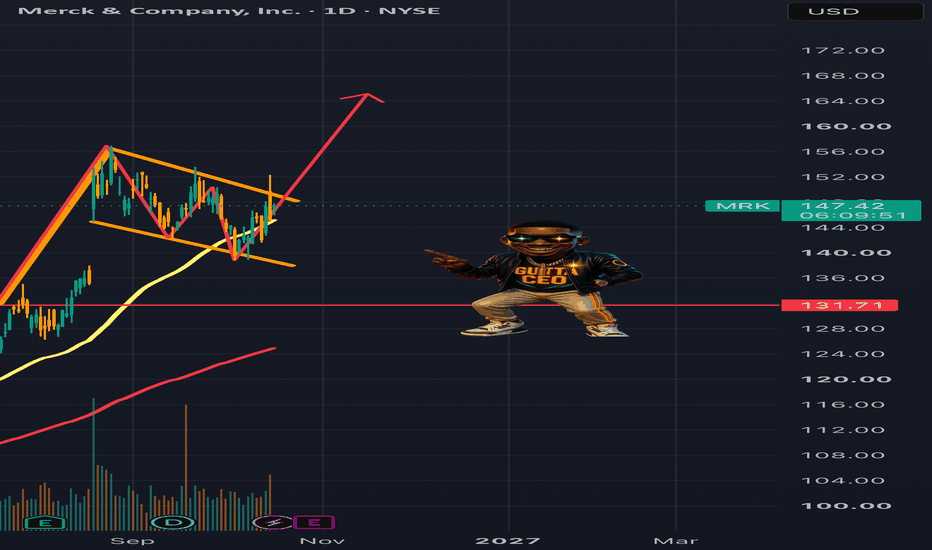
MRK: Bull Flag…..Watching 150 for the Breakout!NYSE:MRK is coiling in a clean bull flag after a strong run from about $112 to $156. The pullback has been orderly on lighter volume, and the rising 50-day MA has caught every dip. Price is holding above both the 50 and 200 MAs, so the bigger trend is up. The weekly chart shows the same flag, which adds conviction. It's at $146.90 now and pressing on the upper flag line.
📈 **Trigger:** a daily close above 150, clearing the upper trendline. The last attempt wicked to about 152 and got rejected,
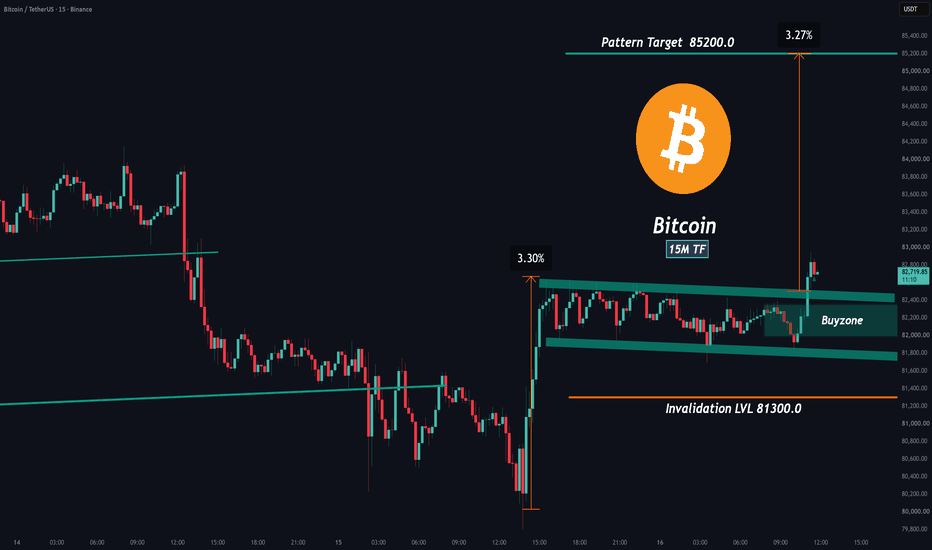
Bitcoin: A Short-Term Breakout Setup Is DevelopingShort-term trading requires flexibility. When the market structure changes, we need to reassess the setup rather than stay attached to our previous bias.
Bitcoin has formed a short-term corrective channel on the 15-minute chart after a strong upward move. Price has now broken above the upper boundary of that channel, opening the possibility of further upside.
View the BTCUSDT chart and setup
Trading Setup
Timeframe: 15 minutes
Buy zone: The marked consolidation area around $81,800–$82,
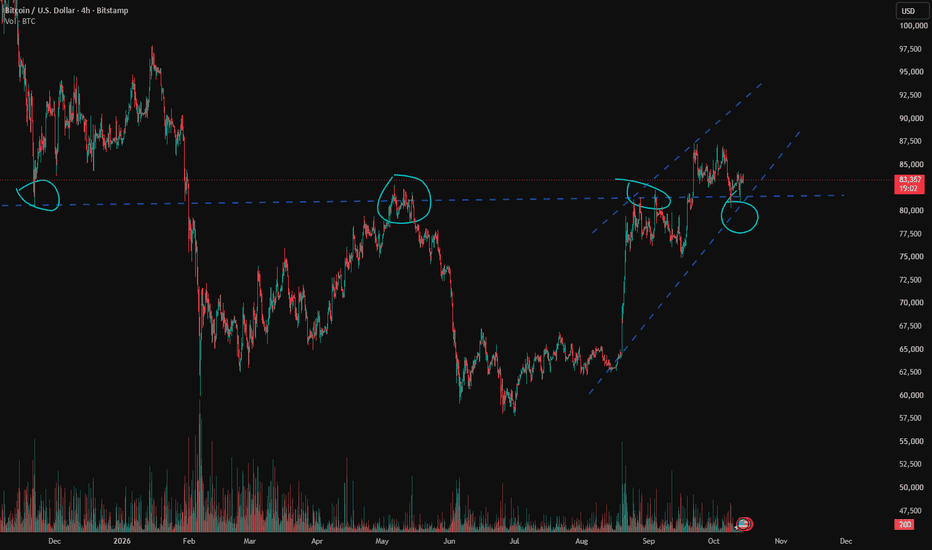
Could this be a Bullish Flag?After the 5 day rally that started on September 17, BTCUSD has been correcting for almost a month now and playing within this channel.
Could it be a bullish flag that we would eventually break out of to the upside like the one we apparently broke out of on September 3?
Or is BTCUSD likely to continue playing within this channel?
ATM, I would watch the price action around the boundaries of the range for scalps.
The key to trading is understanding the market direction.Looking at the current market structure for Bitcoin 📈, there is potential for a continued short-term rise, with the possibility of testing the $90,000–$100,000 range.
Traders who went long at high levels are about to see their positions turn profitable. If you are a long-term trader, be sure not to close your positions at current levels.
For short-term traders, consider two scenarios: a rise followed by a drop, or a drop followed by a rise. If the price dips below $80,000 first, you can increa
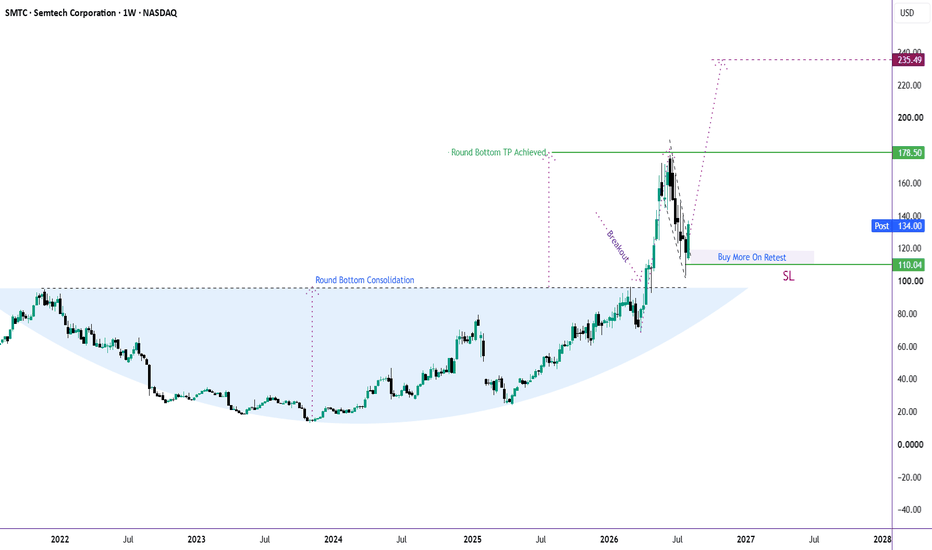
SMTC | A Textbook Bull Flag Breakout Within a Major UptrendAfter completing a multi-year Round Bottom and achieving its initial measured target, Semtech (SMTC) appears to be setting up for the next leg higher.
The recent pullback has developed into a large bullish flag, and price is now attempting to break out while holding above the prior breakout zone—a textbook continuation pattern.
📊 Technical Outlook
🟢 Round Bottom breakout already confirmed
🟢 Bull Flag breakout in progress
🟢 Retest holding above major support
🎯 Target 1: Previous swing high ne
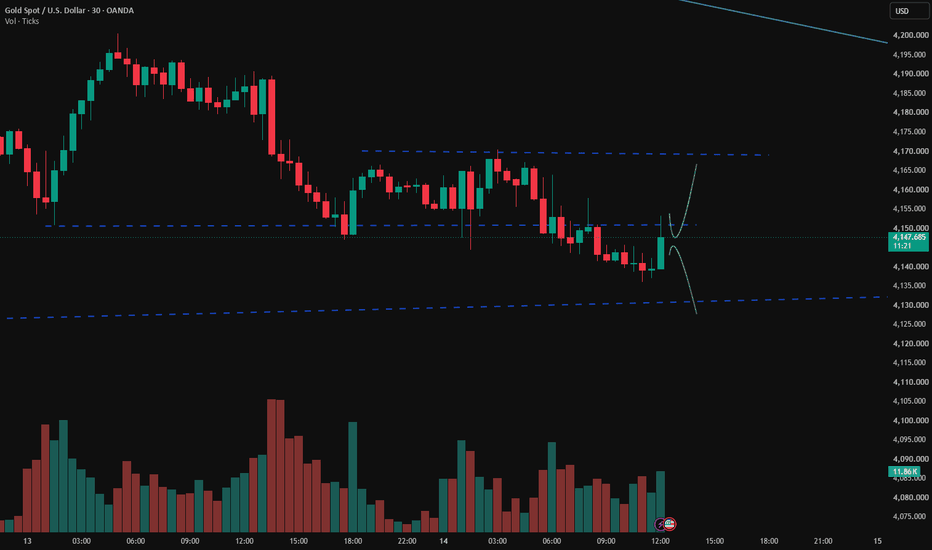
The key to trading is understanding the market direction.Just before the New York market opens, gold has begun to rally, having touched a low of $4,136. We need to watch whether the current price of $4,146 can hold and break through. If it fails to do so, the price could drop to $4,120 in the short term.
Conversely, if the $4,146 level holds firm, we can look for the price to reach $4,170. By following my strategy analysis, you will see that the bulls have absolutely no reason to panic.
Radico Khaitan: Ready to Break Out?Fundamental Analysis
Revenue Growth: FY2026 revenue reached approximately ₹6,050 crore.
Profitability: EBITDA margin improved to around 16.9%.
Financial Stability: Debt declined while shareholders' funds increased.
Growth Drivers: Premium spirits and strong brand portfolio.
Key Risk: High valuation requires sustained earnings growth.
Technical Analysis
Current Price: ₹4,550
Resistance: ₹4,685
Support Zone: ₹4,145–₹4,290
Upside Targets: ₹5,125 and ₹5,800
Trading Outlook
Bullish: A strong daily c