$BTC 4-year Cycle Prophecy Culmination NearElevator down, stairs up, usually results in another elevator down, until you jump back into an elevator up.
CRYPTOCAP:BTC riding below the 9EMA,
about to test prior swing-high $75 - $76,2
Next up should be the 200DMA ~$73k
Note falling RSI and Volume to support this idea.
Moving Averages
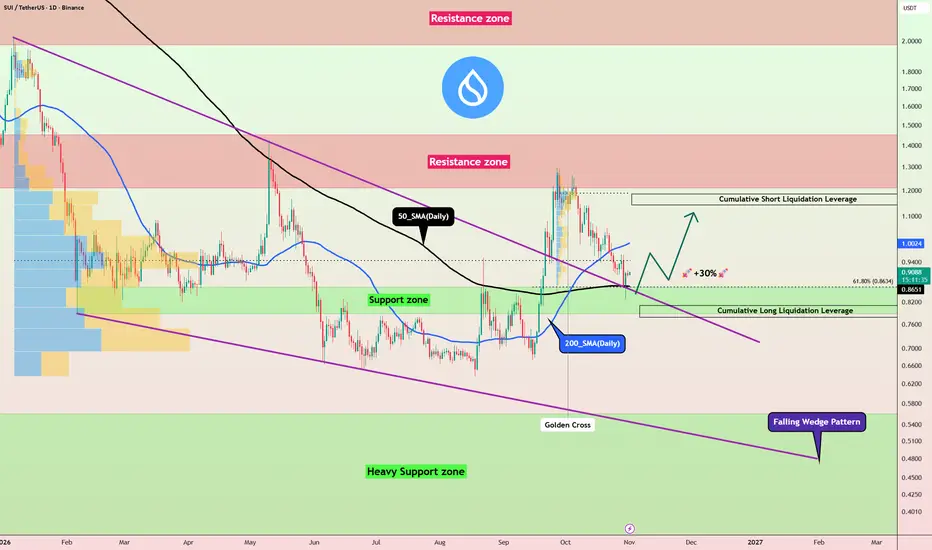
SUI Flashes a Golden Cross — Is a 25% Rally Coming?SUI is trading near a major support area after recent selling pressure, while several technical signals are beginning to favor a potential bullish recovery.
Fundamentally, Sui continues to expand through Mercado Bitcoin in Brazil, its growing DeFi ecosystem, and tokenized assets, although upcoming token unlocks and increasing circulating supply remain short-term risks.
Can SUI defend this support and break $0.95 to trigger its next major rally?
Fundamental Outlook
Sui continues to show prom
Could we have seen this coming?SPY + VIX: Preparing for a Potential Selloff
The conditions marked on this chart could have helped traders prepare for downside, even without knowing the exact timing or size of the move.
• SPY was forming lower highs: Rallies were failing below previous peaks, showing weakening price structure.
• SPY’s bearish 8/21 EMA cross on October 22: This added evidence of weakening short-term momentum.
• VIX was strengthening: Its bullish 8/21 EMA cross on October 14, followed by higher lows, provide
SNAP: 87% Call Flow Off the 200-Day Into Nov 4 EarningsSNAP is bouncing off its 200-day SMA two days before earnings, and 87% of today's options premium is in calls.
OPTIONS FLOW (Nov 2, GTA Wire, 12:40 PM ET)
- $1.6M premium: $1.4M calls, $197K puts (87% calls)
- Put/call volume ratio 0.19
DARK POOLS (off-exchange share)
Oct 26: 37.7% | Oct 27: 44.4% | Oct 28: 50.0% | Oct 29: 40.7% | Oct 30: 46.5%
TECHNICALS (Daily)
- Price near 5.56, back above the 200-day (5.43) and 100-day (5.32) SMAs, still under the 50-day (5.76) and 20-day (6.10)
- Four st
P: 67% Put Premium as Everpure Drops 8% Under the 50-DayEverpure is down about 8% today and trading under its 50-day SMA, with two-thirds of the options premium in puts.
OPTIONS FLOW (Nov 2, GTA Wire, 12:40 PM ET)
- $4.2M premium: $1.4M calls, $2.8M puts (33% calls / 67% puts), put/call volume 1.5
- Dec 18 $135 puts: 326 contracts vs 151 OI, about $740K
- Nov 20 $100 puts: 753 vs 406 OI, about $270K
- Dec 18 $150 calls: 384 vs 26 OI, about $162K
DARK POOLS (off-exchange share)
Oct 26: 38.5% | Oct 27: 41.4% | Oct 28: 33.5% | Oct 29: 42.3% | Oct 30:
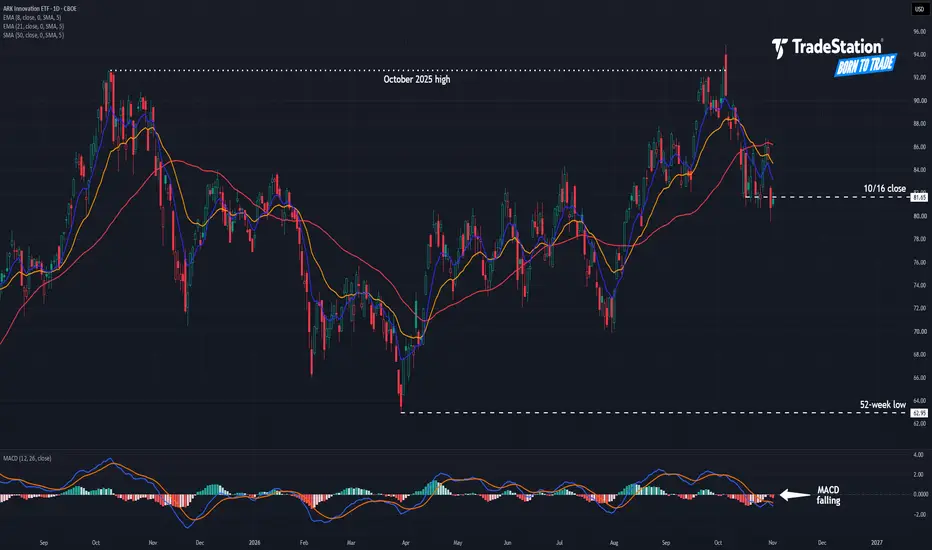
ARK Innovation: Is Support Breaking?The ARK Innovation ETF rallied sharply in August and September, but now it could be going the other way.
The first pattern on today’s chart is the October 2025 high of $92.65. The fund tried unsuccessfully to cross that level early last month. It quickly dropped from the high, potentially confirming a bearish reversal.
Second, ARKK had a weekly close at $81.65 on October 16. It probed below that level several times in the following sessions while managing to close above. However, it decisively
NZD/CAD: Bearish Breakdown Tests April 2025 LowsIntroduction & Overview:
Market: NZD/CAD
Timeframe: 1D (Daily)
Current chart price: 0.78665
Critical support: 0.78355
The New Zealand Dollar against the Canadian Dollar (NZD/CAD) is approaching an important historical support zone after an extended period of weakening price action.
The daily chart shows a clear deterioration in bullish momentum. Since the September 2026 highs, the pair has been forming lower highs and lower lows, with sellers maintaining control of the short-term trend.
The
FTAI: Wedge Breakout Cleared for Takeoff — $280s again?Story:
📊 The Pattern — FTAI pulled back into the long-term rising trendline, where it met the base of a falling wedge and a strong support zone of $149 level. It bounced from that confluence and broke out of the wedge with a large gap higher, reclaiming the EMA20 and EMA50 in the process.
⚡ The Confirmation — The breakout candle gapped over the upper wedge line, and volume has been building on the move. Price is now trading above the short-term moving averages. The gap and the EMA20 sit just b
Salesforce Could Be SlidingSalesforce rallied over the summer, but some traders may think it’s sliding in the autumn.
The first pattern on today’s chart is the September 3 high, followed by a lower low and lower high. That may suggest that a descending channel is taking shape.
Second, the recent peak was slightly above the highest daily close in December 2025. The software company’s unsuccessful probe above that level may be viewed as a false breakout or double-top reversal pattern.
Third, the 8-day exponential moving
Bitcoin Sell-Off Amid Binance Hack Fears—Can Bulls Reclaim $79?Bitcoin started declining from around $82,000 yesterday as reports of the Binance hack triggered another wave of selling across the crypto market.
At the same time, weakness in U.S. equities and continued geopolitical uncertainty in the Middle East added further pressure, pushing Bitcoin below the psychological $80,000 level.
Can BTC recover in the short term, or is a deeper move below $76,000 approaching?
Macro Outlook
With the weekend approaching, geopolitical developments in the Middle E
DE: Breakout Above 50 SMA After Support Reclaim💡 Swing setup idea
50 SMA Strategy
🔎 Analysis summary:
The stock broke under support and came back after closing a small cup. We can also see a crossing above the 50-day moving average. This alignment of trend, pattern and level makes the breakout area key to watch. The upside potential is projected by the depth of the pattern from the breakout point.
👀 Levels to watch:
Entry trigger: Break above $674.20
Target: $833.40
Stop: Under the resistance / base of the pattern
💬 Will DE break t
AUDUSD 1H: 9 Wins, 3 Losses — Following the TrendAUDUSD has shown an interesting transition over the past two weeks. After a strong bearish move, the market found support, recovered, and eventually broke above the 200 EMA, indicating a potential shift toward bullish momentum.
Using Ryan-Trend Pulse on the 1-hour timeframe, the strategy recorded some encouraging results.
📊 Performance Snapshot
✅ Winning trades: 9
❌ Losing trades: 3
📈 Total trades: 12
⚙️ Trading Strategy
1. 200 EMA — Trend Confirmation
Long: Look for buying oppor
200D EMA + 21W EMA Retest. Higher Low Forming or 74K Sweep firstI was wrong at the lows.
I thought BTC was going even lower. Instead price made a higher high and swept it. That changed the structure, and I'd rather admit it than fight it.
Structure looks bullish to me now, and cycle timing supports it. So my job is simple: buy the pullbacks, slowly, at levels I've planned. This pullback is one of them.
→ Where we are
Yesterday's wick tagged 76,326, right into the 200D EMA (~76.5K) + 0.886 fib (~76.3K), and bounced.
Weekly dipped under the 21W EMA (~76.7K
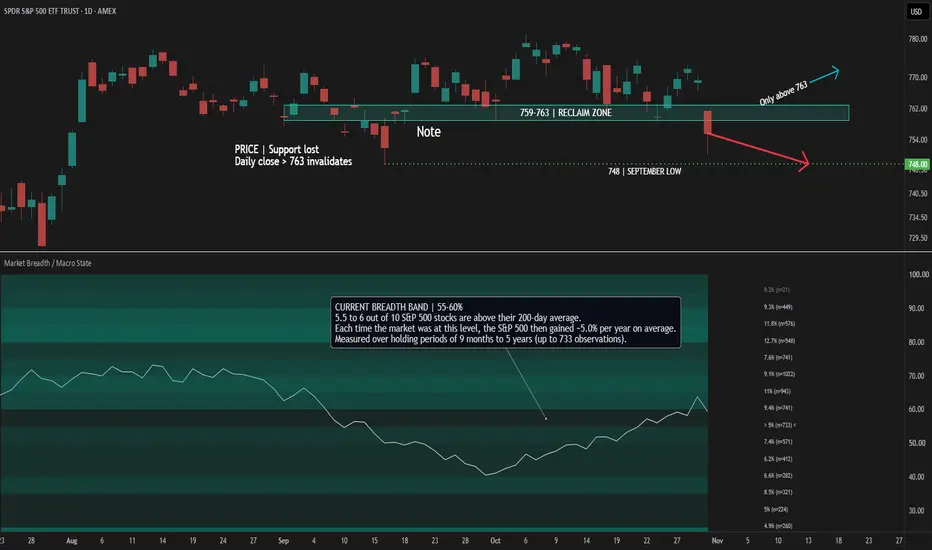
SPY Breaks Support: Breadth Signals CautionSPY has broken below 759-763. But the key message in the lower panel is not simply that breadth has recovered. It is the historical return backdrop associated with its current level.
THE CURRENT READING
Breadth is in the 55-60% band. Under the current settings, this band shows an annualized forward-return estimate of approximately 5.0%, with up to 733 historical observations per horizon. The neighboring 60-65% band shows 9.4% under the same settings.
This illustrates why a rising breadth curv
CBHB - Which direction next?Long term CBHB is in a strong uptrend, but for the past few weeks this stocks has been selling off (taking profit by retail traders).
Using a Fibonachi Retracement, we can use it to predict the next movement and also support and resistance as shown in the chart, we have a resistance Fib 38.2% and a strong support at Fib 61.8%, i would advice to watch this stock bcs it either break above reistance (38.2%) or go to support (fib 61.8%)
GOLD: H&S Breakdown Signals a Potential Deeper CorrectionHi!
Gold has finally broken below the neckline of a major Head & Shoulders pattern on the daily chart, adding weight to the bearish outlook.
The break also comes after losing the long-term rising trendline, with the 100 SMA now acting as overhead resistance.
My focus is on the $3,650 weekly support zone. A possible retest of the broken neckline before further downside remains a scenario worth watching.
If selling pressure continues and weekly support fails to hold, the measured move of the p
#JUPUSDT #2D (Binance) Descending channel break & retest [LONG]JUP (Jupiter) just printed a golden cross and looks ready for mid-term recovery.
⚡️⚡️ #JUP/USDT ⚡️⚡️
Exchanges: Binance Futures, Bitget Futures
Signal Type: Regular (LONG)
Leverage: Isolated (3.0X)
Amount: 5.1%
Entry Targets:
1) 0.2314 - 100.0%
Take-Profit Targets:
1) 0.3518 - 50.0%
2) 0.4723 - 50.0%
Stop Targets:
1) 0.2013 - 100.0%
Trailing Configuration:
Stop: Breakeven -
Trigger: Target (1)
Published By: @TradingOn
LSE:JUP BINANCE:JUPUSDT.P #2D #Jupiter #DEx #DAO
Risk/Reward= 1:4
#GWEIUSDT #1D (Binance) Bear flag on resistance [SHORT]GWEI (EthGas) just got rejected by 50MA, bearish continuation scenario seems likely.
Big unlock (about 237.9M tokens) is coming on October 21st, that may be the trigger.
⚡️⚡️ #GWEI/USDT ⚡️⚡️
Exchanges: Binance Futures, Bitget Futures
Signal Type: Regular (SHORT)
Leverage: Isolated (3.0X)
Amount: 5.7%
Entry Targets:
1) 0.02309 - 100.0%
Take-Profit Targets:
1) 0.01225 - 50.0%
2) 0.00684 - 50.0%
Stop Targets:
1) 0.02580 - 100.0%
Trailing Configuration:
Stop: Breakeven -
Trigger: Target (1)
Pu
BTC Weekly: Short From the Top Paying Out!!!On Oct 6, with price at ~85.7K and most people bullish, I posted the path in my idea "BTC big-picture: $82–84k first, $74k if the correction extends": one more flush to ~74K before the next leg up.
It wasn't easy. Price made a higher high, wiped out billions in short liquidations, and stopped me out a few times before I got the short in with size. Now it's payday.
Weekly structure:
→ After that liquidity sweep, BTC now lost the weekly 50 and 100 EMA and is now testing the 21
→ Structure is bre
VFV Long EntryThe strategy says enter.
Bullish MA structure remains intact.
Price pulled back to the 20 MA.
CCI has triggered.
Price remains above the established box.
Stop is defined at 186.75.
Emotion says wait because this pullback may have another leg lower.
The strategy doesn't predict the next leg. It defines the entry.
So we're in.
SL remains at the predefined level.
#BNBUSDT #1D (Binance) Head and Shoulders break & retest [SHORT]BNB (f.k.a. Binance Coin) is pulling back towards 50MA resistance after losing HnS neckline.
Seems likely to get rejected there and retrace down towards 200MA daily support.
⚡️⚡️ #BNB/USDT ⚡️⚡️
Exchanges: Binance Futures, Bitget Futures
Signal Type: Regular (SHORT)
Leverage: Isolated (11.0X)
Amount: 5.0%
Entry Targets:
1) 735.62 - 100.0%
Take-Profit Targets:
1) 656.21 - 50.0%
2) 576.69 - 50.0%
Stop Targets:
1) 762.13 - 100.0%
Trailing Configuration:
Stop: Breakeven -
Trigger: Target (1)
Pu
VRSN: Cup-and-Handle / Triangle Breakout Above 50 SMA💡 Swing setup idea
50 SMA Strategy
🔎 Analysis summary:
On the smaller perspective, we can see the stock closing a cup-and-handle / triangle pattern. We can also see the stock reaching resistance above the 50-day moving average. This alignment of trend, pattern and level makes the breakout area key to watch. The upside potential is projected by the depth of the pattern from the breakout point.
👀 Levels to watch:
Entry trigger: Break above $312.50
Target: $379.00
Stop: Under the support /
VRSN: Big Cup-and-Handle Breakout Above 50 SMA💡 Swing setup idea
50 SMA Strategy
🔎 Analysis summary:
In the bigger look, we can see the stock closing a big cup-and-handle from August 25. We can also see the stock crossing the 50-day moving average and reaching resistance. This alignment of trend, pattern and level makes the breakout area key to watch. The upside potential is projected by the depth of the cup-and-handle from the breakout point.
📈 Check out the second setup for the shorter-term trade:
👀 Levels to watch:
Entry trigg