BICONOMY [$BICO] Weekly TF Crypto Analysis FIB TC EWP ALGOBICO/USD – The Definition of an Asymmetric Gamble Coin
Biconomy has been trapped in a relentless multi-year bear market, losing more than 99% from its all-time high. Price continues to respect the long-term descending channel, and there is still no confirmed evidence that the macro trend has reversed.
That said, markets don’t need good fundamentals to produce extraordinary percentage moves. They only need exhausted sellers, improving liquidity and renewed speculation.
My interest begins around 1¢, where price approaches the lower boundary of the long-term channel and a major historical support cluster area. This is not a prediction that the bottom is in. It is simply the point where I believe the risk/reward becomes heavily skewed in favour of the bulls.
If Bitcoin enters another strong expansion phase and capital rotates into small-cap altcoins, even deeply damaged projects can experience explosive rallies. A move from one cent to several multiples is far more realistic than most people think. Whether OMXSTO:BICO can reclaim former highs is another question entirely.
This is not an investment. It is an ALGO trade with predefined risk.
Plan:
• Entry: around $0.01
• Thesis invalidation: a sustained breakdown below support.
• Thesis confirmation: a breakout above the macro GZ at $1.57
• Profit target: $150 (algorithmic TP)
Yes, the target looks absurd from today’s price. That’s the point. I don’t need to believe it will happen—I only need an algorithm that tells me when to get in and when to get out.
Remember: the probability of success may be low, but the payoff is enormous if the market decides to price in another altcoin mania. That’s what asymmetric trades are all about.
Not financial advice. Always do your own research and manage your risk.
Like and follow for more Elliott Wave and macro crypto analysis.
Parallel Channel
AVALANCHE [$AVAX] Weekly TF Elliott Wave Crypto Analysis FIB TCAVAX update:
My bearish outlook from February has played out almost exactly as anticipated. Price has remained inside the long-term descending channel, while the Wave C decline has continued to unfold toward the Fibonacci Golden Zone between $5.18 and $6.11.
This is the area I’m watching most closely. If my Elliott Wave count is correct, AVAX should be approaching the final stages of this macro correction. That doesn’t necessarily mean the low is already in—Wave C could still extend slightly lower or produce a final capitulation before reversing—but the risk/reward for long-term investors is becoming increasingly attractive, with an ALGO TP at almost $500.
The first meaningful confirmation of a trend reversal would be a sustained move back above the descending channel and a reclaim of the major swing highs. Until then, I continue to view rallies as corrective within the broader bearish structure.
Like and follow for more Elliott Wave and macro crypto analysis.
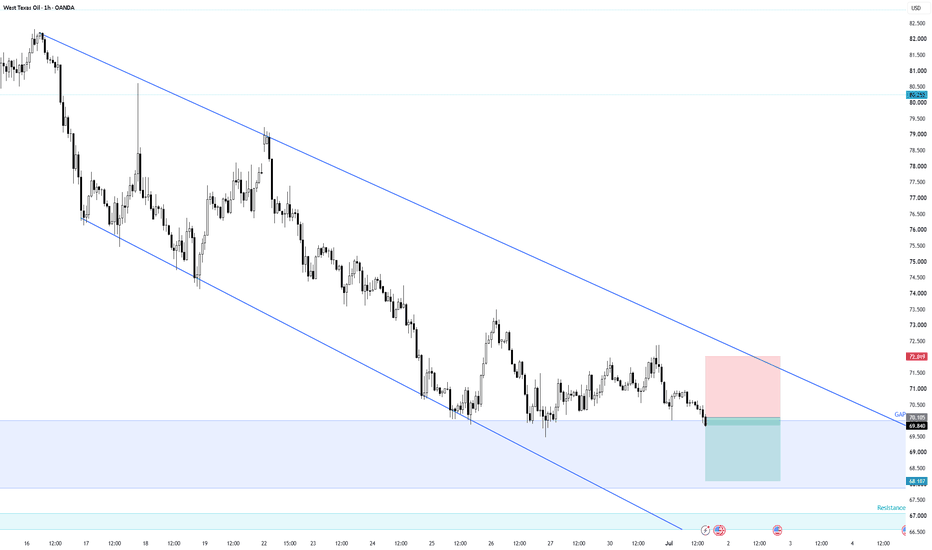
WTICOUSD 1H: The Gap-Fill Liquidity Run (Short Setup)
1. Market Context
On the 1H chart, Oil is trading within a dominant descending parallel channel. After a minor consolidation near the upper boundary, the price is executing a clean breakdown below the local support level at 70.103. This breakdown officially opens the door for a high-probability run to fill the historical gap down to the 68.107 level.
2. Sentiment & Price Trap Analysis
• The Retail Buyer Trap: Retail traders aggressively bought the local support around 70.500 to 71.000, expecting a bullish rebound toward the channel's upper boundary. Their stop losses (sell stops) are clustered heavily inside the unfilled gap zone, right below the key support floor of 70.103.
• The Gap Magnet & Liquidity Run: Unfilled gaps act as massive liquidity magnets because institutional algorithms seek to clear price inefficiencies. As the breakdown below 70.103 triggers the first wave of buyer stop-losses, the forced liquidation of these long positions will accelerate the downward momentum, driving the market straight into the core liquidity pool.
3. Trade Setup
We target a high-probability short entry to ride the liquidation momentum of trapped buyers into the gap-fill zone.
• Entry: 70.067 (Selling the breakdown of the gap trigger/local support)
• Stop Loss (SL): 72.019 (Placed safely above the local consolidation high and trendline confluence)
• Take Profit (TP): 68.107 (Targeting the complete fill of the historical gap / lower support)
• Risk-to-Reward Ratio (R:R): Approx 1:1
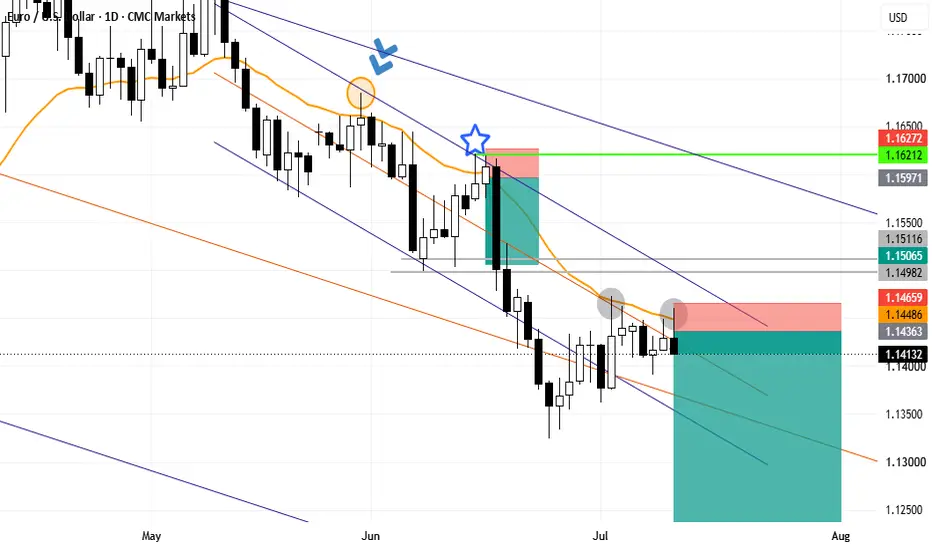
EURUSD BUY DAILY 20 EMA , REJECTION CANDLE BEARISH ENGULFING weekly and daily are bearish price is under 20 week ema, 20 day ema. now the level i have got marked on the chart has been a long term support level on the daily and it was just recently broken and we have had this slide down here, now we have had this bullish correctional move where the market has come back up and retest the 20 day ema dynamic resistance and respected it as resistance, in trending condition this is ideally where we want to see price action reversal signals to form because it is a key turning point
within a trend
the long upper tail on the the candle that is signalling to us that the move into higher prices were rejectedback down by the bears
ENTRY>>> now to enter this trade is going to use the retracement entry method, i have already planned out to enter here where prices retraced back up to the rejection candle and retest the 20 day ema, i place my stop few pips above the rejection candle high with a few extra pips added to it to cover the full risk of rejection candle setup, so i know my stop is at a level where if it is hit the whole trade was wipe out and i want to get out anyway because the trade is not working
ENTRY>>>
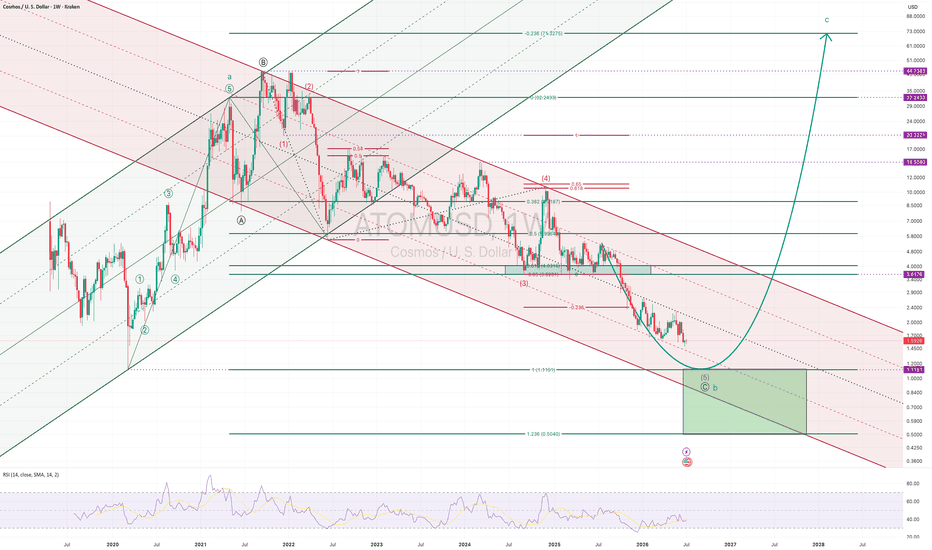
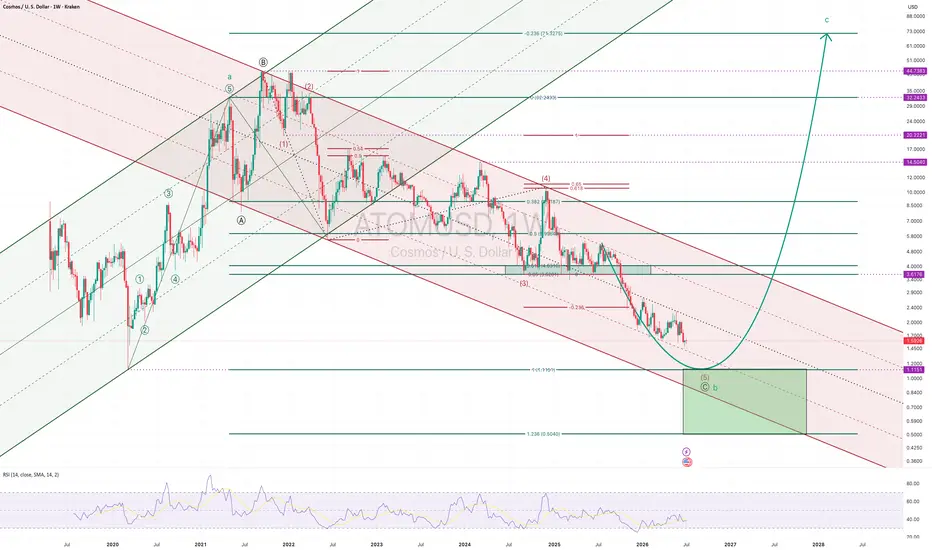
COSMOS [$ATOM] Weekly TF Elliott Wave Crypto Analysis FIB TCATOMUSD – Weekly | Is the Multi-Year Correction Approaching Completion?
Since the 2020 low, ATOM completed a textbook five-wave impulsive advance, peaking at $32.24 in 2021. From an Elliott Wave perspective, I view this entire advance as the larger-degree Wave A/1.
The decline that followed appears to be unfolding as an expanded flat correction:
* Wave A: Three-wave decline from the 2021 high.
* Wave B: Three-wave rally exceeding the origin of Wave A, creating the expanded flat.
* Wave C: Currently developing as a five-wave impulse to the downside.
Price is now progressing through what I count as the final stages of Wave (5) of C, bringing the entire corrective structure close to completion.
The primary support zone lies around the previous cycle low near $1.11, where a potential double bottom could form. However, expanded flats frequently produce deep C waves, so an extension toward the 23.6% Fibonacci extension around $0.50 remains a realistic alternative before the correction is fully exhausted.
Several technical factors are beginning to converge:
• Completion of a five-wave bearish sequence within Wave C.
• Price testing the lower boundary of the long-term descending channel.
• Weekly RSI approaching historically oversold levels.
• Increasingly attractive long-term risk/reward.
If this wave count proves correct, the next major move should be the beginning of a new impulsive advance capable of reclaiming key resistance levels over the coming years. Initial confirmation would come from a decisive recovery above the former support zone around $3.60, while longer-term Fibonacci targets extend considerably higher.
As always, Elliott Wave analysis is based on probabilities rather than certainties. A sustained move below the projected support area would favour the alternate scenario, with Wave C extending toward the $0.50 region before a durable bottom is established.
Current bias: Long-term bearish trend approaching exhaustion, with a high-probability reversal zone developing between $1.11 and $0.50.
Like and follow for more charts like this.
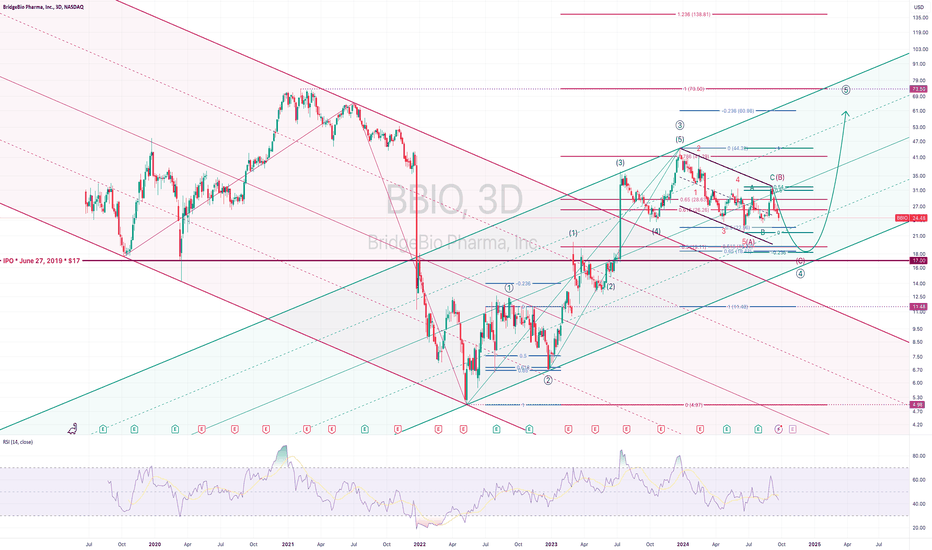
$BBIO * BRIDGEBIO PHARMA TC FIB EWP DAILY TF ANALYSISThe chart is suggesting that NASDAQ:BBIO is in the process of a Wave 4 correction, which should push the price lower in the short term. The correction appears to be reaching support levels near $18 or $17, which could be a good area for a reversal.
If the correction holds these levels, the next move could be a Wave 5 rally, targeting around $61 and above, based on previous wave structures and Fibonacci extensions.
The RSI is not yet in oversold territory, meaning there could still be some downside left in the current corrective wave before a reversal.
The technical analysis indicates a temporary pullback in NASDAQ:BBIO stock, but with strong bullish potential in the medium term, aiming for new highs if the correction finds support around the $17-$18 level. The projected Wave 5 could bring significant upside momentum, potentially reaching up to $73.50
LITECOIN [$LTC] EWP TC FIB ANALYSIS WEEKLY TFLTCUSD – The final shakeout before the next impulsive cycle?
Litecoin continues to respect the larger structural roadmap. Price is now approaching the confluence of long-term channel support, historical horizontal demand, and the projected termination zone of the current Elliott Wave decline.
The primary count still favours the market completing wave (5) of C, ending the entire corrective structure that has been unfolding since the 2021 peak.
What makes this area particularly interesting is the convergence of multiple technical factors:
• Long-term channel support.
• Major horizontal support around the 2017 breakout region.
• Fibonacci confluence.
• Extremely depressed long-term RSI readings.
• Sentiment towards Litecoin close to multi-year lows.
Could price briefly overshoot support? Absolutely. Markets often do. Elliott Wave analysis identifies probability zones—not exact turning points.
If this count remains valid, the reward-to-risk profile improves dramatically as downside potential becomes increasingly limited relative to the upside.
The larger objective remains unchanged: once the corrective structure is complete, Litecoin should begin a new impulsive advance capable of exceeding the 2021 highs. My long-term projection continues to target the ALGO TP near $1,860.
As always, invalidation exists. A sustained breakdown beyond the projected support cluster would require a reassessment of the wave count.
Until then, I continue to view weakness as the final chapter of a much larger accumulation process rather than the beginning of a new secular bear market.
Like and follow for more charts like this.
AUDNZD - WAITING FOR SHORTS1. WEEKLY - We can see rejections and a big engulfing candle
- Price is at a strong resistance level, previously tested as support in 2010 and 2013
(white box)
2. DAILY - We can see CHOCH by price breaking previous lows with multiple bearish candle
- Price is currently pulling back to marked AOI (yellow box)
- Waiting for rejections and engulfing candle at AOI
3. 4HR - Looking for CHOCH at AOI
3. 1HR - Once all confirmations are hit, enter trade and set TP and SL on 4HR TF
NZDJPY - Recovery Meets an Intermediate Supply Zone!NZDJPY continues to respect its long-term bullish structure, with the blue ascending channel guiding price action for an extended period.
The recent rebound from the lower channel support has kept buyers in control, allowing price to push higher toward the next technical obstacle.
⭕Before reaching the upper boundary of the channel, price is now testing a smaller supply zone where sellers may attempt to slow the current advance. If rejection develops, lower timeframes could provide opportunities to look for short setups.
⭕A decisive break above this supply zone would suggest that buyers remain in control, shifting attention toward the upper boundary of the ascending channel, where it aligns with the higher red supply area.
The reaction from this supply zone may provide a better indication of whether the current rally needs a short-term pause, or if buyers are ready to continue pushing toward the next major resistance.
⚠️ Disclaimer: This analysis reflects my personal market view and is not financial advice.
Rayan Nasser
#NZDJPY #NZD #JPY #Forex #TechnicalAnalysis #PriceAction #Trading #MarketStructure
Can Bulls Clear 7555?Hi everyone!🌴☀️
Yesterday I published a detailed SPX analysis where I mentioned:
"Given the current technical structure, I believe the most likely scenario is a continuation toward the all-time high at 7625, provided the U.S.–Iran conflict does not escalate further and instead remains stable or gradually de-escalates."
✅So far, that's exactly what we're seeing, as the market continues to move confidently toward the ATH.
❗️As a follow-up to yesterday's post, I'd like to draw your attention to the market's reaction (highlighted by the red arrows) to the local resistance level at 7555 on the 4H timeframe.
I consider this level to be the key factor in determining the next move.
📈💎If SPX breaks above 7555 and manages to hold that level, clearing the all-time high at 7625 should not be a major challenge. In that case, the path toward the next target at 7950 opens up.
📉🧨However, if price gets rejected at 7555 once again or forms another false breakout, there's a high probability we'll see a move back toward the 7450–7500 area, where the 100 EMA and 200 EMA on the 4H timeframe are currently located.
If those moving averages are broken with strong momentum, the next key support levels become:
🪓 7300 — Local horizontal support.
🪓 7200 — Area of the 100 EMA (1D).
🪓 7000 — Previous ATH.
Peace, everyone! 🌄
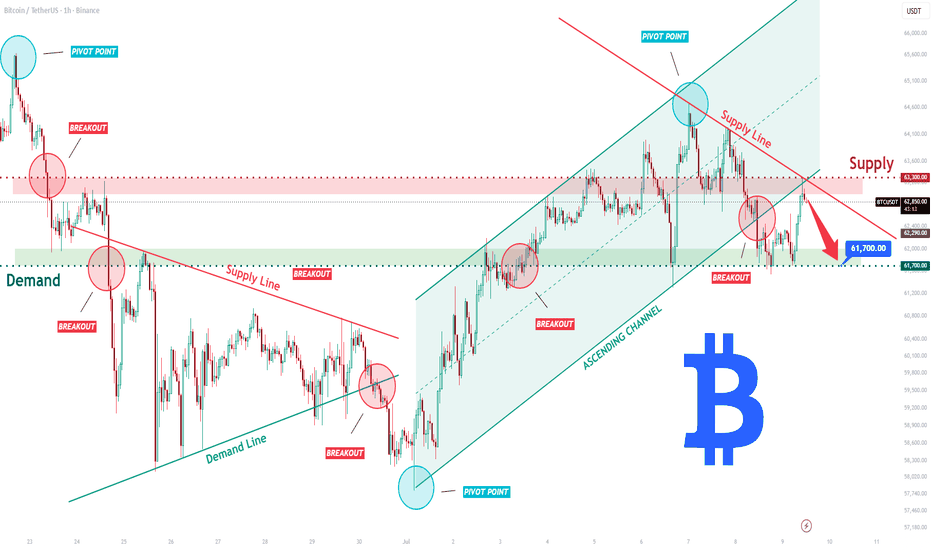
BTCUSDT Short: Rejects Supply Line — 61,7K is the Next TargetHello traders! Here’s my technical outlook based on the current BTCUSDT (1H) chart structure. BTCUSDT previously traded below a descending supply line after breaking down from a key resistance area, confirming bearish momentum. Buyers later pushed price into an ascending channel, but the recovery stalled near the 63,300 Supply Zone and the descending trendline.
Currently, BTCUSDT is trading above the 61,700 Demand Zone while remaining below the 63,300 Supply Zone. The latest rejection from the trendline suggests sellers are regaining control.
As long as BTCUSDT remains below the 63,300 Supply Zone and respects the descending supply line, the bearish scenario remains valid. A continuation lower could push price toward the 61,700 Demand Zone (TP1). Manage your risk!
EURUSD Search Fuel Before Next Move To 1.1470 ResistanceHello traders! Here’s my technical outlook based on the current EURUSD (3H) chart structure. EURUSD previously traded inside a well-defined descending channel after breaking down from an earlier range, confirming strong bearish momentum. Price later broke below the channel support and the 1.1380 Buyer Zone before finding demand and starting a steady recovery with higher lows. Currently, EURUSD is trading above the 1.1380 Buyer Zone while remaining below the 1.1470 Seller Zone. The recent breakout above former support has improved bullish momentum, and price continues to respect an ascending support line, suggesting buyers remain in control. As long as EURUSD holds above the 1.1380 Support Level and respects the rising trendline, the recovery scenario remains valid. A continuation higher could push price toward the 1.1470 Resistance Level (TP1), where sellers may attempt to regain control. Please share this idea with your friends and click "Boost" 🚀
EURUSD: Triangle Resistance Signals Possible Move Toward 1.1380Hello everyone, here is my breakdown of the current EURUSD setup.
Market Analysis
EURUSD previously traded inside a well-defined upward channel before breaking below channel support, confirming a bearish shift in market structure. Price then continued lower inside a descending channel, where sellers maintained control until buyers defended the 1.1380 Support Zone and triggered a recovery.
Currently, EURUSD is trading above the 1.1380 Support Zone while remaining below the 1.1470 Resistance Zone. Price is consolidating inside a symmetrical triangle, with the upper boundary acting as dynamic resistance and limiting further upside.
My Scenario & Strategy
As long as EURUSD remains below the 1.1470 Resistance Zone and continues to respect the triangle resistance line, the bearish scenario remains valid. A rejection from current levels could push price back toward the 1.1380 Support Zone (TP1).
However, if EURUSD breaks above the triangle resistance and secures a move above the 1.1470 Resistance Zone, the bearish outlook would weaken and a stronger bullish continuation could develop.
That’s the setup I’m tracking. Thank you for your attention, and always manage your risk.
XAGUSD 4H: Channel Breakout & Short Squeeze Plan (Long Setup)1. Market Context
On the 4H chart, Silver is currently trading near the upper boundary of a major descending parallel channel. After a deep liquidity sweep at the local bottom where selling pressure exhausted (marked by the "No Buyer" signal near 57.081), the price initiated a strong recovery. It is now consolidating right beneath the critical descending trendline and the key horizontal resistance levels. We are waiting for a confirmed breakout to trigger an explosive upward move.
2. Sentiment & Price Trap Analysis
• The Trendline Seller Trap: Throughout the downtrend, retail traders have aggressively shorted every touch of the upper trendline (marked "Seller"), expecting the bearish structure to hold. This massive retail selling activity has clustered a heavy pool of buy-stop liquidity (stop losses) directly above the trendline and the horizontal resistance zone at 61.606 - 63.377.
• The Breakout Catalyst: A decisive 4H candle close above the trendline (marked "Break Signal") will instantly trap these late sellers. As their buy-stop orders are triggered, the forced liquidation of short positions will act as rocket fuel, accelerating the bullish momentum rapidly.
• The Institutional Support: Strong buying demand is waiting at the lower key support zones (marked "Buyer Wait Here"). These buyers are ready to defend the breakout structure on any potential pullbacks, confirming that the path of least resistance is now to the upside.
3. Trade Setup
We target a high-probability long entry on a confirmed breakout of the descending channel to exploit the trapped sellers' exit momentum.
• Entry: 60.419 (Buying the confirmed breakout close above the trendline / Break Signal)
• Stop Loss (SL): 57.081 (Placed safely below the local accumulation bottom)
• Take Profit (TP): 70.604 (Targeting the major overhead structural resistance zone)
• Risk-to-Reward Ratio (R:R): Approx 3:1
POLKADOT [$DOT] EWP TC FIB ANALYSIS WEEKLY TFPolkadot (DOT) – Expanded Flat (3-3-5) Near Completion?
DOT has been unfolding a textbook Elliott Wave expanded flat since its 2021 peak.
The initial bull market completed with a clear five-wave impulse from $1.45 to $49.82. The marginal new high at $55.18 is not counted as part of that impulse. Instead, it represents Wave B of an expanded flat correction.
The structure is as follows:
* Wave A: $49.82 → $10.38 (3 swings)
* Wave B: $10.38 → $55.18 (3 swings)
* Wave C: $55.18 → 5-wave impulse targeting 63¢
This forms a classic 3-3-5 expanded flat, one of EWP’s most common corrective patterns.
Wave C has respected the long-term descending channel remarkably well and is approaching a strong confluence of support: the lower channel boundary, Fibonacci extensions, and historical price levels all converge around the current region.
If this count is correct, DOT is in the final stages of completing a multi-year corrective structure rather than beginning a new bear market. Confirmation, however, will only come with a clear five-wave advance from the low. Until an impulsive reversal develops, further downside cannot be ruled out.
A completed expanded flat would imply that the correction of the entire advance from $1.45 has ended, opening the door to a new impulsive cycle with the potential to eventually exceed the previous all-time high.
As always, this is an Elliott Wave interpretation, not a prediction. Alternative counts remain valid until the market confirms one scenario over the others.
Like and follow for more charts like this.
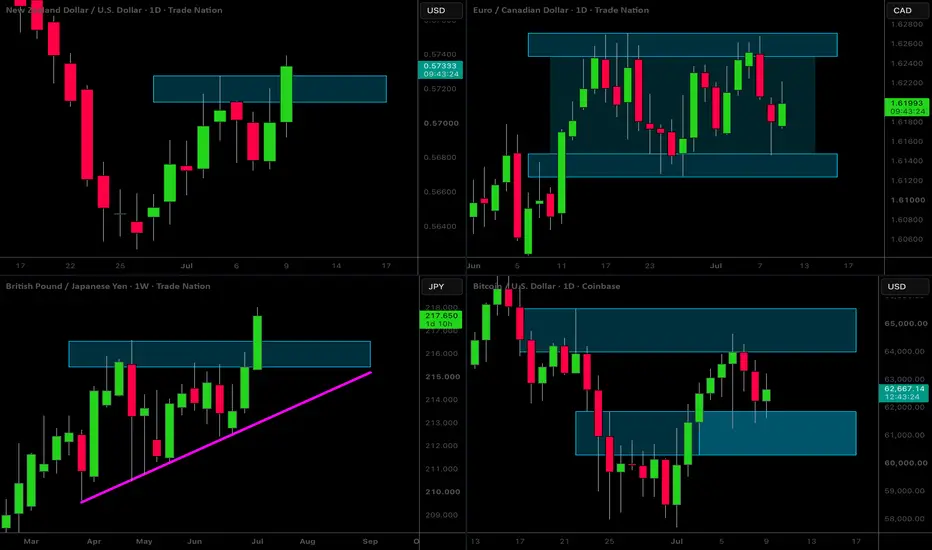
MarketBreakdown | NZDUSD, EURCAD, GBPJPY, BITCOIN
Here are the updates & outlook for multiple instruments in my watch list.
1️⃣ #NZDUSD daily time frame 🇳🇿🇺🇸
The market continues recovering after the extended bearish wave.
We see a breakout attempt of a strong daily resistance.
If the pair closes above that, I will expect a bullish continuation.
2️⃣ #EURCAD daily time frame 🇪🇺🇨🇦
The market is currently consolidating within a horizontal range.
I expect a continuation of sideways price action and a bullish movement from the support of the range to its resistance.
3️⃣ #GBPJPY weekly time frame 🇬🇧🇯🇵
The market continues a new bullish wave, breaking a major resistance cluster.
I will expect a bullish continuation to 219 level after a pullback.
4️⃣ #BITCOIN #BTCUSD daily time frame
The price is coiling between major horizontal resistance and support clusters.
The market will likely pull back from support.
Do you agree with my market breakdown?
❤️Please, support my work with like, thank you!❤️
I am part of Trade Nation's Influencer program and receive a monthly fee for using their TradingView charts in my analysis.
EURUSD Short: Reversal From Supply Zone Puts 1.1360 in FocusHello traders! Here’s my technical outlook based on the current EURUSD (2H) chart structure. EURUSD previously traded inside an ascending channel before breaking below support, confirming a bearish shift. Buyers later attempted a recovery inside a new ascending channel, but the rally stalled near the 1.1440 Supply Zone and the long-term descending trendline.
Currently, EURUSD is trading above the 1.1360 Demand Zone while remaining below the 1.1440 Supply Zone. The latest rejection from the descending trendline suggests sellers are regaining control.
As long as EURUSD remains below the 1.1440 Supply Zone and respects the descending trendline, the bearish scenario remains valid. A continuation lower could push price toward the 1.1360 Demand Zone (TP1). Manage your risk!
EURUSD - Retest of support at 1.143–1.140 before distribution FX:EURUSD is showing early bullish signals. The pair is breaking above the 1.1434 resistance cluster and the descending trendline, opening the door for a potential continuation higher
The latest FOMC minutes did not deliver a clear hawkish message, with markets pricing in only a 25–30% probability of a July rate hike. Meanwhile, the 1.1400 support continues to provide a solid base for a technical rebound. However, renewed geopolitical tensions in the Middle East continue to support the U.S. dollar as a safe-haven asset
The ECB is widely expected to remain on hold in July, while the Fed still retains the option of another rate hike. Technically, the U.S. dollar is showing a limited reaction to recent news and appears vulnerable to a corrective pullback, which could provide additional support for the euro following the false breakout below support and the breakout above consolidation resistance
Resistance levels: 1.1477, 1.1528
Support levels: 1.1434, 1.1400
The pair is also confirming a false breakout below the major weekly (W1) support. The prolonged battle around 1.1400 highlights persistent buying interest. Locally, EURUSD is breaking above the 1.1434 consolidation resistance and the descending corrective trendline. If bulls can hold 1.1434 as new support, the pair could extend its advance toward 1.1478 and 1.1528
Best regards,
R. Linda
U.S. Dollar / Japanese Yen ($USDJPY) Daily: Classical Elliott U.S. Dollar / Japanese Yen ( FX:USDJPY ) Daily: Classical Elliott Wave Matrix – Mapping Wave (4) Correction Toward 158.000 Channel Floor
### 🇺🇸🇯🇵 U.S. Dollar / Japanese Yen ( FX:USDJPY ) Daily Macro Technical Study (Ref: USDJPY_2026-07-09_08-44-48.png)
We are deploying a comprehensive structural and behavioral forecast for the USDJPY currency pair on the Daily (1D) interval. The asset continues to trend within a pristine, high-timeframe ascending channel framework, adhering strictly to classical Elliott Wave structural impulses.
The pair shows minor intraday distribution signatures today, trading down **-0.18% at 162.346**, signaling a local momentum shift near multi-month structural extremes.
---
### 🔍 Elliott Wave Anatomy & Channel Geometry:
Our active systematic model breaks down the current macro sequence across two major technical dimensions:
1. **Wave (3) Apex & Rejection at the 164.000 Ceiling:** The strong, volume-backed impulse sequence has formally completed its **Wave (3)** extension right at the upper red diagonal boundary of the ascending channel. The localized double-top structure and distinct upper wicks printed near the **163.000 – 164.000** supply block confirm heavy institutional profit-taking.
2. **The Wave (4) Correction Path (Target 158.000):** As modeled by our blue tracking vector, price action is entering a necessary corrective phase. We anticipate a controlled mean-reversion decline targeting the **158.000 psychological baseline**. This zone acts as a massive confluence floor, overlapping the primary **ascending channel support line** and sitting just ahead of the macro institutional **200-period EMA (purple line at 156.975)**.
* *Note:* The rising **72-period SMA ribbon (orange line at 159.701)** will act as the first intermediate dynamic cushion during this distribution.
---
### 🚀 Future Outlook: The Wave (5) Impulse Launch
Once the market successfully completes the Wave (4) mitigation phase inside the **158.000 – 159.000** demand cluster, aggregate order flow is mathematically positioned to trigger the final cyclical impulse—**Wave (5)**. This secondary expansion leg will target a definitive breakout above local peaks, driving price action back toward the premium channel limits above **164.000**.
### 📊 Tactical Framework Summary:
* **Immediate Bias:** Bearish Corrective (Wave 4 Development)
* **Core Downside Target:** 158.000 (Channel Floor & Dynamic Confluence)
* **Macro Swing Bias:** Heavily Bullish (Awaiting Wave 5 Accumulation Signatures)
---
📊 **ChartPro Data**
*FX Structural Architecture, Elliott Wave Sourcing & Trend Geometry Matrices.*
⚠️ **Disclaimer:** For educational and informational purposes only. This market study represents a personal trading framework and does not constitute financial or investment advice.
Bitcoin Buyers Stay in Control — Can Bulls Reach 64.8K?Hello traders! Here’s my technical outlook based on the current BTCUSDT (2H) chart structure. BTCUSDT previously traded inside a descending triangle, where repeated rejections from the resistance line confirmed strong selling pressure. After breaking below the 62,500 Buyer Zone, price entered a consolidation range before buyers regained control and launched a strong recovery. Currently, BTCUSDT is trading above the 62,500 Buyer Zone while remaining below the 64,800 Seller Zone. Price has broken above the range and continues to respect a rising support channel, signaling that buyers remain in control in the short term. As long as BTCUSDT holds above the 62,500 Buyer Zone and respects the ascending support line, the bullish scenario remains valid. A continuation higher could push price toward the 64,800 Seller Zone (TP1), where sellers may attempt to regain control. Please share this idea with your friends and click "Boost" 🚀
WTICOUSD 15M: Reclaiming the Trendline & Bear Trap (Long Setup)
1. Market Context
On the 15M chart, WTI has been trading within an ascending channel (blue lines). Recently, the price executed a rapid downswing below the channel support, which quickly turned into a "Fake Break" (Bear Trap) before recovering aggressively and breaking above the major red descending trendline.
2. Sentiment & Price Trap Analysis
• The Bear Trap (Fake Break): The sudden drop below the ascending channel to 70.508 induced breakout traders to open heavy short positions, expecting a collapse toward the lower GAP. Instead, this move served as a sharp stop hunt to clean out weak buyers and trap early shorters at the absolute bottom.
• The Trendline Reclaim & Short Squeeze: The aggressive V-shape recovery immediately reclaimed the ascending channel and forced a clean breakout above the major red descending trendline. The trapped sellers are now holding underwater positions, and their stop losses (buy stops) will act as fuel, accelerating the price toward the upper target at 73.134.
3. Trade Setup
We target a high-probability long entry to ride the squeeze momentum of the trapped sellers.
• Entry Zone: 71.333 - 71.490 (Buying the breakout and trendline reclaim momentum)
• Stop Loss (SL): 70.508 (Placed safely below the Fake Break low)
• Take Profit (TP): 73.134 (Targeting the next structural resistance area)
• Risk-to-Reward Ratio (R:R): Approx 2:1
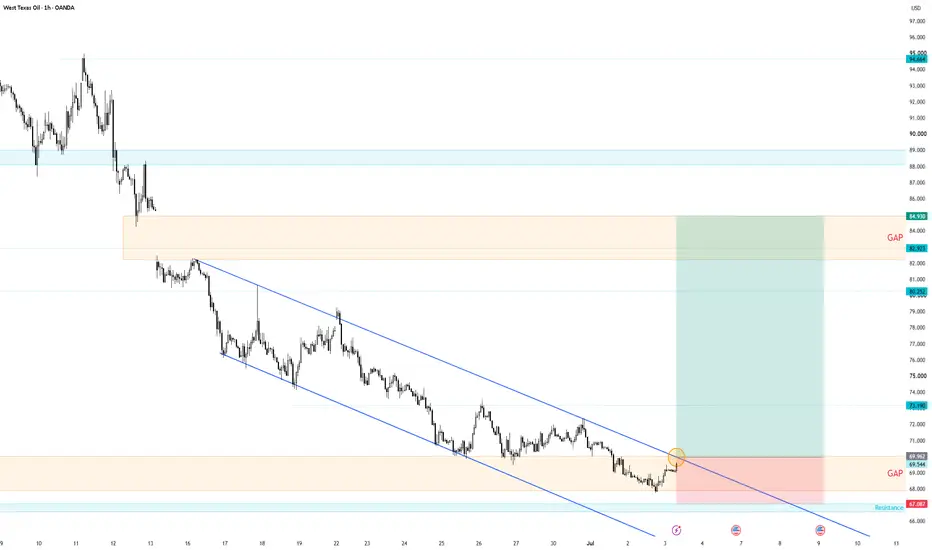
WTICOUSD 1H: Channel Breakout & Massive GAP Fill (Long Setup)1. Market Context
On the 1H chart, Oil has officially broken above the upper boundary of the dominant descending parallel channel that has controlled the price action for weeks. This decisive breakout above the 69.494 - 69.962 zone confirms a structural shift from bearish to bullish, opening the door for an explosive run to fill the massive historical GAP zone resting between 82.923 and 84.930.
2. Sentiment & Price Trap Analysis
• The Trapped Sellers: Throughout the life of the descending channel, retail traders aggressively opened short positions at every touch of the upper trendline resistance. Their stop losses (buy stops) are clustered heavily above the channel boundary, acting as a massive pool of buy liquidity.
• The Short Squeeze Catalyst: As the price breaks and holds above the channel, these sellers are forced into underwater positions. Their capitulation (forced market buy orders to cover short positions) will act as direct rocket fuel, accelerating the bullish momentum upward.
• The Ultimate GAP Magnet: Large institutional orders are sitting in the unfilled GAP zone near 82.923 - 84.930. The market will naturally seek this heavy liquidity pool now that the channel resistance has been completely reclaimed.
3. Trade Setup
We target a high-reward long entry to ride the short squeeze momentum into the massive overhead GAP fill.
• Entry Zone: 69.494 - 69.962 (Buying the confirmed channel breakout)
• Stop Loss (SL): 67.087 (Placed safely below the local consolidation low and major support)
• Take Profit (TP): 84.930 (Targeting the complete fill of the overhead GAP zone)
• Risk-to-Reward Ratio (R:R): Approx 5.3:1
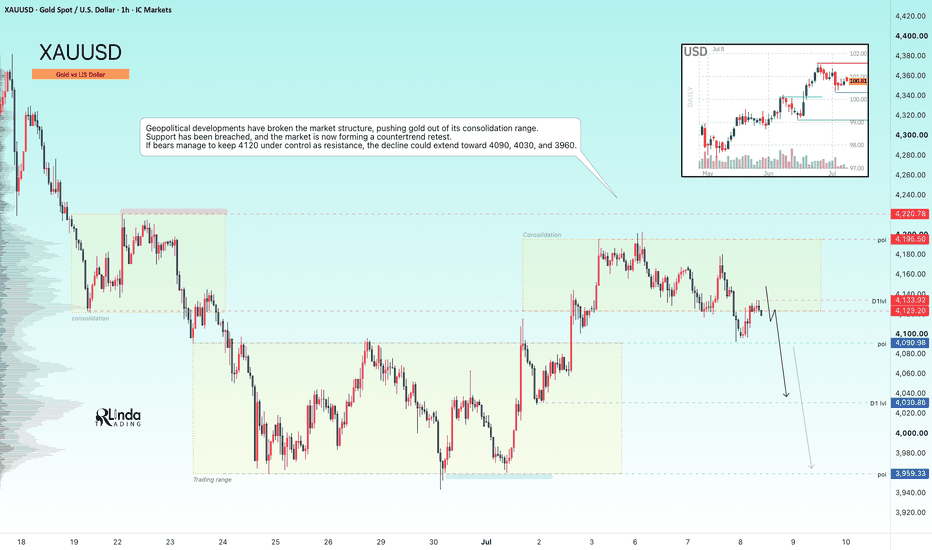
GOLD - Breakdown from consolidation. Bearish pressureFX:XAUUSD failed to extend last week's rally despite the temporary improvement in the fundamental backdrop. Following yesterday's geopolitical escalation, market sentiment has shifted again, putting renewed pressure on the metal
Gold recovered modestly on Wednesday after its recent decline, but gains remain limited by the stronger U.S. dollar. Market attention is now focused on the minutes from the June FOMC meeting, which could provide further clues about the Fed's rate outlook.
Additional pressure comes from renewed tensions between the U.S. and Iran and rising oil prices, both of which have reinforced inflation concerns. As a result, markets have increased the probability of a September Fed rate hike to 63%. Gold's next move will likely depend on both the FOMC minutes and further developments in the Middle East
Resistance levels: 4123, 4133, 4195
Support levels: 4090, 4030, 3960
Technically, after breaking out of its consolidation range, gold is now forming a countertrend correction toward a liquidity zone while producing a false breakout above resistance. Bears are attempting to defend the 4120–4130 resistance area. A consolidation below 4120–4130 could trigger another decline toward 4090, 4030, and 3959, as selling pressure continues to build within both the local and the broader bearish trends
Best regards,
R. Linda