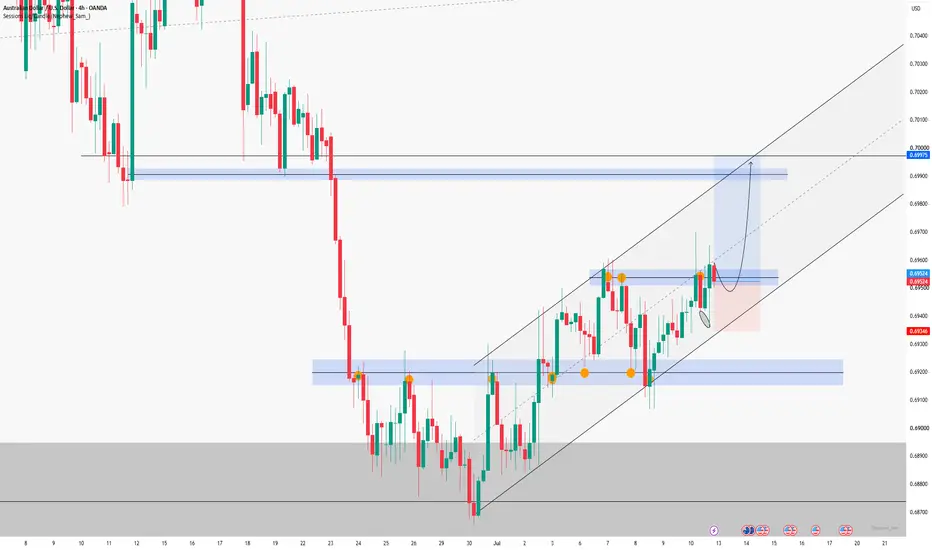
AUDNZD - Bullish Momentum Faces a Critical Test!AUDNZD remains bullish from a broader perspective, but recent price action suggests that bullish momentum is beginning to weaken after the break below the red ascending channel.
Following the rejection from the red supply area, price moved lower and is now testing the lower boundary of the blue channel, where it aligns with an important support area. This creates a technical zone that may attract buyers and is worth monitoring closely.
⭕As long as this support continues to hold, we can start looking for buy setups on lower timeframes, anticipating a bullish reaction from the current area.
⭕However, if price breaks below the lower boundary of the blue channel and the green trigger area, it would provide an important indication that momentum is shifting from bullish to bearish on the daily timeframe, increasing the probability of a deeper correction toward the lower boundary of the broader brown ascending channel.
The reaction around this support may help determine whether buyers can defend the daily bullish structure, or if sellers are beginning to take control, leading to a broader correction within the long-term bullish trend.
⚠️ Disclaimer: This analysis reflects my personal market view and is not financial advice.
Rayan Nasser
#AUDNZD #AUD #NZD #Forex #TechnicalAnalysis #PriceAction #Trading #MarketStructure XAUUSD: Rounding Top Signals Fresh Bearish Pressure Toward 4,030Hello everyone, here is my breakdown of the current XAUUSD setup.
Market Analysis
XAUUSD previously traded inside a broad descending channel after breaking below an earlier triangle support, confirming a bearish market structure. Price later found support near the 4,030 Support Zone, triggering a recovery. However, the rebound formed a Rounding Top pattern beneath the 4,200 Resistance Zone, signaling that buying momentum is fading.
Currently, XAUUSD is trading above the 4,030 Support Zone while remaining below the 4,200 Resistance Zone. Price has rejected the upper boundary of the recovery and continues to trade below the long-term descending channel resistance, keeping sellers in control.
My Scenario & Strategy
As long as XAUUSD remains below the 4,200 Resistance Zone and respects the descending channel resistance, the bearish scenario remains valid. A continuation lower could push price toward the 4,030 Support Zone (TP1).
However, a confirmed breakout above the 4,200 Resistance Zone and the descending trendline would weaken the bearish outlook and favor a stronger bullish recovery.
That’s the setup I’m tracking. Thank you for your attention, and always manage your risk.  Short
Short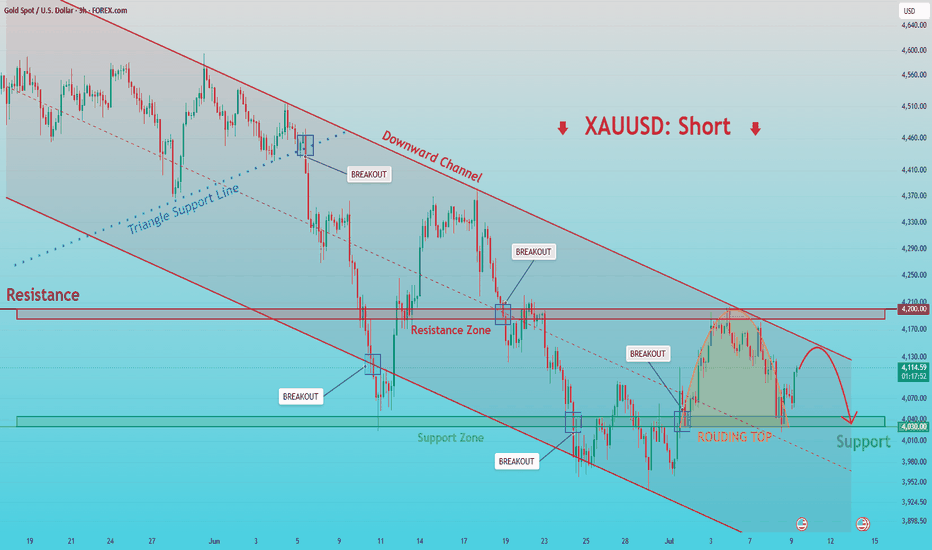
Bitcoin Near Key Resistance – Possible Pullback Toward 62,5K Hello traders! Here’s my technical outlook based on the current BTCUSDT (3H) chart structure. BTCUSDT previously traded inside an ascending channel after recovering from a major selloff. After breaking below the channel support, price lost bullish momentum and entered a wide consolidation range before buyers regained control above the 62,500 Buyer Zone. Currently, BTCUSDT is trading above the 62,500 Buyer Zone while approaching the 64,800 Seller Zone. The recovery is following a rising support trendline, but the major resistance area continues to limit further upside. As long as BTCUSDT remains below the 64,800 Seller Zone, the bearish scenario remains valid. A rejection from current levels could push price back toward the 62,500 Buyer Zone (TP1), where buyers may attempt to defend support. Please share this idea with your friends and click "Boost" 🚀  Short
Short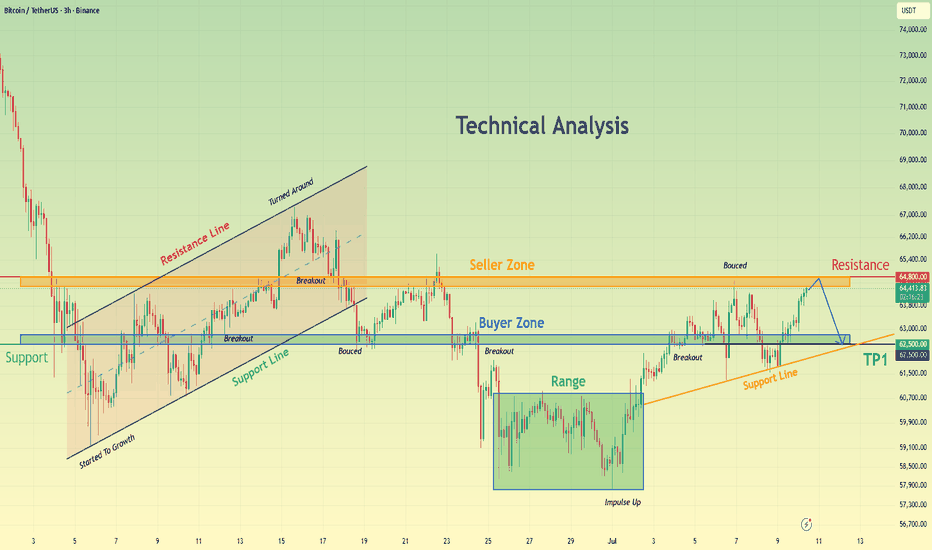
BITCOIN - Retest of the 64,500 liquidity zone BINANCE:BTCUSDT.P remains within the 58,000–67,000 trading range, established as part of the broader bearish trend. Locally, the market is testing the upper boundary of the consolidation zone at 61,000–64,500, with the primary focus now on the resistance area
Bitcoin is currently caught between three major forces: the hawkish FOMC minutes, unstable ETF flows—with outflows resuming after three consecutive days of inflows—and ongoing geopolitical uncertainty. The market still lacks a strong fundamental catalyst. From a medium-term perspective, Bitcoin could decline toward 58K–50K before a potential long-term bottom is formed. The broader trend remains firmly bearish.
Technically, Bitcoin is advancing toward the 64,370–64,690 resistance zone. This move may represent a liquidity grab before another leg lower
Resistance levels: 64,370, 64,690
Support levels: 62,550, 61,300
Bitcoin is forming a countertrend correction into a key resistance zone, which also coincides with the upper boundary of the current trading range and a major liquidity pool. A short squeeze in this area could shift momentum back in favor of the bears, while consolidation below this resistance zone may trigger another decline toward 62,550 or the range support at 61,300
Best regards,
R. Linda Short 
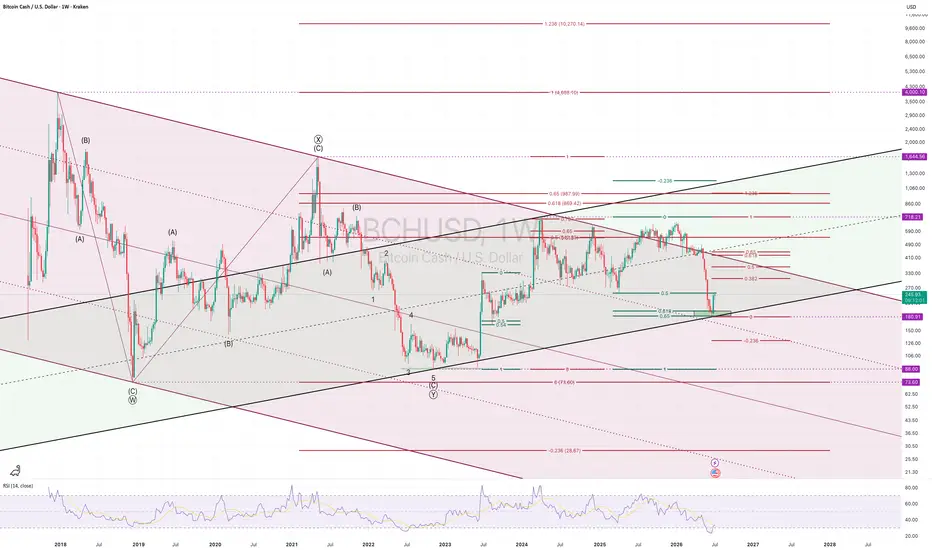
BITCOIN CASH [$BCH] ELLIOTT WAVE CRYPTO ANALYSIS WEEKLY TFNYSE:BCH Bitcoin Cash has arrived at what I consider the most important price level of the entire macro structure.
The recent sell-off found support almost perfectly inside the weekly Golden Zone (GZ) around $180, where several technical factors converge. This area is far more than just another support level—it represents the crossroads that will likely determine the next multi-year direction for BCH.
As long as the weekly Golden Zone continues to hold, my Elliott Wave count remains constructive. The market may still be completing a large corrective structure before beginning the next impulsive advance. If this interpretation proves correct, the long-term target remains the $4,000 region, with an ALGO take-profit objective near $10,270.
However, this bullish outlook still requires confirmation.
The first technical confirmation would be a decisive break above the daily Golden Zone, currently located around $443. Reclaiming that level would strengthen the bullish wave count considerably and suggest that the recent decline has indeed completed its corrective phase.
On the other hand, the current support cannot be lost. A sustained breakdown below the $180 weekly Golden Zone would invalidate my preferred bullish scenario and significantly increase the probability that BCH is still unfolding a much larger bearish structure. In that case, the next major downside objective shifts dramatically towards approximately $28.67.
This is why I believe the current price region deserves close attention. Markets rarely provide such clearly defined technical crossroads where both the bullish and bearish scenarios are so well separated by one critical level.
For now, Bitcoin Cash remains compressed between long-term support and multi-year resistance. The longer this compression persists, the more significant the eventual breakout is likely to become.
As always, Elliott Wave analysis is about probabilities rather than certainties. The market will ultimately determine which path unfolds—but from my perspective, $180 is the line that separates a potential multi-year bull market from the risk of one final capitulation.
Like and follow for more Elliott Wave and macro crypto analysis.
 Long
Long
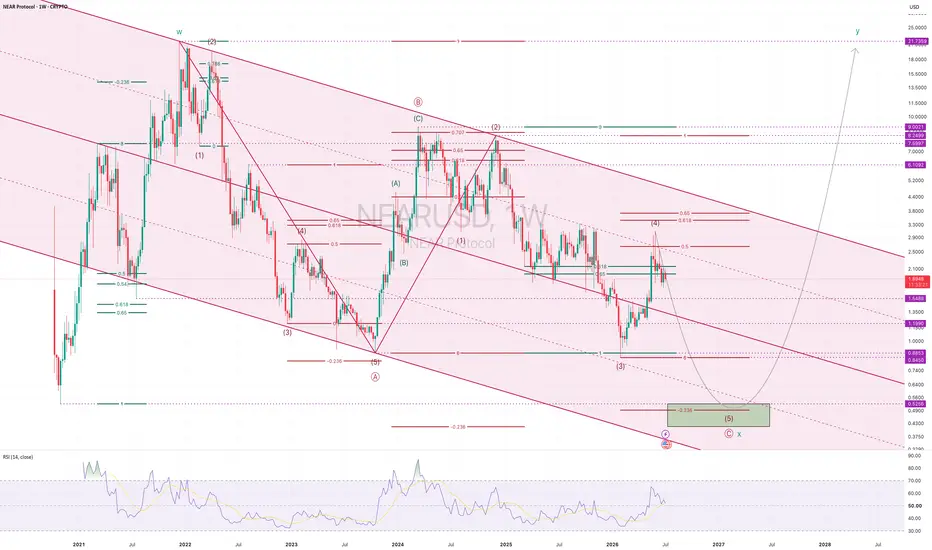
NEAR Protocol [$NEAR] Weekly TF EWP Crypto Analysis FIB TCNEAR PROTOCOL: One More Flush Before the Next Multi-Year Bull Market?
Since peaking during the 2021 bull market, NEAR has, in my view, been developing a large corrective sideways combo rather than a completed bear market. Instead of a simple ABC correction, price has spent years building a complex structure that has consumed both time and price—a hallmark of many mature Elliott Wave corrections.
My preferred count suggests that this macro correction is now entering its final chapter.
The recent recovery appears to be Wave (4) of the last impulsive decline. While this rally has improved sentiment, I believe it is more likely to be a counter-trend move than the beginning of a new secular bull market. If this interpretation is correct, one final Wave (5) should complete the entire corrective structure.
The area between $0.42 and $0.52 stands out as the most attractive accumulation zone. It aligns with the lower boundary of the long-term descending channel, historical support, and Fibonacci confluence. A final capitulation into this region would fit the Elliott Wave principle of ending corrections with maximum pessimism, potentially providing the foundation for the next multi-year advance.
Should Wave (5) complete as anticipated, the entire X wave of the sideways combo would be considered finished. At that point, the focus shifts from surviving the correction to identifying the birth of a new impulsive structure. A confirmed breakout above the multi-year descending trendline would provide the first technical evidence that the macro trend has turned.
From there, the previous all-time high around $22 becomes a realistic long-term objective—not as an immediate target, but as a potential destination over the course of the next primary bull market.
As always, Elliott Wave analysis is a framework of probabilities, not certainties. This is my primary count, and I will adjust it if price action invalidates the structure. Until then, I remain patient and continue to view any final weakness as part of the broader accumulation process rather than a reason to abandon the long-term thesis.
“The market often looks its weakest just before it begins writing its strongest chapter.”
Like and follow for more Elliott Wave and macro crypto analysis.  Long
Long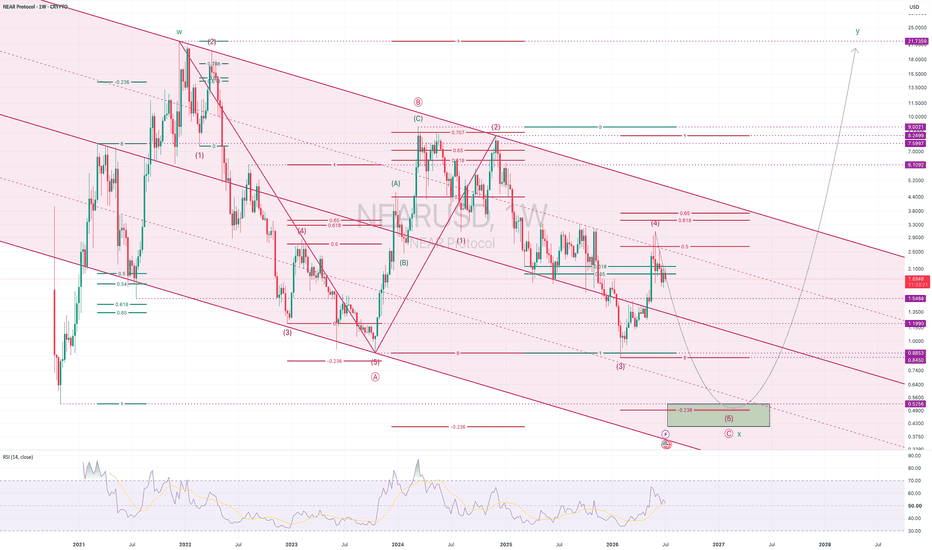
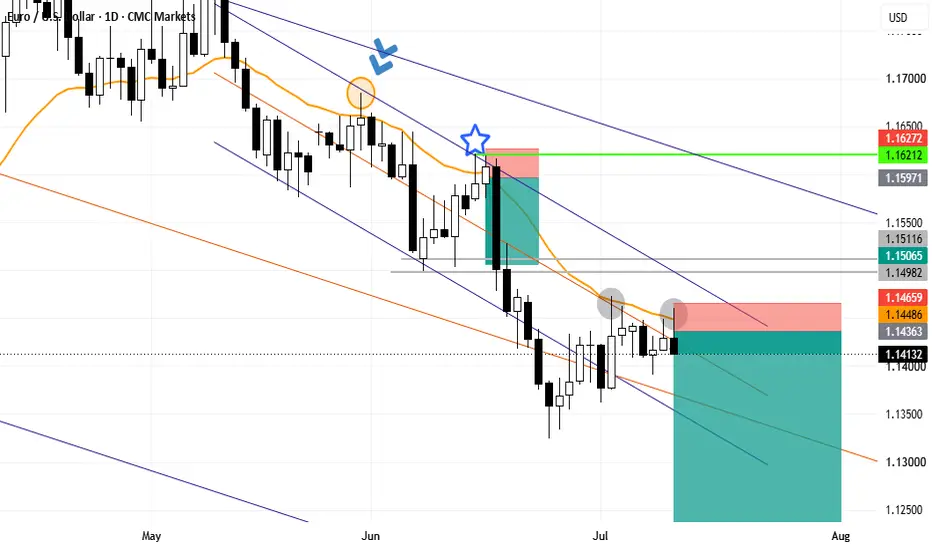
EURUSD: Climbs an Ascending Channel – Can Buyers Extend Rally?Hello everyone, here is my breakdown of the current EURUSD setup.
Market Analysis
EURUSD previously traded inside a range before breaking below support, confirming a bearish shift. After forming a rounding top beneath the long-term descending trendline, price declined into the 1.1400 Support Zone, where buyers stepped in and started a recovery inside an ascending channel.
Currently, EURUSD is trading above the 1.1400 Support Zone while remaining below the 1.1470 Resistance Zone. The recovery continues within the rising channel, with price gradually approaching the key resistance area.
My Scenario & Strategy
As long as EURUSD holds above the 1.1400 Support Zone and respects the ascending channel, the bullish scenario remains valid. A continuation higher could push price toward the 1.1470 Resistance Zone (TP1).
However, if EURUSD breaks below the 1.1400 Support Zone and loses the channel support, the bullish outlook would weaken and sellers could regain control.
That’s the setup I’m tracking. Thank you for your attention, and always manage your risk. Gold Weakens After Channel Breakdown – Watching 4,000$ SupportHello traders! Here’s my technical outlook based on the current XAUUSD (1H) chart structure. XAUUSD previously traded inside a rising channel after reversing from the 4,000 Buyer Zone. The recovery remained constructive until price reached the 4,100 Seller Zone, where strong resistance triggered a rejection and ended the short-term bullish momentum. Currently, XAUUSD is trading below the 4,100 Seller Zone while holding above the 4,000 Buyer Zone. Price has broken below the ascending support line, signaling weakening bullish momentum and increasing the probability of a deeper pullback. As long as XAUUSD remains below the 4,100 Seller Zone, the bearish scenario remains valid. A continuation lower could push price toward the 4,000 Buyer Zone (TP1), where buyers may attempt to regain control. Please share this idea with your friends and click "Boost" 🚀 Short 
 Long
Long
 Long
Long
 Short
Short
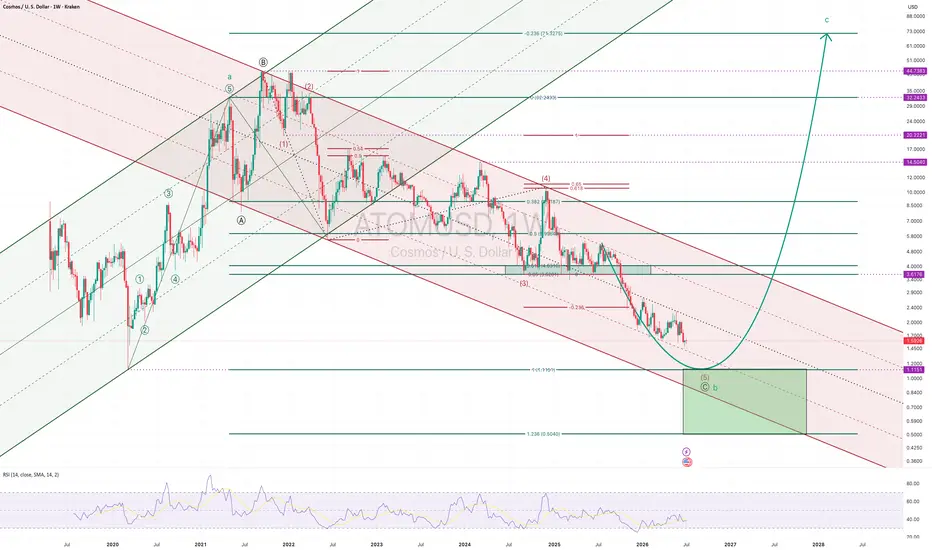
COSMOS [$ATOM] Weekly TF Elliott Wave Crypto Analysis FIB TCATOMUSD – Weekly | Is the Multi-Year Correction Approaching Completion?
Since the 2020 low, ATOM completed a textbook five-wave impulsive advance, peaking at $32.24 in 2021. From an Elliott Wave perspective, I view this entire advance as the larger-degree Wave A/1.
The decline that followed appears to be unfolding as an expanded flat correction:
* Wave A: Three-wave decline from the 2021 high.
* Wave B: Three-wave rally exceeding the origin of Wave A, creating the expanded flat.
* Wave C: Currently developing as a five-wave impulse to the downside.
Price is now progressing through what I count as the final stages of Wave (5) of C, bringing the entire corrective structure close to completion.
The primary support zone lies around the previous cycle low near $1.11, where a potential double bottom could form. However, expanded flats frequently produce deep C waves, so an extension toward the 23.6% Fibonacci extension around $0.50 remains a realistic alternative before the correction is fully exhausted.
Several technical factors are beginning to converge:
• Completion of a five-wave bearish sequence within Wave C.
• Price testing the lower boundary of the long-term descending channel.
• Weekly RSI approaching historically oversold levels.
• Increasingly attractive long-term risk/reward.
If this wave count proves correct, the next major move should be the beginning of a new impulsive advance capable of reclaiming key resistance levels over the coming years. Initial confirmation would come from a decisive recovery above the former support zone around $3.60, while longer-term Fibonacci targets extend considerably higher.
As always, Elliott Wave analysis is based on probabilities rather than certainties. A sustained move below the projected support area would favour the alternate scenario, with Wave C extending toward the $0.50 region before a durable bottom is established.
Current bias: Long-term bearish trend approaching exhaustion, with a high-probability reversal zone developing between $1.11 and $0.50.
Like and follow for more charts like this.
 Long
Long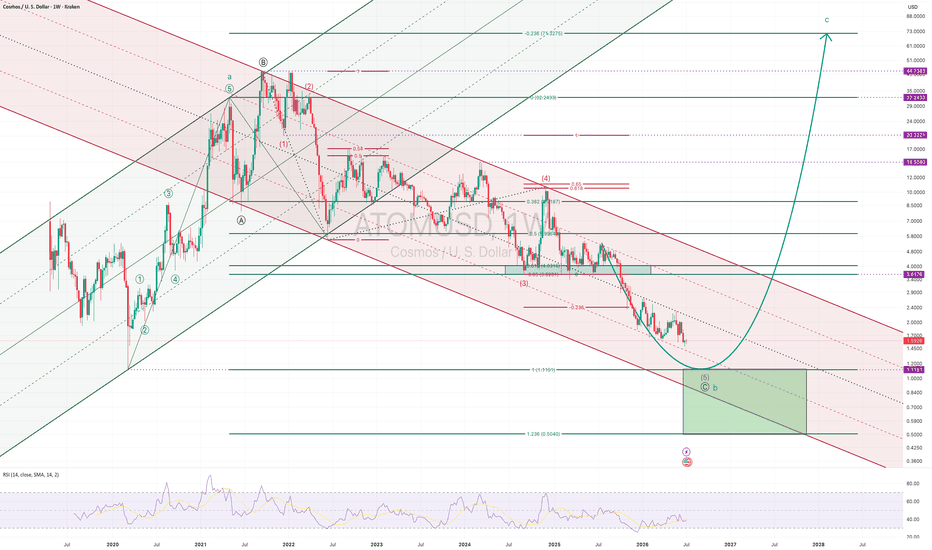
 Long
Long
 Long
Long
Can Bulls Clear 7555?Hi everyone!🌴☀️
Yesterday I published a detailed SPX analysis where I mentioned:
"Given the current technical structure, I believe the most likely scenario is a continuation toward the all-time high at 7625, provided the U.S.–Iran conflict does not escalate further and instead remains stable or gradually de-escalates."
✅So far, that's exactly what we're seeing, as the market continues to move confidently toward the ATH.
❗️As a follow-up to yesterday's post, I'd like to draw your attention to the market's reaction (highlighted by the red arrows) to the local resistance level at 7555 on the 4H timeframe.
I consider this level to be the key factor in determining the next move.
📈💎If SPX breaks above 7555 and manages to hold that level, clearing the all-time high at 7625 should not be a major challenge. In that case, the path toward the next target at 7950 opens up.
📉🧨However, if price gets rejected at 7555 once again or forms another false breakout, there's a high probability we'll see a move back toward the 7450–7500 area, where the 100 EMA and 200 EMA on the 4H timeframe are currently located.
If those moving averages are broken with strong momentum, the next key support levels become:
🪓 7300 — Local horizontal support.
🪓 7200 — Area of the 100 EMA (1D).
🪓 7000 — Previous ATH.
Peace, everyone! 🌄  Long
Long
BTCUSDT Short: Rejects Supply Line — 61,7K is the Next TargetHello traders! Here’s my technical outlook based on the current BTCUSDT (1H) chart structure. BTCUSDT previously traded below a descending supply line after breaking down from a key resistance area, confirming bearish momentum. Buyers later pushed price into an ascending channel, but the recovery stalled near the 63,300 Supply Zone and the descending trendline.
Currently, BTCUSDT is trading above the 61,700 Demand Zone while remaining below the 63,300 Supply Zone. The latest rejection from the trendline suggests sellers are regaining control.
As long as BTCUSDT remains below the 63,300 Supply Zone and respects the descending supply line, the bearish scenario remains valid. A continuation lower could push price toward the 61,700 Demand Zone (TP1). Manage your risk! Short 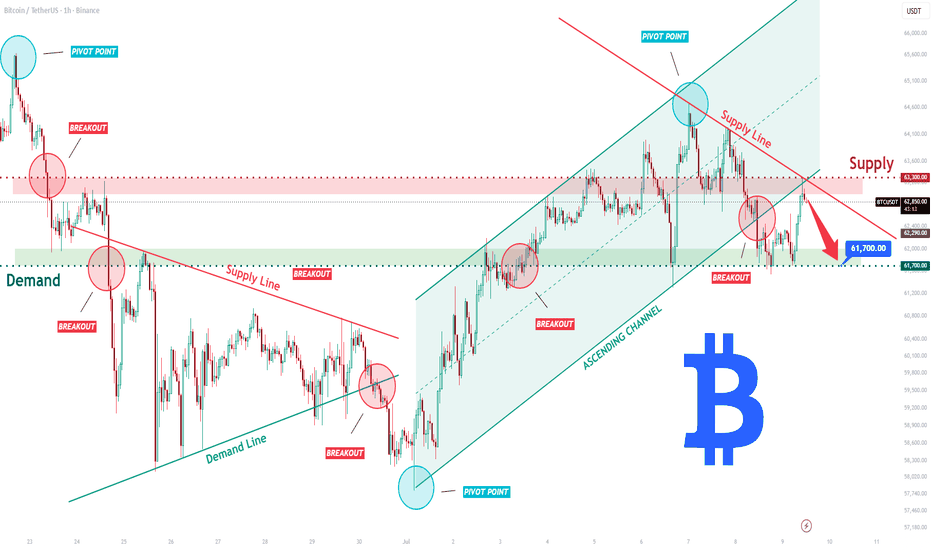
 Long
Long