Broadcom Stock Analysis: How Much Higher Can AVGO Go?Broadcom is still in a long-term uptrend, but the current advance is already at a much later stage.
NASDAQ:AVGO is trading around $365 after reaching almost $500 at the recent high. I still see room for the larger move to continue, although the structure is no longer early. My current Broadcom stock analysis is built around three areas: whether the larger Elliott Wave structure remains incomplete, whether a break above the recent high near $500 can open the path toward $600, and whether a sustained break below $290 would materially weaken the current bullish structure.
The larger Elliott Wave structure still looks incomplete.
A break above the recent high near $500 would keep the path toward $600 open.
A sustained break below $290 would materially weaken the current bullish structure and make me reassess the count.
The long-term structure is still incomplete
On the monthly chart, Broadcom has been moving inside a large rising structure for several years. The advance accelerated significantly during the latest part of the trend, bringing price close to $500 before the current pullback. From an Elliott Wave perspective, I still read the larger advance as incomplete, but the wave relationships also suggest that the current part of the move is already in its final stage. A trend can remain bullish while the amount of remaining upside becomes progressively smaller relative to the advance that has already taken place.
The potential completion area I am using for this part of the structure is roughly $350 to $600, which means Broadcom is already trading inside it. I do not consider the move complete at the current price. The important point is that AVGO has reached a part of the long-term structure where continuation conditions matter more and where I would start paying much closer attention to evidence that the expected correction has begun.
The fundamental picture still supports the larger trend
Broadcom's fundamental picture remains strong enough to support the larger trend. The fundamental dashboard I am using shows revenue growth of roughly 18%, EPS growth of about 30%, and free cash flow growth of approximately 20%. At the same time, valuation is already fairly high, with forward P/E around 21 and forward P/S around 10.9.
There are also risks that become more important at this stage of the advance. Broadcom's five largest end customers accounted for about 45% of revenue during the first two fiscal quarters of 2026, while a large part of current growth is tied to AI infrastructure spending. If large AI deployments slow, Broadcom's growth rate can slow as well. For me, this combination fits the chart reasonably well: the business remains strong, while valuation, customer concentration and the maturity of the technical structure make the current position less straightforward than it was earlier in the trend.
The first important upside test is near $500
The daily chart makes the practical Broadcom technical analysis simpler. AVGO first needs to recover the recent high near $500. If price breaks above that area and can hold above it, I would expect the current advance to continue toward the $600 area. I would place more weight on price establishing itself above the old high than on a brief move through the level followed by an immediate reversal.
That gives me a clear decision map. Below $500, the previous high remains the immediate obstacle. A break above $500 followed by acceptance would shift the focus toward $600. On the downside, $290 is the more important structural boundary because a sustained move below it would change the interpretation rather than simply mark another support test.
Below $500: the previous high remains the immediate obstacle.
Above $500 and holding: the $600 area becomes the next important upside zone.
Below $290 and holding: the current upside continuation scenario becomes substantially weaker.
If Broadcom breaks below $290 and remains below it, my base case would be that the correction I am expecting has already started. At that point I would reassess the current Elliott Wave structure rather than continue treating the existing upside path as the primary scenario.
What I expect after the current advance
Even if Broadcom reaches the upper part of the current completion area, I do not expect the larger move to continue vertically. Once this part of the advance is complete, I expect a correction. The first move down could be sharp, while the broader correction can later become more complicated, move sideways and take considerably more time.
The red path on this chart is schematic. I am not treating every swing or turning point as an exact forecast. The important part is the broader sequence: the current advance completes, the first corrective leg can be sharp, and the larger correction can later develop sideways with strong countertrend recoveries. After that correction is complete, the larger structure would still support another major move higher.
The current advance completes.
The first corrective leg can be sharp.
The broader correction can later become sideways.
After the correction is complete, the larger structure would still support another major advance.
That last point is important for the long-term AVGO outlook because my Elliott Wave interpretation does not end the entire Broadcom bull structure with the current move. I expect a meaningful correction after this stage, but the larger count can still allow another major advance once that correction has completed.
The levels that would change my view
For now, my Broadcom technical analysis remains constructive while the larger structure stays intact. The two main levels are straightforward: a break above $500 followed by a hold above it would keep continuation toward the $600 area as my preferred path, while a sustained break below $290 would materially weaken the current upside scenario and make it more likely that the expected correction has already started.
Above $500 and holding: continuation toward the $600 area becomes my preferred path.
Below $290 and holding: the current upside scenario weakens materially and I would reassess the structure.
Broadcom has already completed a very large part of this long-term advance. I still do not consider the current move finished, but I also would not read the chart as an early-stage trend anymore. That is why the next move around $500 matters more to me than simply extrapolating the previous rally. If $500 breaks and price holds above it, I would continue to follow the move toward $600. If $290 breaks and price remains below it, I will reassess the current Elliott Wave structure and update the Broadcom analysis.  Long
Long

GBPCAD: Bearish Drop to 1.85000?FX:GBPCAD is eyeing a bearish continuation on the 4-hour chart within the descending channel, with price approaching a clear resistance zone near the 0.786 Fibonacci level after recent recovery, converging with a potential entry area that could trigger further downside momentum if sellers defend amid volatility. This setup suggests a solid pullback opportunity toward the lower support zone with near 1:3.5 risk-reward .🔥
Entry between 1.88200–1.88500 (entry from current price with proper risk management is recommended). Target at 1.85000 . Set a stop loss at a daily close above 1.89130 , yielding a risk-reward ratio of near 1:3.5 . Monitor for confirmation via a bearish candle close below entry with rising volume.🌟
** Fundamentally **, GBPCAD is trading around 1.8717 on Friday, September 11, 2026.
For the **British Pound**, the most important releases today are the ** UK GDP m/m (July) ** along with Industrial Production and Goods Trade Balance data.
For the **Canadian Dollar**, high-impact data is limited today (major Canadian CPI is scheduled for next week), so markets are mainly monitoring the spillover from the US CPI release and broader risk sentiment. 💡
📝 Trade Setup
🎯 Entry (Short):
1.88200 – 1.88500
(Entry from current price is acceptable with proper position sizing and strict risk management.)
🎯 Target:
1.85000
❌ Stop Loss:
Daily close above 1.89130
📉 Risk-to-Reward:
Near 1:3.5
Will sellers defend 1.88200–1.88500 and push GBPCAD toward 1.85000, or will buyers break the resistance zone and invalidate the bearish setup? 👇
XAUUSD Short: Descending Trend Line Keeps Bears in ControlHello traders! Here’s my technical outlook based on the current XAUUSD (3H) chart structure. XAUUSD previously traded inside a descending channel before breaking above the structure and shifting bullish. Price then formed a range and rallied toward the 4,440 Supply Zone, where sellers rejected the upside.
Currently, XAUUSD is trading below the 4,440 Supply Zone while holding above the 4,300 Demand Zone. The Rounding Top and recent rejection suggest a possible continuation lower toward demand.
As long as XAUUSD remains below the 4,440 Supply Zone and respects the descending Trend Line, the bearish scenario remains valid. A continuation lower could push price toward the 4,300 Demand Zone (TP1). However, a breakout and close above 4,440 would weaken the bearish outlook and increase the possibility of further upside. Manage your risk!  Short
Short
Bitcoin Analysis - Triangle Pattern Lead to an Upward Momentum?Hello traders! Here’s my technical outlook based on the current BTCUSDT (2H) chart structure. BTCUSDT previously broke higher from a range with a strong impulse up, shifting bullish within an ascending channel. Price then rallied toward the 81,000 Seller Zone, where it faced resistance before pulling back and bouncing from the Buyer Zone and Support Line. Currently, BTCUSDT is trading below the 81,000 Seller Zone while holding above the 77,500 Buyer Zone and ascending Support Line. The recent bounce from support suggests buyers are preparing for another attempt higher. As long as BTCUSDT remains above the 77,500 Buyer Zone and respects the ascending Support Line, the bullish scenario remains valid. A continuation higher could push price toward the 81,000 Seller Zone (TP1). However, a breakdown and close below the Buyer Zone would weaken the bullish outlook and increase the possibility of further downside. Please share this idea with your friends and click "Boost" 🚀  Long
Long
GOLD - A Hunt for Liquidity Ahead of Further DeclinesICMARKETS:XAUUSD has been forming a countertrend correction since the session opened. The fundamental backdrop remains unstable, and this correction could end with another move lower
Gold remains exposed to two-sided risks ahead of the release of U.S. CPI data. The sell-the-bounce strategy remains in place, especially against the backdrop of higher-than-expected inflation in China. TD Securities expects core inflation to remain under control in August but warns of upside risks
Drivers:
Upside: weak U.S. CPI data, dollar weakness, de-escalation of the conflict.
Downside: hot CPI data, dollar strength, escalation of the conflict, hawkish Fed rhetoric
Resistance levels: 4,410, 4,435, 4,461
Support levels: 4,365, 4,287
A weaker dollar, driven by yen strength, is supporting gold. At the same time, however, gold remains under pressure from the Fed’s hawkish stance and geopolitical risks.
Technically, I expect a short squeeze around the 4,430–4,435 liquidity zone, followed by a decline toward range support at 4,365–4,287
Best regards,
R. Linda! Short 
Gold Bullish Structure Remains Valid Above Key Buyer ZoneHello traders! Here’s my technical outlook based on the current XAUUSD (4H) chart structure. XAUUSD previously formed a Double Bottom and broke higher, shifting bullish within an ascending channel. Price then rallied toward the 4,520 Seller Zone, where it faced resistance before pulling back and bouncing from the Buyer Zone and Support Line. Currently, XAUUSD is trading below the 4,520 Seller Zone while holding above the 4,370 Buyer Zone and ascending Support Line. The recent bounce from support suggests buyers are preparing for another attempt higher. As long as XAUUSD remains above the 4,370 Buyer Zone and respects the ascending Support Line, the bullish scenario remains valid. A continuation higher could push price toward the 4,520 Seller Zone (TP1). However, a breakdown and close below the Buyer Zone would weaken the bullish outlook and increase the possibility of further downside. Please share this idea with your friends and click "Boost" 🚀 Long 
JPN225: Triangle broken, Trade in profit what comes next?In this video is the update to the Nikkei 225 trade idea from 3 September 2026, when Japan’s 10-year bond yield surpassed 3% for the first time since 1996 and the index dropped by 2.85% to its lowest levels in four weeks at 64,325. Entry: 63,000-64,274. Descending triangle was the formation and the contracting MACD histogram which was deep into the negative zone was the trigger;the exact setup that called for the best week for the Hang Seng since March 2025. On 4 September Softbank and AI semiconductor stocks jumped 806 points. On 7 September, thanks to Kioxia and SoftBank the index increased by 2.12% to 66,399. Descending triangle has been violated to the upside and the trade is now making money. However, the chart has formed a new symmetrical triangle inside the rebound phase, and in this video I will show you exactly where this triangle is, where the breakout level is, where the trailing stop now stands, and why 66,250 is the next target level. Whether you trade indices or want to learn how patterns develop during the recovery, this video is for you.  Long
Long

7625: The Durability Test)Hey traders! 🦬🐻🏋🏽
In my last post, I warned you about a possible reversal 🔪🐻 around 7777 on the approach from below:
«Take a look at how many times price has been rejected from the 7777 level since August 5. The resistance here is clearly significant, and there are no guarantees that this attempt will be the one where we finally see a genuine breakout and acceptance above the level.
If price gets rejected once again, the initiative could shift back to the bears, with a high probability of another move toward 7625 — similar to what we saw from August 28 to September 1.»
The reversal did indeed happen around 7777 ✅, and the following scenario played out almost perfectly, with price touching 7625 ✅🎯 during yesterday’s trading session.
What’s happening on the chart right now?
The 7625–7777 range identified in my previous posts remains relevant 📉📈
Additionally, we can now identify a local descending parallel channel, so we’ll also be watching how price reacts to its boundaries.
The scenarios remain unchanged.
🦬🚀Bullish scenario.
A breakout and acceptance above 7777 would open the way toward the previous ATH at 7822, followed by the measured move target at 7950.
🐻🪓Bearish scenario.
If the bears manage to push price below 7625, we could see a drop toward 7555.
And this is where the bears will really have to work, because 7555 is a concrete wall — price has repeatedly slowed down around this level when approaching it from below.
Peace! 🌄
⚠️ Disclaimer:
All information shared on this channel is for educational and informational purposes only and is not investment advice. The author is not responsible for your trading decisions. Always manage your risk and make decisions independently.  Long
Long
CADCHF: Bullish Push to 0.6000?FX:CADCHF is eyeing a bullish continuation on the 4-hour chart within the ascending channel, with price approaching a key support zone after recent consolidation, converging with a potential entry area that could ignite further upside momentum toward the higher resistance zone near the 0.786 Fibonacci level if buyers defend amid volatility. This setup suggests a solid rally opportunity with more than 1:2.5 risk-reward .🔥
Entry between 0.5843–0.5862 (entry from current price with proper risk management is recommended). Target at 0.6000 . Set a stop loss at a daily close below 0.5810 , yielding a risk-reward ratio of more than 1:2.5 . Monitor for confirmation via a bullish candle close above entry with rising volume.🌟
Fundamentally , CADCHF is trading around 0.5875 in early September 2026.
For the Canadian Dollar, high-impact data is limited in the remaining days of this week (8–11 September), with markets mainly monitoring broader risk sentiment and secondary releases.
For the Swiss Franc, a notable release is the SECO Consumer Climate on Friday , September 11, which provides insight into Swiss consumer sentiment. 💡
📝 Trade Setup
🎯 Entry (Long):
0.5843 – 0.5862
(Entry from current price is acceptable with proper position sizing and strict risk management.)
🎯 Target:
0.6000
❌ Stop Loss:
Daily close below 0.5810
📈 Risk-to-Reward:
More than 1:2.5
Will buyers defend the 0.5843–0.5862 support zone and push CADCHF toward 0.6000, or will the ascending channel support fail and invalidate the bullish setup? 👇 Bitcoin Intraday Channel Analysis: Is $84,000 Next ? Bitcoin price action on the intraday timeframe is currently trading within a descending channel, with both the upper and lower boundaries having been tested and rejected on multiple occasions. These repeated interactions with support and resistance provide greater definition to the channel structure and make the boundaries important levels to monitor.
Price is currently approaching the lower channel support. If this region continues to hold, BTC could potentially attempt to recover toward the liquidity area above $82,000. A sustained move through this level could increase the probability of a broader intraday recovery toward the channel’s upper boundary, situated around $84,000.
However, the reaction at channel support remains important. If price fails to maintain this area, the current channel structure could weaken and increase the probability of a deeper corrective move on the intraday timeframe. This would also reduce the likelihood of an immediate move toward the upper channel boundary.
Overall, the descending channel continues to define the current intraday market structure. Traders can monitor the response around channel support, the $82,000 liquidity region, and the $84,000 channel resistance for further confirmation of the next directional move. Neither scenario is confirmed until price establishes a sustained move beyond the relevant levels.
----------------------------------------------------------------------------------------------
Don't invest unless you're prepared to lose all the money you invest. This is a high-risk investment and you should not expect to be protected if something goes wrong. Take 2 mins to learn more: coinjar.com/uk/risk-summary
The article is an opinion expressed by the author at a point in time and does not represent the views of CoinJar UK Limited or CoinJar Australia Pty Ltd. Take care to consider the date of this article and be aware that this opinion is based on circumstances at the time of publishing. No responsibility or liability is accepted for any errors of fact or omission expressed therein. Past performance is not a reliable indicator of future results.
This above article is not to be read as investment, legal or tax advice and it takes no account of particular personal or market circumstances; all readers should seek independent investment advice before investing in cryptocurrencies.
We recommend you obtain financial advice before making a decision to use your credit card to purchase cryptoassets or to invest in cryptoassets.In the UK, it's legal to buy, hold, and trade crypto, however cryptocurrency is not regulated in the UK. It's vital to understand that once your money is in the crypto ecosystem, there are no rules to protect it, unlike with regular investments.
You should not expect to be protected if something goes wrong. So, if you make any crypto-related investments, you're unlikely to have recourse to the Financial Services Compensation Scheme (FSCS) or the Financial Ombudsman Service (FOS) if something goes wrong.
----------------------------------------------------------------------------------------------
Warning: If you invest in this product, you may lose some, or all, of the money you invest. The value of crypto-assets may rise or fall rapidly. Past performance is not indicative of future results. To learn more see our Risk Disclosures.
CoinJar Europe Limited is authorised by the Central Bank of Ireland as a crypto-asset service provider (registration number C496731).
---------------------------------------------------------------------------------------------- My view on Intel Stock: Going against the crowd (#INTC)NASDAQ:INTC
While most market participants react blindly to the initial impulse, believing in an immediate and sharp reversal to the upside, I prefer to look deeper into market mechanics. My view contrasts sharply with the crowd: I believe it is way too early to celebrate this local bounce in Intel shares, and the technical structure clearly points to another wave of downside.
On the daily timeframe, a well-defined descending channel is unfolding. From above, price is facing heavy pressure from a dynamic resistance block consisting of the 50-day and 100-day moving averages, which have recently formed a bearish cross. This factor serves as a major psychological barrier for buyers. Any attempts to rally from current levels will be heavily capped by profit-taking within the channel, as retail demand simply lacks the strength to break this block without institutional backing.
The path of least resistance for the price right now is downward. The primary target for this move is the $70–$74 range, where a key technical confluence zone is forming. This is exactly where the long-term 200-day moving average has caught up. However, the core of my thesis lies much deeper than simple lines on a chart.
Just below, in the $65 area , lies a massive April imbalance accompanied by colossal horizontal volume profiles. To me, it is obvious that the primary position of smart money is accumulated right there. Large institutional players think in terms of liquidity: they will not add to their positions at current prices alongside the retail crowd. The price will move down not for the sake of "filling the gap," but because a large buyer will intentionally push the market into the $70 zone to trigger a massive sweep of early long stops.
Only after this harsh shakeout—when the crowd finally capitulates and panics into selling at the absolute bottom—will smart money absorb these sell orders into their limit bins. As soon as this high-volume accumulation process is complete, the true institutional reversal will begin. It is exactly within this $70–$74 range that I will be looking for signs of selling exhaustion to enter the market at the most favorable price, targeting long-term goals at $143 and $220. Trading off institutional liquidity rather than retail emotion is the only safe way to approach this chart.
This publication is for analytical purposes only and does not constitute individual investment advice. Share your thoughts in the comments and don't forget to support the idea with a like if you found the analysis useful! Satoshi Frame | PUMP Key Resistance Watch🦉 Welcome To SatoshiFrame Tradingview Channel.
⛳️ Lets dive into a PUMPFUN analysis.
📉 PUMP on the 4H timeframe has completed a correction down to the 61.8% Fibonacci retracement level, where it found support around $0.003824.
⛏️ Following the recent correction, PUMP has been trading inside a descending channel. After breaking above the channel’s midline, the price formed a higher low compared to its key support zone.
↗️ If the price successfully breaks the 4H resistance at $0.004538, while also breaking above the upper boundary of the descending channel with increasing buying volume, it could continue toward the next major resistance level, which is a weekly resistance zone.
🎯 The confirmations we can look for before activating the current setup include an increase in buying volume, an RSI breakout above the 64.36 level, and the structure and strength of the breakout candle.
🧲 On the other hand, if the price gets rejected from the current resistance and selling pressure pushes it back toward the weekly support at $0.003824, losing this support could trigger a deeper correction for PUMP.
⚠️ Risk management and capital management are essential in trading. Always trade based on your own strategy and risk tolerance. Every trading decision and its outcome are entirely your own responsibility.  Long
Long
$PATH (UiPath): The Post-Earnings Flush | A Structural Play
If you have been watching PATH after its latest Q2 earnings report, the chart looks brutal. After grinding its way up toward the $19 level, the stock suffered a massive gap down, currently sitting around the $14.00 zone as seen on the daily chart.
But when you strip away the immediate market panic and look at the actual numbers, this sell-off smells like a classic overreaction. Here is the fundamental thesis and the technical game plan for why NYSE:PATH is flashing a prime accumulation opportunity.
The Fundamental Thesis: The AI Transition is Working
The market aggressively punished the stock (dropping over 16%) primarily due to modest ARR guidance and a soft Q3 outlook. Management noted longer decision-making cycles as enterprises evaluate their mix of deterministic and AI-driven automation. Persistent attrition among smaller customers also contributed to the negative sentiment.
But under the hood, the core enterprise business is thriving and deeply embedded:
Top-Line Beat: UiPath delivered Q2 revenue of $410.3 million (up 13.4% YoY), comfortably beating analyst estimates of $397.9 million. Adjusted earnings also hit expectations at $0.15 per share.
Enterprise Growth: The big fish are scaling. Customers generating over $1 million in Annual Recurring Revenue (ARR) grew by 21% to 387.
AI & Cloud Adoption: This is the most crucial structural metric—Cloud ARR surged 19% YoY to approximately $1.3 billion, and 18 of their top 20 deals actively included AI integration.
The transition to agentic AI is causing temporary friction in sales cycles, but UiPath is successfully embedding itself into massive corporate infrastructures. Management even slightly lifted their full-year revenue guidance to a midpoint of $1.79 billion. The underlying fundamentals do not justify this violent markdown.
The Technical Setup: The Value Zone
Looking at the Daily chart, the mechanics of this drop give us a clear roadmap:
The Liquidity Flush: The harsh gap down wiped out months of gradual retail accumulation. However, this $13.50 - $14.00 zone has historically acted as a major structural floor before the massive rally earlier this year.
The Gap Magnet: Markets abhor a vacuum. The huge gap left behind on the daily chart stretching up toward $17.00 provides a highly visible liquidity magnet once the institutional absorption is complete.
Washout Phase: The initial panic selling is exhausting. We are now hunting for the transition from distribution to quiet accumulation.
The Execution Playbook (Cold-Blooded)
We do not catch falling knives blindly, even with a strong fundamental thesis. Here is how you position like a professional:
1. Wait for Stabilization: Let the dust settle. Do not buy the middle of a collapsing daily red candle. We want to see the daily candles compress, lower wicks form, and a solid structural floor build near this $14.00 level.
2. The LTF Trigger: Drop down to the 15-minute chart for execution. Wait for a volume surge that signals absorption, followed by a period of stabilization. Your trigger is a clean 2-bar streak of bullish confirmation. That is the signal that smart money is done pushing the price down.
3. Averaging & Risk: Deploy your first tranche on that LTF confirmation. Set a strict, leverage-adjusted Stop Loss below the macro historical lows (the $10.00 - $11.00 zone). If that level breaks, you cut the trade instantly with zero emotion. As the daily chart establishes a confirmed Market Structure Break (MSB) to the upside, pyramid into your winning position on the higher lows to maximize your size for the gap fill.
The market is pricing in panic over delayed sales cycles, but the $1M+ enterprise ARR metrics tell a story of dominant growth. Let the technical structure confirm the bottom, manage your risk, and wait for the squeeze.
Are you buying the fear on NYSE:PATH , or waiting for lower levels? Let me know your accumulation zones in the comments below! 👇
Disclaimer: This analysis is for educational purposes for the finance trading community. It is not financial advice. Always trade your own plan and manage your risk strictly.  Long
Long
GOLD - The market is under pressure from a bearish trend ICMARKETS:XAUUSD remains in a local bearish trend, while consolidation below the 4,435 liquidity zone is becoming a technical catalyst for further downside
The dollar is stagnating, but at the same time, it is weakening due to interventions by the Bank of Japan. Gold looks weak against this backdrop, especially given the Fed’s medium-term hawkish stance. Geopolitical risks and inflation expectations that could limit further upside remain in place. The key event of the week will be the U.S. inflation data on Friday, which will determine the next direction.
Drivers:
Upside for gold: further dollar weakness, a stronger yen, weak U.S. CPI data.
Downside for gold: dollar strength, hawkish Fed rhetoric, rising geopolitical tensions (supporting oil and the dollar), strong CPI data
Resistance levels: 4,435, 4,461, 4,490
Support levels: 4,365, 4,320, 4,290
Gold remains under pressure from a weak fundamental backdrop and the local bearish trend. A short squeeze around the liquidity zone is triggering further downside. I do not rule out a retest of local resistance before another decline toward 4,365–4,290
Best regards, R. Linda! Short 
BMW - TECHNICAL ANALYSIS MONTHLY TF EWP FIB TCBMW – Long-Term Monthly Structure Approaching a Critical Decision Zone
BMW’s monthly chart shows a remarkably well-defined long-term ascending structure extending back to the late 1980s. Despite several major corrections over nearly four decades, price has repeatedly respected the broader rising channel and its internal parallel trend lines.
The most important feature of the current setup is the convergence of long-term support around the €56–57 area.
Below the present price, the larger Fibonacci structure places the 0.382 retracement at €56.64, almost exactly at the major horizontal level marked at €56.40. That creates a very clear technical confluence rather than an arbitrary support assumption. This makes the area around €56.40–€56.64 the key level I am watching.
From an Elliott Wave perspective, the current decline can still be interpreted as a corrective movement within the larger secular advance, provided the long-term channel structure remains intact.
If that zone holds, the long-term bullish channel remains structurally intact and BMW would have the possibility of beginning another advance within the broader secular trend. The major resistance above remains the €123.75 zone marked by the previous long-term top.
A break above that level would be technically significant because it would represent a breakout from the major resistance that has capped BMW for more than a decade. The larger Fibonacci projection shown on the chart then places the next major extension around €200.50.
The downside is equally important. If BMW loses the €56 area decisively on a monthly basis, the next major Fibonacci levels on the chart are approximately €44.60 at the HWB, followed by €34.95 at the GZ. The separate horizontal support marked at €36.60 creates another important support cluster within that region.
That means the chart essentially presents two major long-term decision areas:
€56.50 is the first and currently most important support zone.
If that fails, the broader €35 region becomes the next major technical area.
The monthly RSI is currently in the lower half of its range, reflecting the weakness of the latest decline, but it is not yet deeply oversold. In other words, RSI by itself does not provide evidence that the correction has necessarily finished. Price behaviour at the support levels therefore matters more than trying to call an exact bottom from momentum alone.
What makes this setup particularly interesting is the scale of the chart. This is not a short-term trade based on a few candles. It is a test of a price structure that has developed over several decades. As long as the secular ascending channel survives, the long-term bullish structure remains valid. For me, therefore, the decisive question is not whether BMW looks “cheap” at €60 or whether the next candle is green or red.
The question is: Does BMW defend €56.40–€56.64 and remain inside its almost four-decade-long ascending structure? If the answer is yes, the risk/reward profile begins to become increasingly interesting. If the answer is no, the chart already identifies the next major long-term support area: roughly €33–€37.
Not financial advice. Like and follow for more Elliott Wave and macro technical analysis.  Long
Long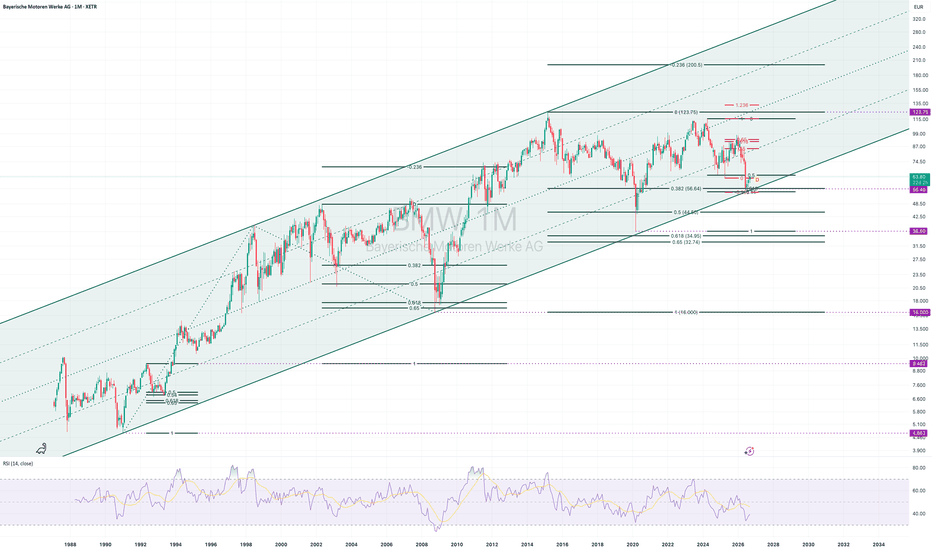
BTCUSDT Long: Rebound from 78,500$ Point to Further UpsideHello traders! Here’s my technical outlook based on the current BTCUSDT (4H) chart structure. BTCUSDT previously traded inside a descending channel before breaking above the structure and shifting bullish. Price then formed a range before breaking higher and moving toward the 82,000 Supply Zone, where sellers appeared.
Currently, BTCUSDT is trading below 82,000 while holding above the 78,500 Demand Zone and rising Trend Line. The recent pullback suggests a possible retest of support before another move higher.
As long as BTCUSDT remains above 78,500 and respects the rising Trend Line, the bullish scenario remains valid. A successful rebound from support could push price toward 82,000 (TP1). However, a breakdown below 78,500 would weaken the bullish outlook and increase downside risk. Manage your risk! Long 


