BTC - The $82K Bait and the Unfinished Business at $75K
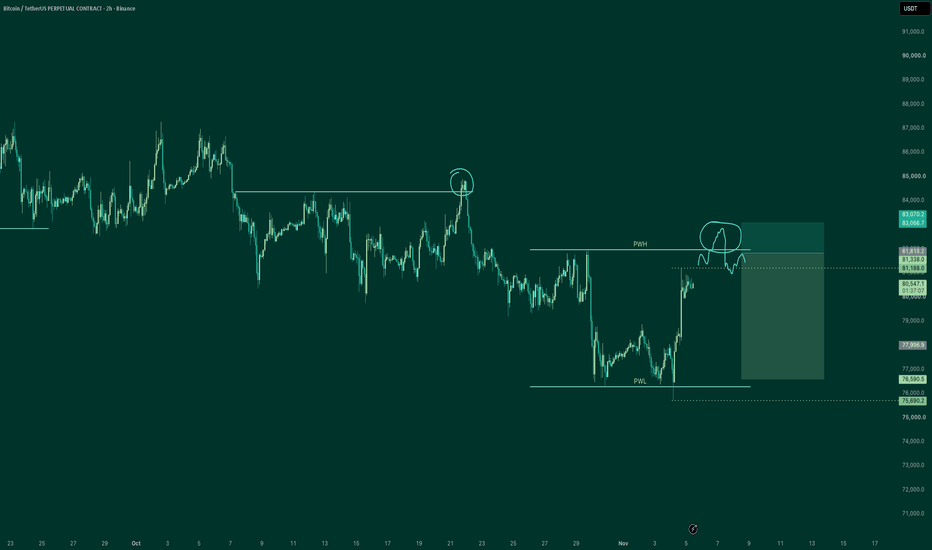
As outlined in the previous post/update, the expected volatility drop materialized, but it front-ran the actual target. Price dumped into the $75.6K zone, leaving the primary liquidity pool at $75K entirely untouched.
When a major support boundary is front-run this closely, it usually means the market is engineering trapped liquidity for a later, harder sweep. The core thesis for a flush to $75K remains fully intact.
The Setup: The $82K Liquidity Trap
The catalyst for the final leg down to $7
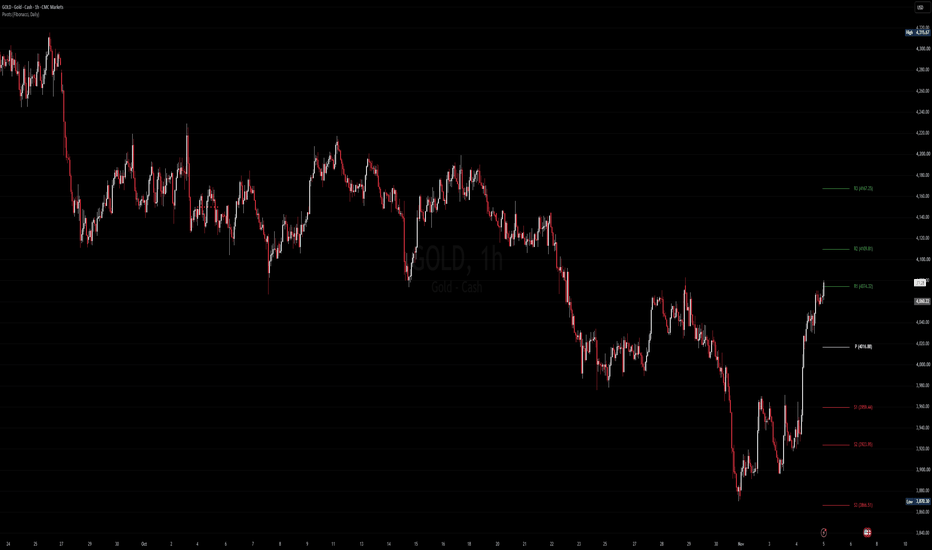
Pivot Points
DYM is following a bearish structure (4H)First of all, keep in mind that this is a SELL setup, not a BUY setup!
We had a major bullish CH, followed by bearish BOS formations, indicating that the external market structure is bearish. Therefore, we should be looking for SELL/SHORT opportunities around key supply and order block zones.
There is also a liquidity pool above the chart that could potentially be swept.
If price reaches the marked supply zone in the near future, we will look for an opportunity to enter a SELL/SHORT position.
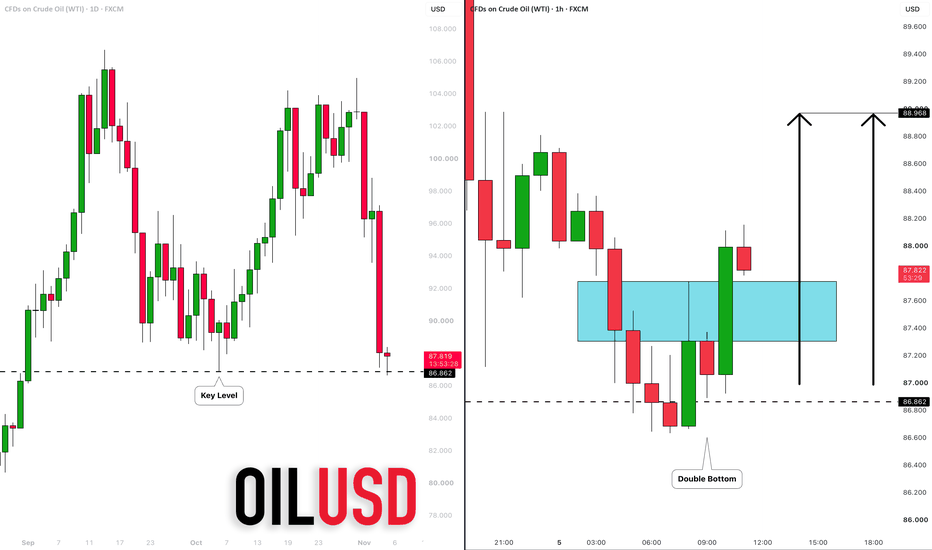
CRUDE OIL (WTI): Oversold Market & Pullback
Crude Oil reached a strong daily key level after yesterday's selloff.
I think that the market turned oversold.
I expect a pullback and a test of 88.96 level.
❤️Please, support my work with like, thank you!❤️
I am part of Trade Nation's Influencer program and receive a monthly fee for using their TradingView charts in my analysis.
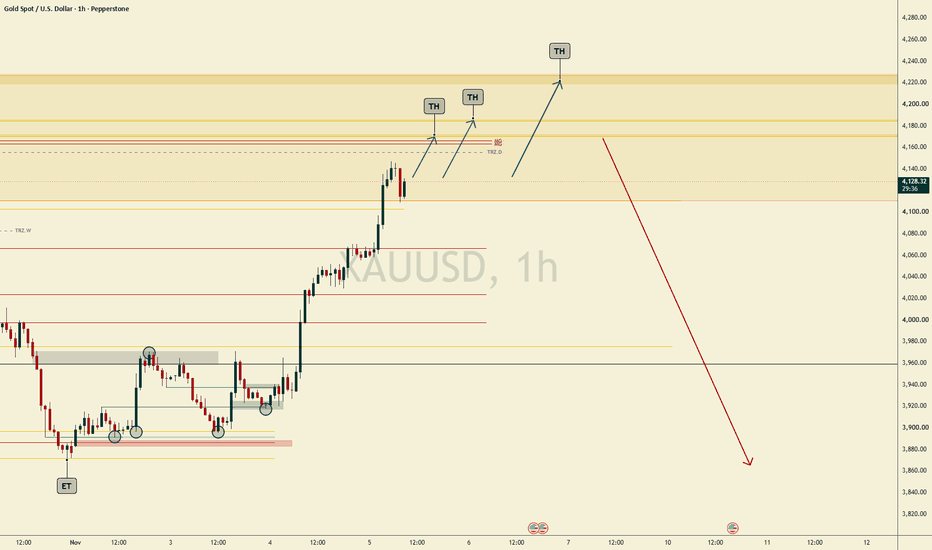
# XAUUSD — 270-Dollar Bullish Move Delivered | Three Potential RGold has delivered a remarkable bullish move from approximately $3,880 to $4,150, in line with our previously published short-term bullish outlook.
What makes this move particularly important is that **our broader market outlook remained bearish throughout the rally.**
We identified the bullish opportunity from the lower technical areas while maintaining our expectation of a potential bearish reversal from higher levels.
The green circles on our chart highlight several important price reactions
THROUGH THE NIGHT · Thursday 5 November · XAUUSD Daily PivotsR3 4168
R2 4110
R1 4075
PIVOT 4017
S1 3960
S2 3924
S3 3867
CREDIT TO THE BULLS
Wednesday belonged to the buyers.
The Democrats swept Congress, the dollar softened, and buyers took gold through Wednesday's pivot, R1, R2 and R3 in one run.
They pushed through this week's weekly pivot at 4054 and closed the day at 4062, up $131. That's the strongest day we've seen in weeks.
The map called the path. The bulls did the rest.
WHERE PRICE SITS
4078. That's $61 above the pivot, sitting right on R1 at 4
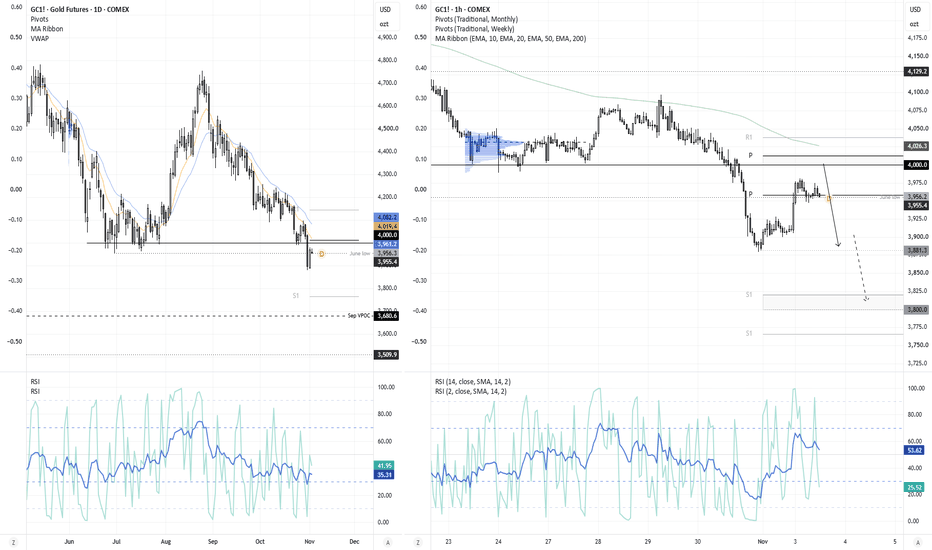
Gold Bears Eye $3,880 as $4,000 Resistance LoomsGold prices broke decisively below 4,000 last week – killing off my assumption that bulls were quietly accumulating above that level. While prices recouped some of those losses on Monday, they remain below 4,000 – making it a pivotal level for traders over the near term.
The 1-hour chart shows prices holding above the weekly pivot point for now, but with the monthly pivot and weekly R1 sitting just above 4,000, bears may be seeking to fade rallies towards these levels. The near-term target is j
Bitcoin, with a bearish structure, is heading toward $72KAs you can see, Bitcoin is still trading below a clear bearish trendline, which continues to act as resistance. We also have a bearish CH (Change of Character), and the overall market structure remains bearish, with consistent lower highs and lower lows being formed.
At the moment, Bitcoin has bounced from an important support zone that has two potential targets. I’m watching these targets closely, as either the first or the second target could provide the next opportunity for the bearish move
BTCUSDT Analyses-83, October 30, 2026Two Zones, Two Possible Directions
$BINANCE
Bitcoin's 1H structure remains bearish following the recent sharp decline. Instead of entering immediately, I'm watching two marked zones for either a reversal or a confirmed breakout.
• Upper zone — 78,652: A bullish breakout could open the path toward 80,224, 81,778 and 83,277.
• Lower zone — 76,837: Holding this area could trigger a recovery. Losing it would expose the critical 75,632 support.
• Bearish continuation: A confirmed break below 75,632
DELL —The AI Boom Just Sent It to Record Highs. What Comes Next?💻 DELL NYSE:DELL | WEEKLY + MONTHLY OUTLOOK
Current Area: ~$567
———————————
🟢 Long-Term Structure
NYSE:DELL has been one of the stronger AI infrastructure plays, and the long-term chart remains firmly bullish.
The stock has now pushed into new all-time highs, so for me this isn't about chasing the breakout. I want to see whether NYSE:DELL can hold the breakout area and turn previous resistance into support.
———————————
🟢 Key Support Areas
$530–$540 — Immediate breakout suppo
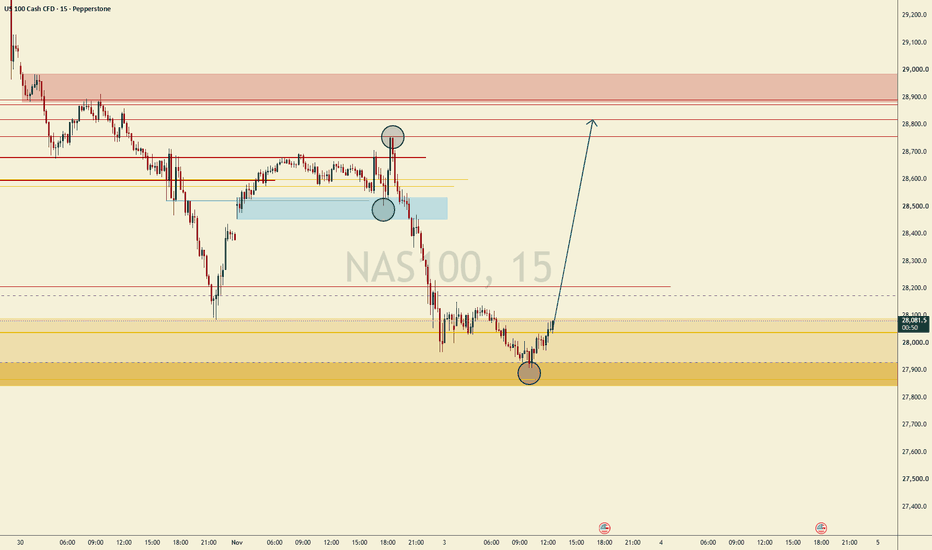
NAS100 — Another Reaction From Our Key Level | Bullish Scenario NASDAQ has continued its bearish move and reached the lower technical area we identified in advance.
In our previous analysis, we highlighted several important areas and marked the key price reactions with green circles.
The updated chart now shows another important development.
**Price has reached our lower zone and started reacting bullishly from that area.**
### Technical Development
The chart highlights the previous reactions at the upper technical structures, followed by the bearish move in
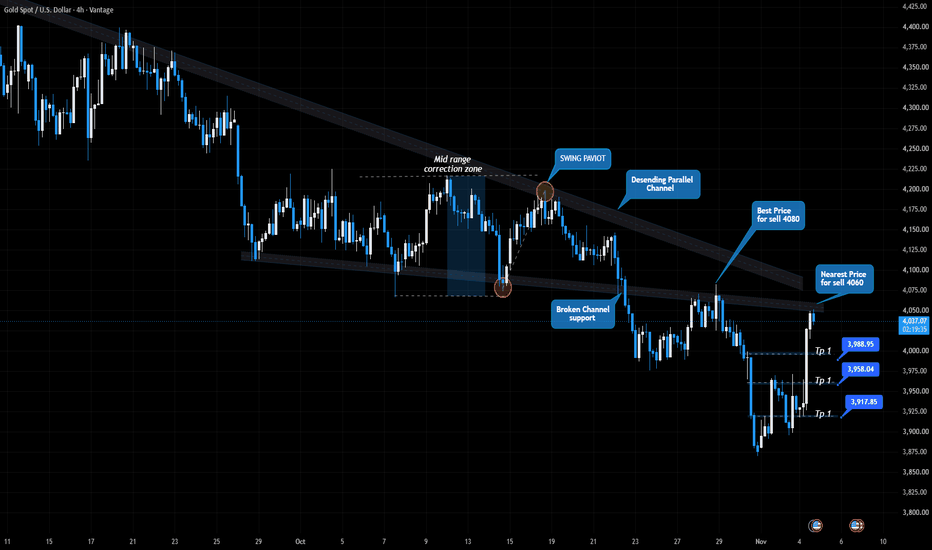
Gold Is Back at Resistance: Where to Sell NextHere Is My 4 Hour Gold Chart. After the sharp drop to 3875, the price bounced strongly and has now come back up to the underside of the broken channel support, which is a very important area to look for sells. The market has been moving inside a clear Descending Parallel Channel since the late-September highs, with lower highs and lower lows, and the recent break below the lower channel line confirmed that sellers are in control. Now price is retesting that broken line, and a retest like this is
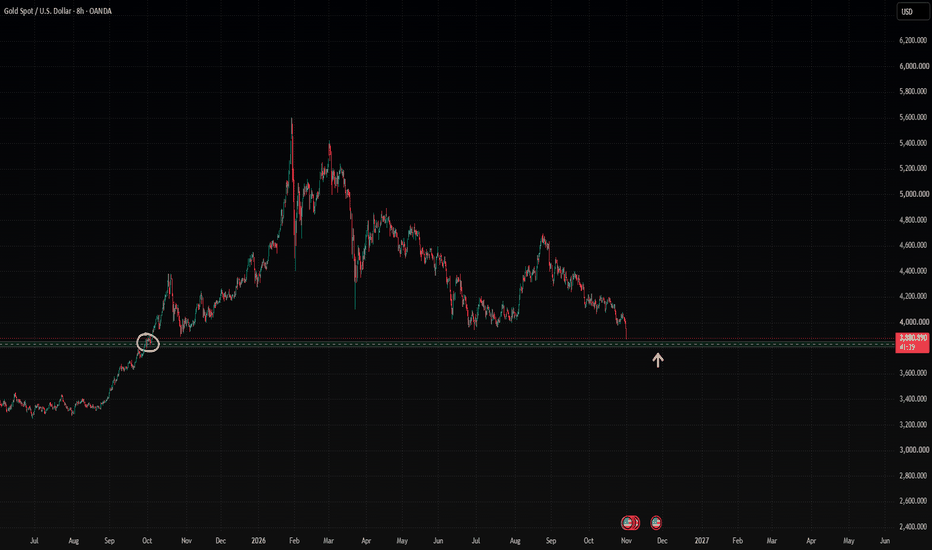
GOLD - BUY ZoneA suitable zone for purchasing gold (for medium-term or swing trading) will begin once a divergence is confirmed. This is not a buy signal or a futures trade recommendation; rather, it simply identifies favorable zones for buying and investing in gold. Traders may look for long positions once the setup is confirmed.
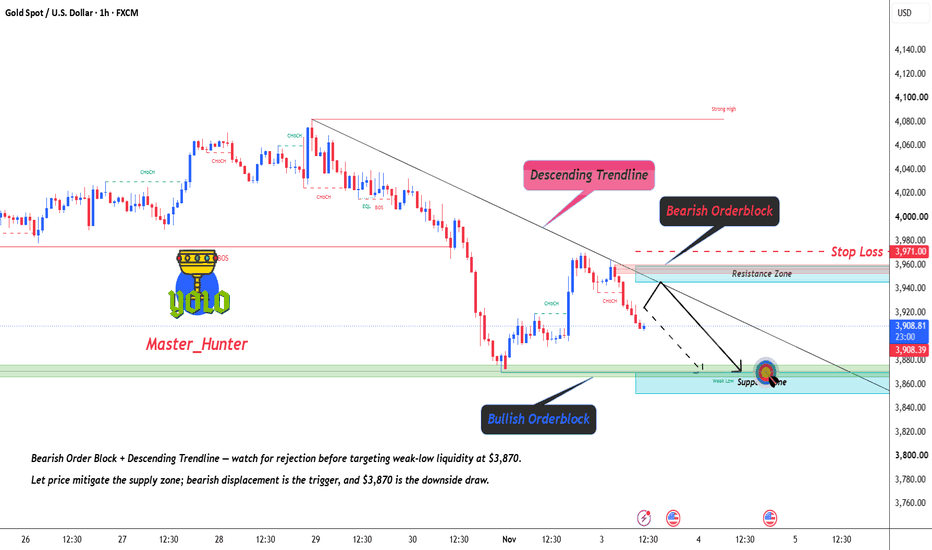
XAUUSD: Bearish Order Block Retest — $3,870 Next?Hook :
FX:XAUUSD remains under a descending trendline , with a potential short setup developing around the $3,945–$3,960 bearish order block. If sellers defend this resistance confluence, another bearish leg toward $3,870 could follow. 🔥
Market Context :
Gold is showing signs of bearish continuation on the 1H chart , with the descending trendline continuing to cap recovery attempts.
The focus is now on a potential retracement into the $3,945–$3,960 resistance zone, where the bearish or
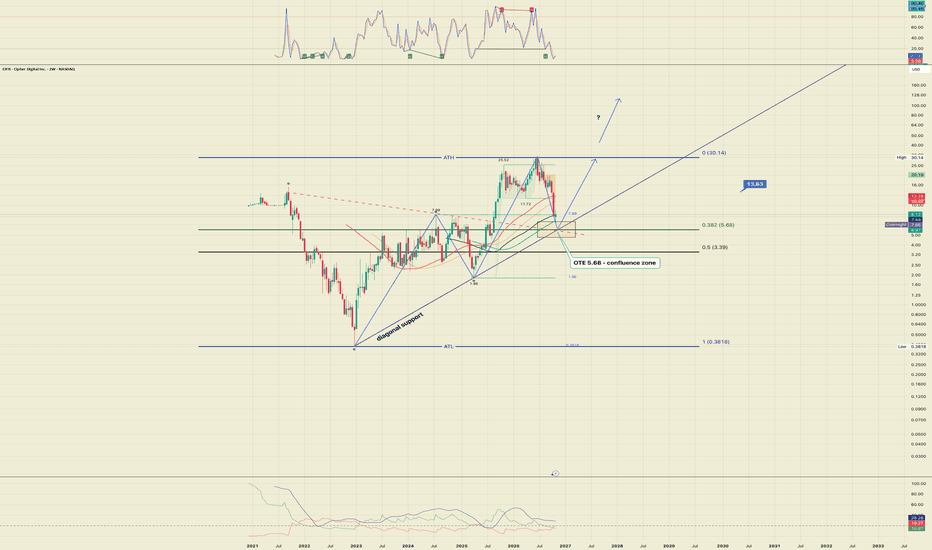
CIFR: $31M in Profit. But There's a CatchCipher Digital ( NASDAQ:CIFR ) is transforming from a Bitcoin miner into an AI and high-performance computing infrastructure provider. Its HPC contract portfolio has reached $16.6 billion, covering 700 MW of capacity with a weighted average lease term of 17.3 years. A major highlight is Barber Lake, where a 10-year lease extension increased total contracted revenue to approximately $9.1 billion. These are long-term contracted payments, not revenue already collected.
The transition is beginning
GBPCAD — Bullish Structure | Momentum Re-aligned GBPCAD — Bullish Structure | Awaiting Liquidity
Higher-Timeframe Structure
The broader higher-timeframe structure remains bullish.
Price previously took inducement, confirmed a major high above the intermediate structural range, and subsequently retraced into the midterm auction zone (orange zone).
That mitigation became an important area of interest for the next stage of bullish development.
Intermediate & Lower-Timeframe Confirmation
Following mitigation of the orange auction zon
PENDLE: A Major Buying Opportunity Could Be Coming! (1D)Price may experience further downside before reaching the marked demand zone, where we expect a potential bullish reaction and a possible move back to the upside.
On the higher timeframes, the internal structure remains bearish, while the external structure is still bullish. This suggests that the current bearish movement could simply be a deeper correction within the broader bullish structure.
The demand zone remains untouched and unmitigated, making it an interesting area to watch for potent
AUDNZD — Bullish Higher-Timeframe Structure | Awaiting Liquidity AUDNZD — Bullish Liquidity Delivery
Higher-Timeframe Structure
The higher-timeframe picture remains bullish.
Price has established a significant structural shift by breaking the major higher-timeframe high (blue zone / horizontal level).
Following that break, price continued developing bullish footprints, climbing toward the next set of highs.
For now, I'm respecting the established bullish structure while monitoring how price develops its next intermediate movement.
Intermediate Pri
NZDUSD — Higher-Timeframe Reversal Bullish Structure Under Evaluation
Higher-Timeframe Development
Price began developing a broader bullish reversal from its previous bearish higher-timeframe structure after sweeping sell-side liquidity and reaching a higher-timeframe order block.
Following the distribution within that higher-timeframe auction zone, intermediate structure shifted bullish, confirming the initial bullish intent coming from the higher-timeframe mitigation.
Price produced strong displacement out of the zone,
AUDUSD — Bullish Structure Meets Bearish Momentum | Waiting Waiting for Deeper Mitigation
Structural Development
Price initially mitigated the intermediate midterm auction zone (orange zone).
Following that mitigation, lower-timeframe structure shifted bullish by breaking the external lower high, providing confirmation of a potential bullish reversal.
Price then displaced aggressively, established a new high, and retraced to take the internal inducement leg, engineering liquidity along the way.
We also saw a double mitigation of the midterm ord
AUDCAD — Higher-Timeframe Structure Broken | Tracking the Prints
Over the past week and into the weekend, AUDCAD had been developing within a bullish higher-timeframe structure.
That condition has now changed.
Price has breached the higher-timeframe external bullish structure, producing a candle close below the protected higher low. This is a significant development, and my focus has shifted toward tracking the new information rather than holding onto the previous bullish outlook.
Liquidity & Price Map
I've identified an internal bullish leg that re
AUDJPY — Bullish Structure | Momentum Conflict & Execution Wait# Bullish Structure | Momentum Conflict | Waiting for Alignment
**Higher-Timeframe Development**
Price mitigated the higher-timeframe structural auction order block (blue zone), establishing the foundation for the bullish directional development.
From there, intermediate structure confirmed its bullish transition by breaking the external midterm lower high.
Following that confirmation, price swept inducement, established a new high, and mitigated the intermediate auction order block (orang
CADJPY — Bullish Continuation | Tracking Higher-Timeframe Liquid
**Higher-Timeframe Objective**
Following price reaching and breaking through the intermediate levels identified as last week's objectives, attention now shifts toward the higher-timeframe external lower high.
This remains my primary objective for the current week and the sessions ahead, sitting above the blue horizontal level within premium territory.
**Current Market Conditions**
My directional bias remains bullish, with price continuing to develop above my momentum EMA.
I'm primarily