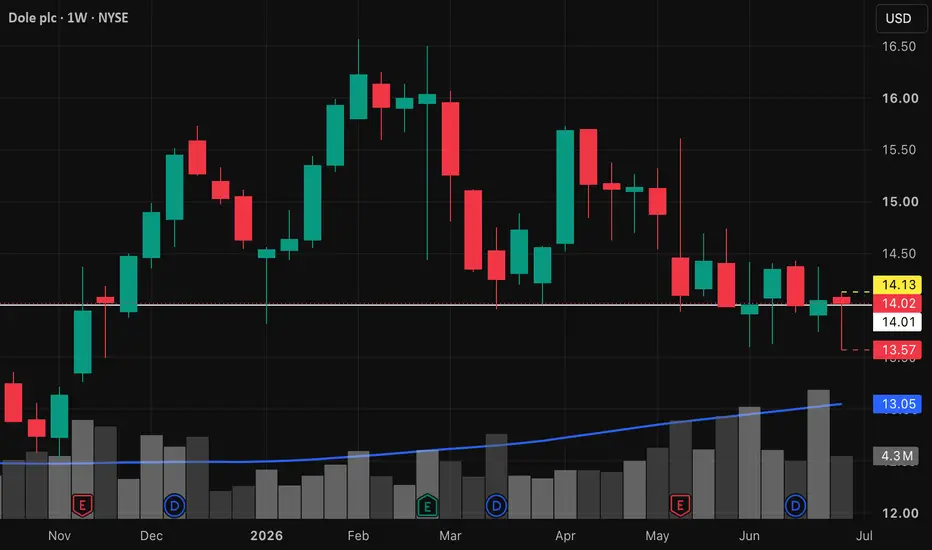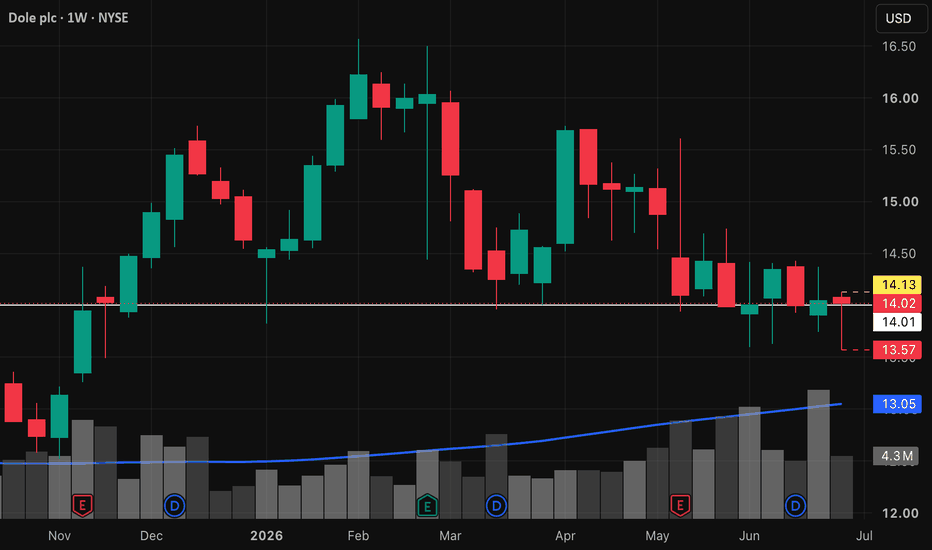
DOLE | The time to go long has come- Timeframe: Weekly
- Trade type: Buy stop order
- Price: 14.13
- Take Profit: Open
- Stop Loss: 13.57 (-4.00 %)
Idea: Long on a breakout above last week's high - bullish momentum continuation.
Entry: Buy stop above last week’s high.
Stop-loss: Below the low of the same candle.
If the weekly candle closes below this level, the trade is invalidated.
Take Profit: Trailing stop following the lows of new weekly candles.
Pivot Points
Nifty Analysis EOD – 21 July, 2026 – Tuesday🟢 Nifty Analysis EOD – 21 July, 2026 – Tuesday 🔴
Compression Continued: Inside the Inside: Silent Expiry
🗞 Nifty Summary
Nifty opened flat to negative and made a brief attempt to test the PDH, but 24,260 acted as strong resistance and pushed price back down. The index then slowly and steadily breached the IBL and moved to the 24,160 support zone. From there, the rest of the session was spent within a tight 24,190 ~ 24,160 band — just a 30-point range.
There was one attempt to break below this range, but the PDL held as strong support and a sharp recovery brought price back to the upper band. After 3:00 PM, the range compressed further to just 16 points, and the session ended quietly at 24,193.95 with no real displacement in either direction.
Today’s weekly expiry closed very silently — no struggle, no drama. On the daily time frame, we’re still inside the previous day’s range, which is itself inside the prior bar. That’s deep contraction. A breakout on either side is needed before an expansion play can develop.
🛡 5 Min Intraday Chart with Levels
📉 Daily Time Frame Chart with Intraday Levels
🕯 Daily Candle Breakdown
Open: 24,216.05
High: 24,262.20
Low: 24,135.65
Close: 24,187.70
Change: −50.80 (−0.21%)
🏗️ Structure Breakdown
Type: Bearish Spinning Top — price drifted lower but neither side committed
Range: ≈ 127 points — low volatility
Body: ≈ 28 points — minimal seller pressure, no real follow-through
Upper Wick: ≈ 46 points — mild supply rejection at the open area
Lower Wick: ≈ 52 points — buyers defended the lows but lacked energy to reclaim
🛡 5 Min Intraday Chart
⚔️ Gladiator Strategy Update
ATR: 239.60
IB Range: 112.45 → Medium
Market Structure: Balanced
Trade Highlights:
09:53 Long Trade: SL Hit
10:22 Short Trade: Trailing SL Hit (small loss)
11:43 Short Trade: SL Hit
12:58 Short Trade: SL Hit
Trade Summary: Four trades today and all four closed in the red — three clean SL hits and one trailing SL that still ended with a small loss. On a day this compressed, the system kept finding setups that the market simply refused to follow through on. It happens. The structure was balanced, the range was tight, and that combination doesn’t always play well with momentum entries. Nothing to force-correct here — this was the market’s day, not mine.
🧱 Support & Resistance Levels
Resistance Zones: 24,260 | 24,300 | 24,360 ~ 24,380 | 24,430 | 24,460
Support Zones: 24,200 ~ 24,160 | 24,100 | 24,030
🧠 Final Thoughts
“When the market stops talking, stop trying to finish its sentences.”
Today was a reminder that not every session hands you something clear. The index spent most of the day in a 30-point box — and on a weekly expiry day, that silence is its own kind of message. Four SL hits across four trades says less about the setups and more about the conditions. Balanced structure, compressed range, no expansion — the Gladiator system was looking for a move that the market had already decided not to make.
Looking into tomorrow, the key zone to watch is 24,200 ~ 24,160 on the support side. If that holds and price starts pushing above 24,260, there’s a case for an expansion attempt toward 24,300 and beyond. A clean break below 24,160, on the other hand, opens the door toward 24,100 and possibly 24,030. The inside-bar-within-inside-bar structure on the daily means whichever side breaks first, it could move with some energy.
Four reds in a row can feel heavy at the end of the day. But forcing trades into a market that’s made up its mind to do nothing is a different kind of mistake. Tomorrow I come in fresh, watch the levels, and let the price show me something before I act.
✏️ Disclaimer
This is my personal digital diary and represents my own analysis and point of view. It is not financial advice; please consult a professional advisor before making any trading decisions.
As $USO goes $CVX $XOM will followAMEX:USO is currently making a v-shape recovery back to it's previous highs. Unsure if it will return there but this is my idea.
If AMEX:USO can get above the 61.8% on the fib around $134, I would say yes. Have you missed the entire move? No as it still will track back towards $150 before it will hit a bit of exhaustion, before another decision in the market is made.
Trade ideas NYSE:CVX NYSE:XOM
BTC Analyses-10, [July 21, 2026]Welcome to my page! I share daily technical analyses of Bitcoin and other charts here.
BINANCE:BTCUSDT
💡Market Analysis:
Bitcoin is currently testing the critical H-4 resistance level at 65,470 after a strong upward push. We are waiting for a decisive breakout candle with >80% body closing above this zone or a confirmed pullback to execute our next trade setup.
Key Support & Resistance:
Key Resistance: 65,470.00
Key Support Area: 64,387.99
🎯 Trade Entry & Exit Plan:
Entry : Breakout/Pullback of trendline or key zones with >50% candle body.
Stop Loss : Behind the last wave or the last breakout candle.
Take Profit : Minimum R:R 2, with further targets at major horizontal levels.
⚠️Risk Management:
Maximum 1% risk per trade.
❤️Please share your thoughts and comments on this analysis!
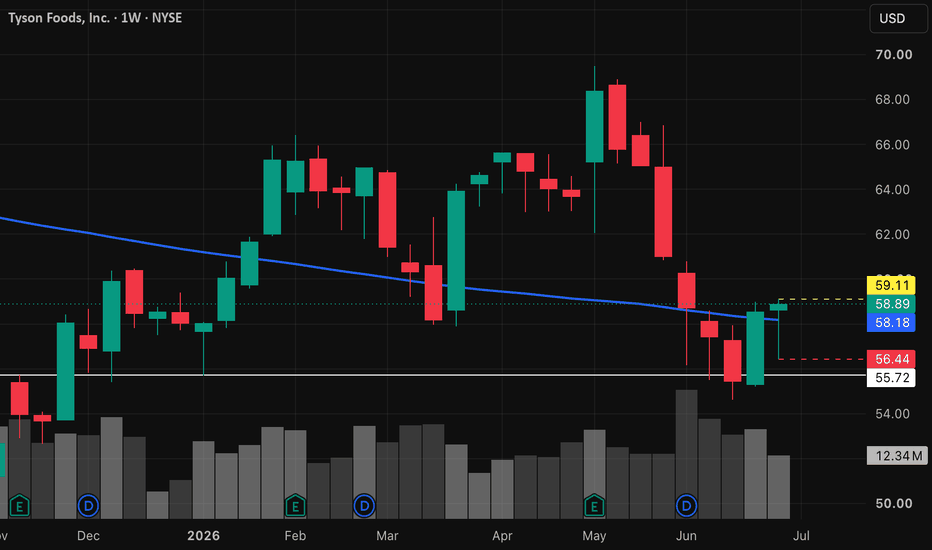
TSN | The time to go long has come- Timeframe: Weekly
- Trade type: Buy stop order
- Price: 59.11
- Take Profit: Open
- Stop Loss: 56.44 (-4.50 %)
Idea: Long on a breakout above last week's high - bullish momentum continuation.
Entry: Buy stop above last week’s high.
Stop-loss: Below the low of the same candle.
If the weekly candle closes below this level, the trade is invalidated.
Take Profit: Trailing stop following the lows of new weekly candles.
HON | Continued stock growth- Timeframe: Weekly
- Trade type: Buy stop order
- Price: 230.47
- Take Profit: Open
- Stop Loss: 220.39 (-4.40 %)
Idea: Long on a breakout above last week's high - bullish momentum continuation.
Entry: Buy stop above last week’s high.
Stop-loss: Below the low of the same candle.
If the weekly candle closes below this level, the trade is invalidated.
Take Profit: Trailing stop following the lows of new weekly candles.
HLong
$SOL Sitting on a Low-Volume Pocket. Watching for the SweepWatching CRYPTOCAP:SOL and I'd like to see this scenario play out. There's a local liquidity zone with no volume in it. Price clearly won't linger there, so we've got two options here.
Price flies through that low volume zone off this liquidity and holds above (no trade).
Liquidity grab and a return to the zone near 0.5.
The second scenario is the one that gives me a chance to enter a position. Watching closely, I'll be looking for a break on the lower timeframe in case of a sweep and absorption, and opening the trade if the conditions are there.
NFA!
NZDCHF: Overbought Market & Pullback 🇳🇿🇨🇭
NZDCHF will likely retrace from a key historical resistance level.
A bearish choch on an hourly time frame provides a strong confirmation
of the overbought state of the market.
Goal - 0.4739
❤️Please, support my work with like, thank you!❤️
I am part of Trade Nation's Influencer program and receive a monthly fee for using their TradingView charts in my analysis.
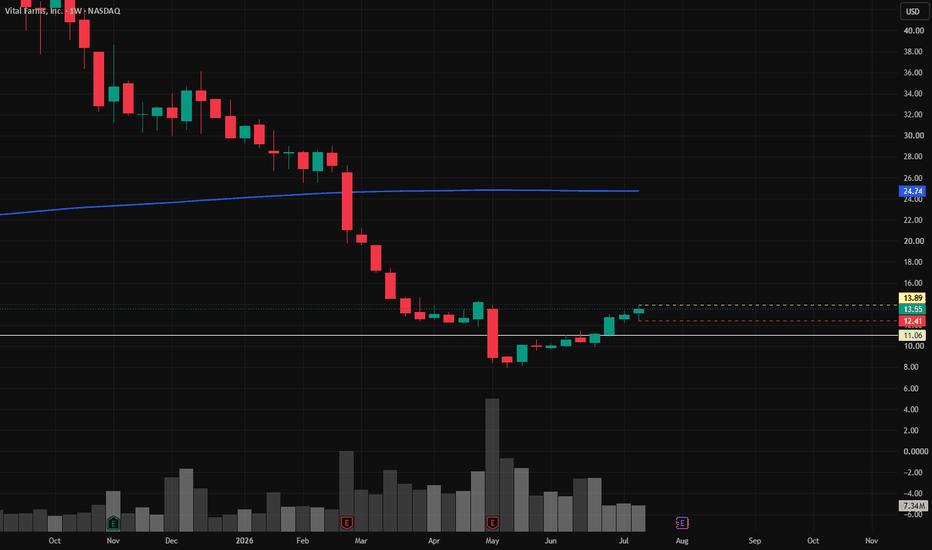
VITL | The time to go long has come- Timeframe: Weekly
- Trade type: Buy stop order
- Price: 13.89
- Take Profit: Open
- Stop Loss: 12.41 (-10.60 %)
Idea: Long on a breakout above last week's high - bullish momentum continuation.
Entry: Buy stop above last week’s high.
Stop-loss: Below the low of the same candle.
If the weekly candle closes below this level, the trade is invalidated.
Take Profit: Trailing stop following the lows of new weekly candles.
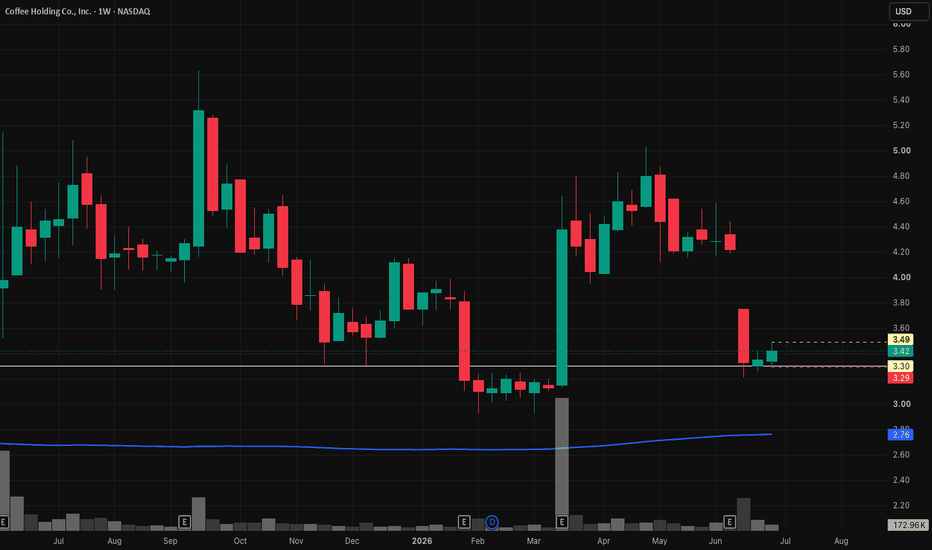
JVA | The time to go long has come- Timeframe: Weekly
- Trade type: Buy stop order
- Price: 3.49
- Take Profit: Open
- Stop Loss: 3.29 (-5.70 %)
Idea: Long on a breakout above last week's high - bullish momentum continuation.
Entry: Buy stop above last week’s high.
Stop-loss: Below the low of the same candle.
If the weekly candle closes below this level, the trade is invalidated.
Take Profit: Trailing stop following the lows of new weekly candles.
GTES | Continued stock growth- Timeframe: Weekly
- Trade type: Buy stop order
- Price: 27.44
- Take Profit: Open
- Stop Loss: 25.94 (-5.50 %)
Idea: Long on a breakout above last week's high - bullish momentum continuation.
Entry: Buy stop above last week’s high.
Stop-loss: Below the low of the same candle.
If the weekly candle closes below this level, the trade is invalidated.
Take Profit: Trailing stop following the lows of new weekly candles.
GLong
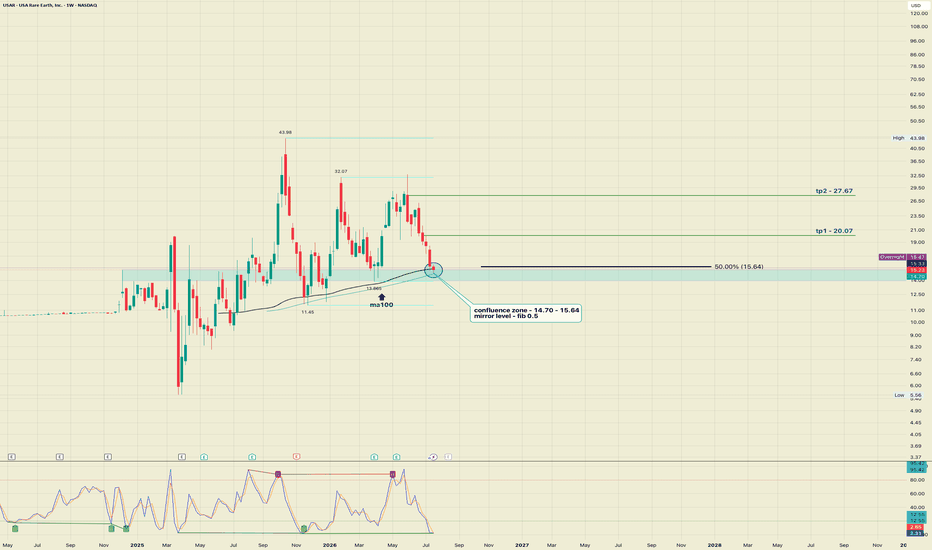
USAR 1W - key confluence zone on the weekly chartNASDAQ:USAR
Price has returned to the $14.70–$15.64 range, which previously acted as the main resistance throughout the 2024–2025 cycle. After the breakout, the market is now forming the first full retest of this area, now as potential support.
Several technical factors are converging in this zone:
previous resistance now acting as potential support, 50% Fibonacci retracement of the entire upward impulse, 100-period moving average on the weekly timeframe, and RSI and Stochastic in deeply oversold territory after the decline.
This combination creates an area of increased interest for buyers.
Aggressive entry during a continuing decline carries elevated risk. A more rational approach is to wait for confirmation on lower timeframes and the formation of a reversal structure within the zone.
Near-term resistance sits at $20.07. The next key target is around $27.67, where intermediate supply is located.
From a technical perspective, the market is now at a point where risk and potential reward are beginning to form an asymmetric opportunity.
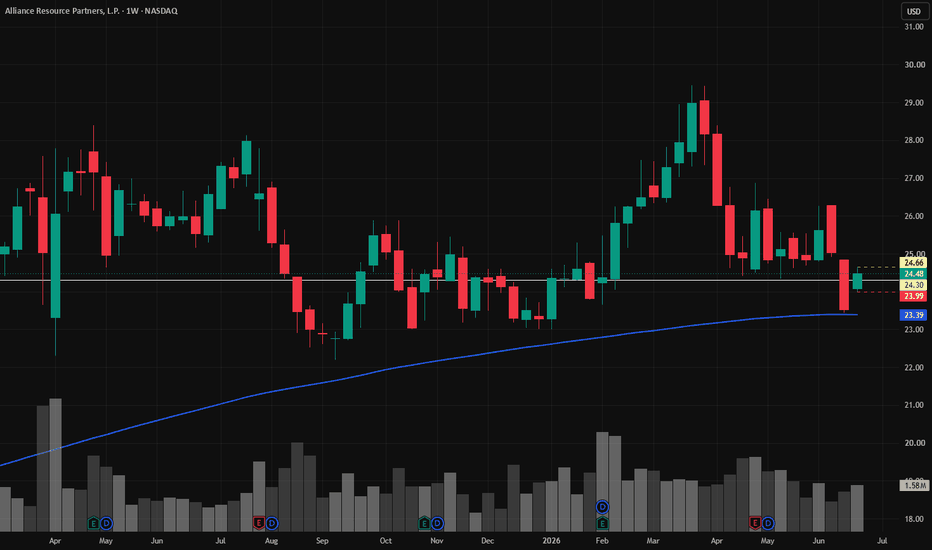
ARLP | Continued stock growth- Timeframe: Weekly
- Trade type: Buy stop order
- Price: 24.66
- Take Profit: Open
- Stop Loss: 23.99 (-2.70 %)
Idea: Long on a breakout above last week's high - bullish momentum continuation.
Entry: Buy stop above last week’s high.
Stop-loss: Below the low of the same candle.
If the weekly candle closes below this level, the trade is invalidated.
Take Profit: Trailing stop following the lows of new weekly candles.
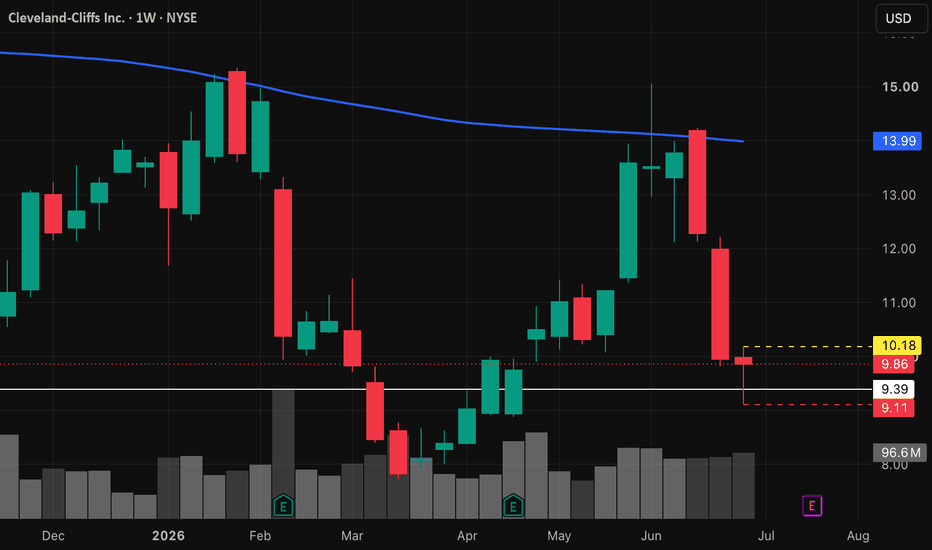
CLF | The time to go long has come- Timeframe: Weekly
- Trade type: Buy stop order
- Price: 10.18
- Take Profit: Open
- Stop Loss: 9.11 (-10.50 %)
Idea: Long on a breakout above last week's high - bullish momentum continuation.
Entry: Buy stop above last week’s high.
Stop-loss: Below the low of the same candle.
If the weekly candle closes below this level, the trade is invalidated.
Take Profit: Trailing stop following the lows of new weekly candles.
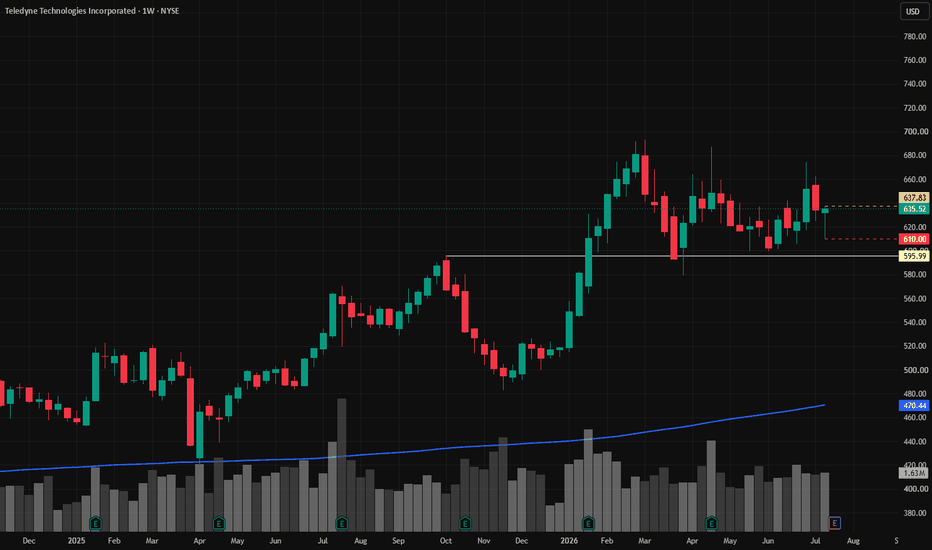
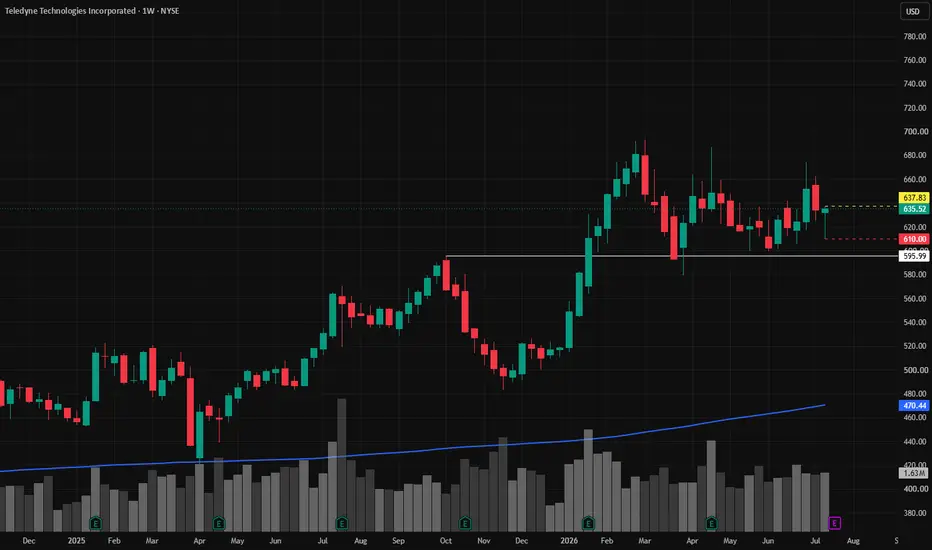
TDY | Continued stock growth- Timeframe: Weekly
- Trade type: Buy stop order
- Price: 637.83
- Take Profit: Open
- Stop Loss: 610.00 (-4.40 %)
Idea: Long on a breakout above last week's high - bullish momentum continuation.
Entry: Buy stop above last week’s high.
Stop-loss: Below the low of the same candle.
If the weekly candle closes below this level, the trade is invalidated.
Take Profit: Trailing stop following the lows of new weekly candles.
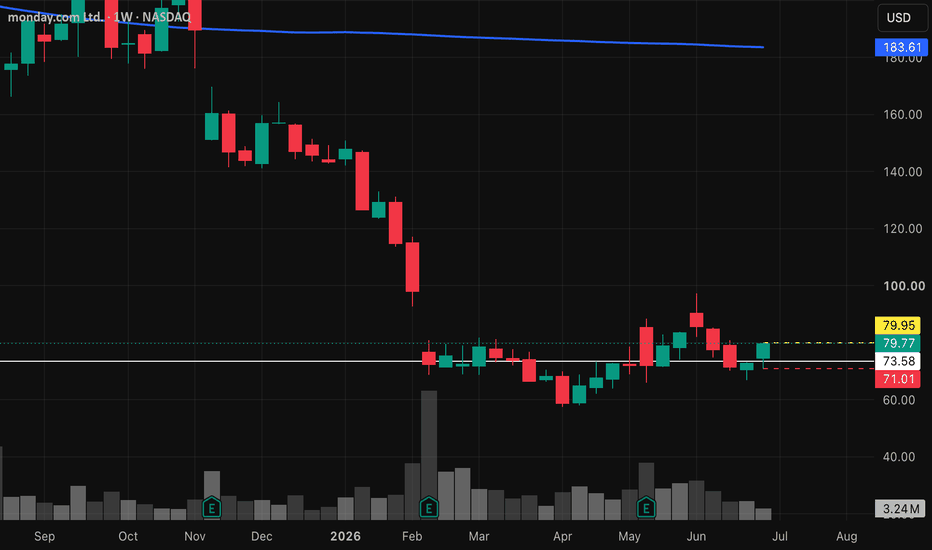
MNDY | The time to go long has come- Timeframe: Weekly
- Trade type: Buy stop order
- Price: 79.95
- Take Profit: Open
- Stop Loss: 71.01 (-11.20 %)
Idea: Long on a breakout above last week's high - bullish momentum continuation.
Entry: Buy stop above last week’s high.
Stop-loss: Below the low of the same candle.
If the weekly candle closes below this level, the trade is invalidated.
Take Profit: Trailing stop following the lows of new weekly candles.
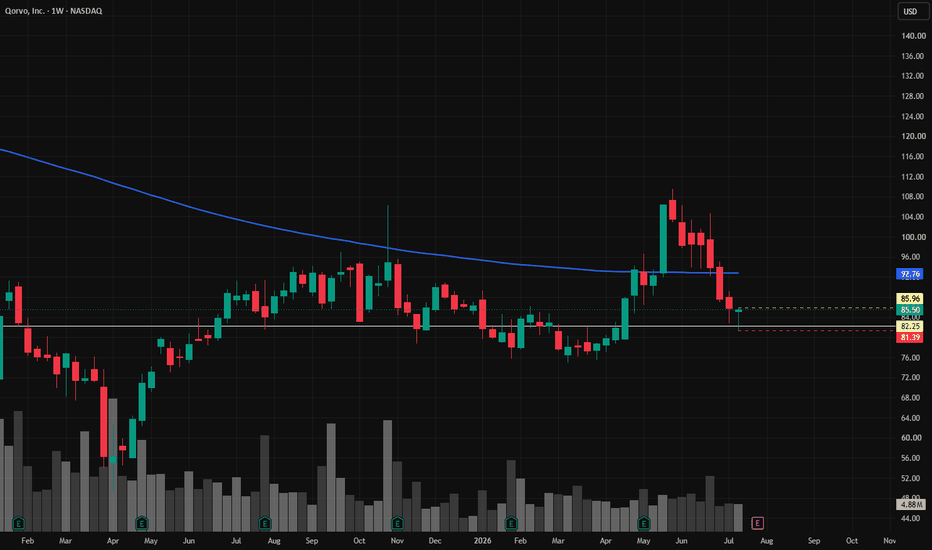
QRVO | The time to go long has come- Timeframe: Weekly
- Trade type: Buy stop order
- Price: 85.96
- Take Profit: Open
- Stop Loss: 81.39 (-5.30 %)
Idea: Long on a breakout above last week's high - bullish momentum continuation.
Entry: Buy stop above last week’s high.
Stop-loss: Below the low of the same candle.
If the weekly candle closes below this level, the trade is invalidated.
Take Profit: Trailing stop following the lows of new weekly candles.
Nifty Analysis EOD – 20 July 2026 – Monday🟢 Nifty Analysis EOD – 20 July 2026 – Monday 🔴
Calm Before Expiry: Bulls and Bears Breathe Easy Inside a 112-Point Cage
🗞 Nifty Summary
Nifty opened with a gap down of 148 points after a weekend filled with geopolitical noise. The very first one-minute candle itself carved out the full 112.45-point range for the day — and then the session just lived inside that range till the close. Compact, yes. But plenty of drama packed in.
The day closed at 24,238.50 (adjusted close 24,238.50). What makes today’s candle interesting is that it fits a near-perfect inside bar pattern by the book — range well within the previous session’s range, both sides contained. With the ATR sitting at 239.60, today’s contraction feels deliberate. The market seems to be coiling energy ahead of tomorrow’s weekly expiry.
My back test data says most Mondays tend to stay within the IB range, or give a fakeout on either side. So I’m usually not looking for an IB breakout trade on Mondays — and that read played out today. The IBL breakdown ended up offering a nice contra trade opportunity instead.
Tomorrow’s opening is the one thing I’ll be watching closely before forming any directional bias for the session. The expiry session usually brings the volatility that today’s session held back.
🛡 5 Min Intraday Chart with Levels
📉 Daily Time Frame Chart with Intraday Levels
🕯 Daily Candle Breakdown
Open: 24,190.05
High: 24,266.10
Low: 24,135.85
Close: 24,238.50
Change: −95.80 (−0.39%)
🏗️ Structure Breakdown
Type: Bullish Inside Bar — demand absorbed the gap-down open and recovered toward the upper half
Range: ≈ 130 points — moderate volatility
Body: ≈ 48 points — mild buyer pressure, close well off the lows but below open
Upper Wick: ≈ 28 points — some supply resistance near the highs
Lower Wick: ≈ 54 points — decent demand response from the session lows
🛡 5 Min Intraday Chart
⚔️ Gladiator Strategy Update
ATR: 239.60
IB Range: 112.45 → Medium
Market Structure: Balanced
Trade Highlights:
10:34 Short Trade: Target Hit (R:R 1:4.16)
12:11 Long Trade: SL Hit
12:52 Long Trade: Target Hit (R:R 1:3.41)
Trade Summary: The short at 10:34 worked well — a 1:4.16 on a Monday inside-range session is not something to take lightly. The 12:11 long got stopped out, which is part of the game in a range-bound session where neither side commits fully. Good that the 12:52 long came back and delivered a 1:3.41. Two targets and one SL — the system held its shape today. Overall a decent Monday, especially given the kind of compressed price action we were working with.
🧱 Support & Resistance Levels
Resistance Zones: 24,260 | 24,300 | 24,360 ~ 24,380 | 24,430 | 24,460
Support Zones: 24,200 ~ 24,160 | 24,100 | 24,030
🧠 Final Thoughts
“Stillness is not absence of direction — it is direction holding its breath.”
Today was one of those sessions where the market said a lot by doing very little. A 148-point gap down at open, and then nearly the entire day spent inside that first candle’s range. The drama was real, just compressed.
For tomorrow, the levels I’m watching are 24,260 and 24,300 on the upside — if those give way early, the 24,360 ~ 24,380 zone becomes the next conversation. On the downside, 24,200 ~ 24,160 is the floor that needs to hold. A clean break below that, and 24,100 comes into the picture quickly on an expiry session.
Tomorrow I’ll let the opening play out before deciding anything. Weekly expiry sessions can flip fast — the plan is to watch, wait for a setup that makes sense, and not force a trade just because it’s expiry day.
✏️ Disclaimer
This is my personal digital diary and represents my own analysis and point of view. It is not financial advice; please consult a professional advisor before making any trading decisions.
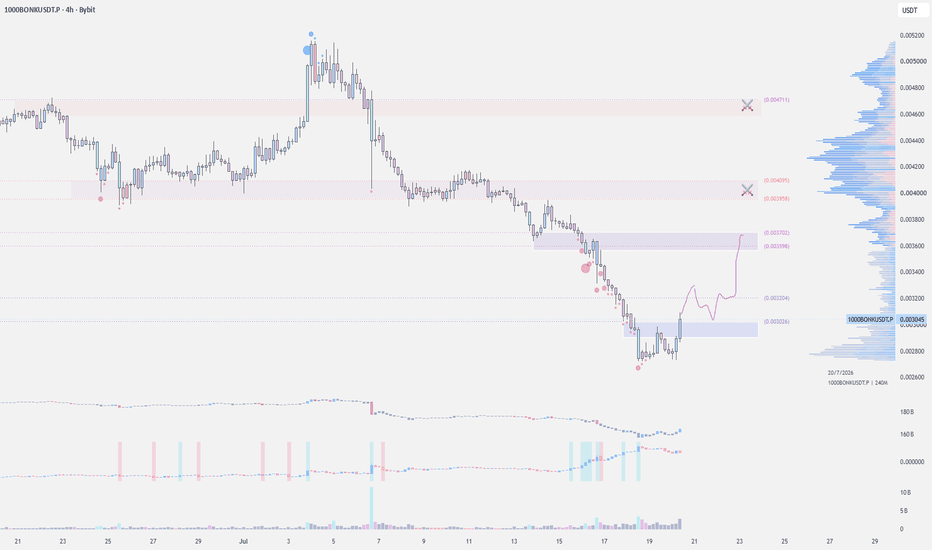
$BONK - Long Trade IdeaAfter weeks of bleeding lower, BINANCE:BONKUSDT is finally showing signs of life. Buyers are stepping in with increasing volume while price reclaims local support, making this an interesting spot for a relief rally if momentum continues.
I'm looking for continuation into the next supply zones as long as the recent low holds.
It's looking good here with volume kicking in.
Longing here at .0030–.0028s
Stop: Just below the recent low.
Targets:
TP1: .0035–.0037
TP2: .0039–.0042
TP3: .0045–.0047
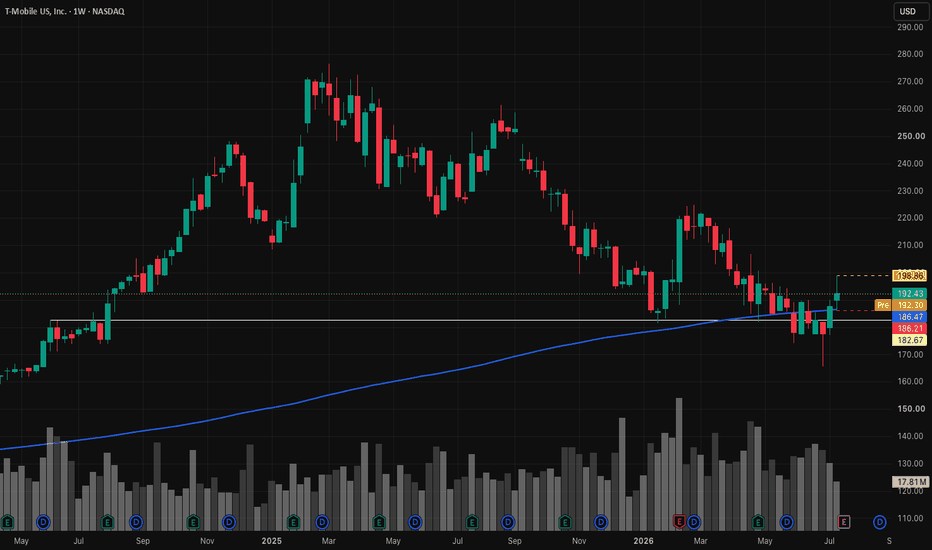
TMUS | Continued stock growth- Timeframe: Weekly
- Trade type: Buy stop order
- Price: 198.86
- Take Profit: Open
- Stop Loss: 186.21 (-6.40 %)
Idea: Long on a breakout above last week's high - bullish momentum continuation.
Entry: Buy stop above last week’s high.
Stop-loss: Below the low of the same candle.
If the weekly candle closes below this level, the trade is invalidated.
Take Profit: Trailing stop following the lows of new weekly candles.
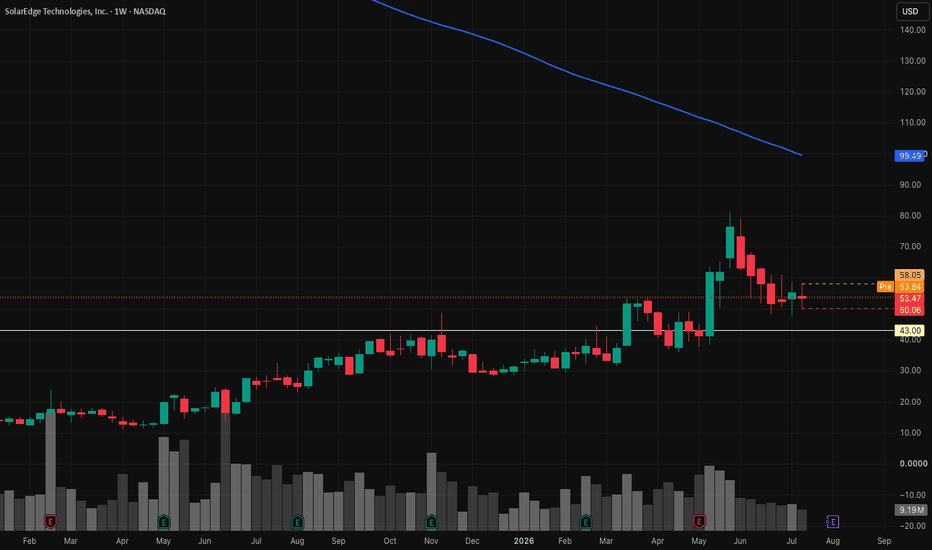
SEDG | The time to go long has come- Timeframe: Weekly
- Trade type: Buy stop order
- Price: 58.05
- Take Profit: Open
- Stop Loss: 50.06 (-13.80 %)
Idea: Long on a breakout above last week's high - bullish momentum continuation.
Entry: Buy stop above last week’s high.
Stop-loss: Below the low of the same candle.
If the weekly candle closes below this level, the trade is invalidated.
Take Profit: Trailing stop following the lows of new weekly candles.
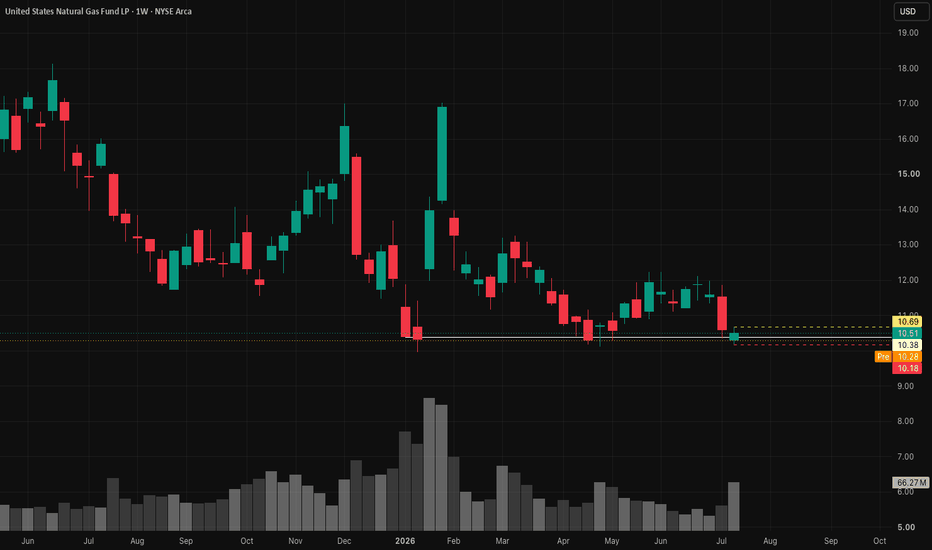
UNG | The time to go long has come- Timeframe: Weekly
- Trade type: Buy stop order
- Price: 10.69
- Take Profit: Open
- Stop Loss: 10.18 (-4.70 %)
Idea: Long on a breakout above last week's high - bullish momentum continuation.
Entry: Buy stop above last week’s high.
Stop-loss: Below the low of the same candle.
If the weekly candle closes below this level, the trade is invalidated.
Take Profit: Trailing stop following the lows of new weekly candles.
LLY | Continued stock growth- Timeframe: Weekly
- Trade type: Buy stop order
- Price: 1,196.29
- Take Profit: Open
- Stop Loss: 1,134.40 (-5.20 %)
Idea: Long on a breakout above last week's high - bullish momentum continuation.
Entry: Buy stop above last week’s high.
Stop-loss: Below the low of the same candle.
If the weekly candle closes below this level, the trade is invalidated.
Take Profit: Trailing stop following the lows of new weekly candles.