UNITDSPR: 221-Point Price Squeeze Near Decision Zone🔥 UNITDSPR: 221-Point Price Squeeze Near Decision Zone — What Happens Next? 📊
United Spirits Limited (UNITDSPR) is currently trading inside a well-defined Symmetrical Triangle pattern. The price range has been getting smaller over the last few weeks, suggesting that the stock is moving towards an important decision point.
________________________________________
📐 Chart Structure
The current pattern is formed by lower highs and higher lows.
Key Levels
Pivot A (Base High): 1,431.00
Pivot B (Base Low): 1,210.00
Pivot C (Recent High): 1,398.00
Pivot D (Recent Low): 1,229.00
As these levels continue to come closer together, the stock is moving into the narrow end of the triangle.
Pattern Measurement
Pattern Size: 221.00 Points
Upper Reference Level: 1,558.70
Lower Reference Level: 1,008.00
These levels are based on the size of the current chart pattern and are used only as reference points for educational analysis.
________________________________________
📉 What Volume Is Showing
Volume has generally been falling during May and June while the stock continues to move inside the triangle.
This is often seen in healthy triangle patterns. As buyers and sellers wait for direction, trading activity slows down and the price range becomes tighter.
A future move with stronger volume may help confirm the next phase of the trend.
________________________________________
👀 Levels Worth Watching
Situation What To Watch
Price Moves Higher Daily close above the upper trendline along with stronger volume
Price Moves Lower Daily close below the lower trendline along with stronger selling activity
At the moment, price is still trading inside the triangle, so the pattern remains incomplete.
________________________________________
⚠️ Important Reference Levels
On The Upside
1,398.00 remains an important resistance area.
A sustained move above this level would change the current chart structure.
On The Downside
1,229.00 remains an important support area.
A sustained move below this level would weaken the current pattern.
These levels help us understand whether the triangle remains valid.
________________________________________
📊 Simple Technical View
The stock is currently in a phase where neither buyers nor sellers have full control.
Price is moving within a smaller and smaller range, while volume continues to reduce. This type of setup often attracts attention because a stronger move can sometimes follow after a long period of consolidation.
For now, the chart remains a good example of how markets pause before choosing their next direction.
________________________________________
📚 Educational Note
This analysis is shared to demonstrate how triangle patterns, support levels, resistance levels, and volume behaviour can be studied on a price chart.
________________________________________
💬 Community Discussion
Would you prefer waiting for a clear daily close outside the triangle before forming a view, or are you already watching the price action closely as it approaches the apex?
Share your thoughts below.
________________________________________
Disclaimer:
This publication is intended solely for educational and informational purposes. It is based on chart structure and historical price action and should not be considered investment advice, trading advice, or a recommendation to buy, sell, or hold any security. Please conduct your own research before making any investment or trading decisions.
 Long
Long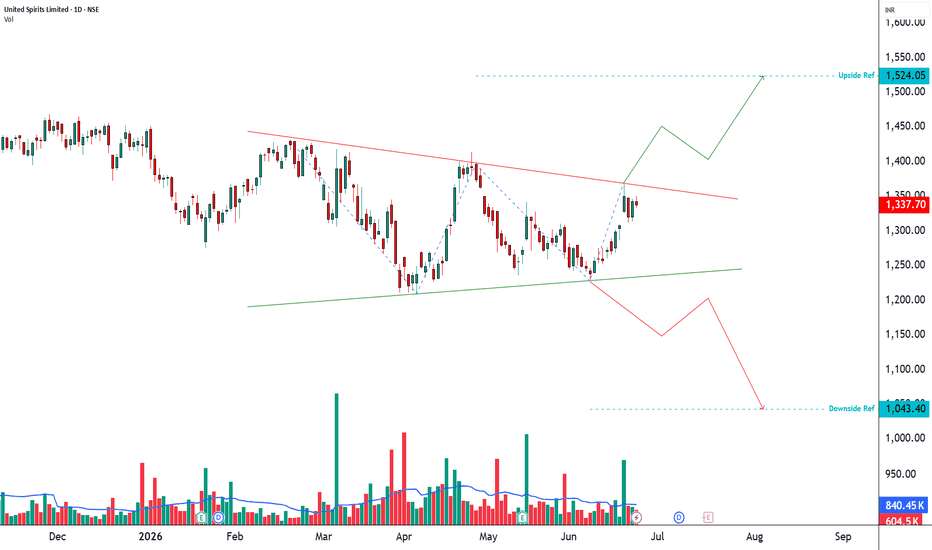
CIPLA: 278-Point Compression Near a Major Resistance Zone🔥 CIPLA: 278-Point Compression Near a Major Resistance Zone — Expansion Ahead? 📊
Cipla Limited (CIPLA) is currently trading within a tight price structure just below a key resistance area at 1,444.50. As price continues to compress beneath this supply zone, the chart is approaching a point where a larger directional move may begin to develop.
________________________________________
📐 Understanding the Current Structure
What makes this setup particularly interesting is that it can be viewed in two different ways.
Automated View
Many pattern-detection algorithms identify the current formation as a Rising Wedge, a structure created when both highs and lows continue to rise while the price range gradually narrows.
Discretionary Price Action View
When viewed manually, the same chart also displays characteristics of a classic Ascending Triangle, with price repeatedly testing a horizontal resistance zone while forming higher lows underneath.
Some traders may also recognize elements of an Inverse Head & Shoulders accumulation structure within the broader pattern.
This creates a fascinating case of structural duality, where automated and discretionary analysis arrive at different interpretations of the same price action.
________________________________________
📊 Key Structural Reference Points
Pivot A: 1,409.50
Pivot B: 1,165.70
Pivot C: 1,444.50
Pivot D: 1,341.10
Spatial Measurements
Measured Spatial Depth: 278.80 Points
Technical Upper Horizon: 1,723.00
Technical Lower Horizon: 1,062.00
These levels are derived from historical price structure and are intended as analytical reference zones.
________________________________________
📉 Volume & Compression Profile
One of the most important observations is the ongoing reduction in volatility as the pattern matures.
Price continues to trade within a narrowing range while repeatedly interacting with the 1,444.50 supply area. This type of compression often attracts attention because it reflects a temporary balance between buyers and sellers.
A future expansion in participation and volume may help confirm the next phase of market structure.
________________________________________________________________________________
🔍 Conditional Horizons
Scenario Structural Condition Reference Horizon
Upside Ref Daily close above 1,444.50 Technical Upper Horizon:
supported by increased volume participation 1,723.00
Downside Ref Failure to maintain higher lows Technical Lower Horizon:
followed by deterioration in structure 1,062.00
________________________________________________________________________________
At present, the chart remains in a consolidation phase and neither scenario can be considered active until price provides further confirmation.
________________________________________
⚠️ Structural Invalidation Parameters
For the Ascending Triangle Interpretation
Pivot D (1,341.10) remains an important structural support area.
Sustained weakness below this zone would reduce the strength of the higher-low sequence.
For the Broader Structure
Pivot B (1,165.70) represents a major structural reference point.
A move below this level would significantly alter the current long-term pattern framework.
These levels are useful for monitoring whether the existing structure remains intact.
________________________________________
📊 Technical Perspective
CIPLA currently sits at an interesting intersection between two different pattern interpretations.
The automated view favors a Rising Wedge structure, while the underlying price behavior continues to resemble an Ascending Triangle with repeated tests of a horizontal supply ceiling.
As the price range continues to tighten, market participants may focus closely on how the stock behaves around 1,444.50, as this remains the most important structural level on the chart.
________________________________________
📚 Educational Note
This publication demonstrates how the same chart can produce different interpretations when viewed through automated pattern recognition and discretionary price-action analysis. The purpose of this study is educational and informational only.
________________________________________
💬 Community Discussion
Which interpretation do you find more convincing here?
Do you favor the automated Rising Wedge perspective, or do you believe the repeated tests of the 1,444.50 horizontal supply wall reflect a stronger Ascending Triangle accumulation structure?
Share your view below.
________________________________________
Disclaimer:
This publication is intended solely for educational and informational purposes. The analysis is based on chart structure and historical price action and should not be considered investment advice, trading advice, research advice, or a recommendation to buy, sell, or hold any security. Market conditions can change without notice, and all decisions should be made after independent research and appropriate risk assessment.
 Long
Long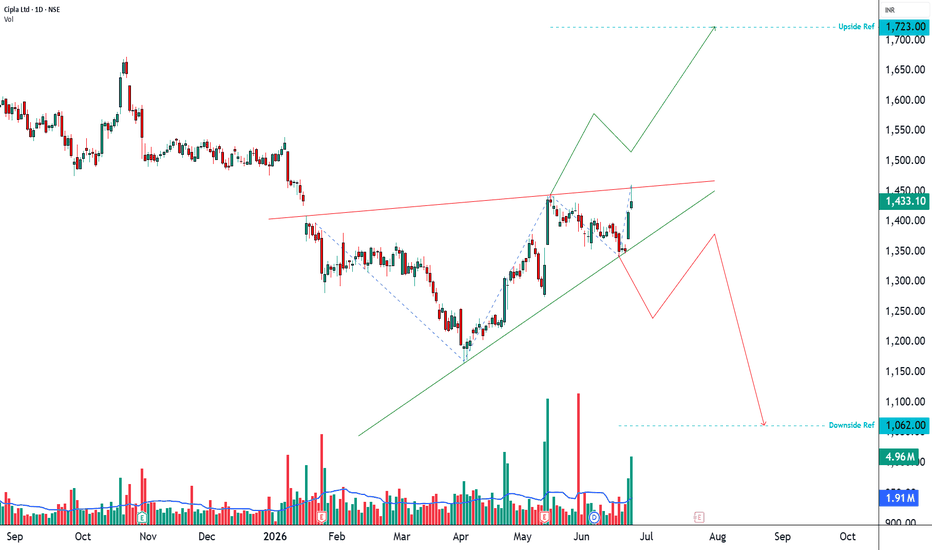
OFSS: Volatility Coiling for an Imminent 1,938-Point Move!🔥 OFSS: Volatility Coiling for an Imminent 1,938-Point Move! 🚀
Oracle Financial Services Software Limited (OFSS) is currently trading at a critical decision point as price compresses into the apex of a well-defined Symmetrical Triangle. With volatility steadily contracting and structure tightening around Pivot D, the market appears to be storing energy for a directional move that could exceed 1,900 points.
________________________________________
📐 Pattern Structure: Symmetrical Triangle
The current formation reflects a classic battle between buyers and sellers:
Pivot A (Base Low): 8,646.50
Pivot B (Base High): 10,584.50
Pivot C (Higher Low): 9,050.00
Pivot D (Lower High / Current Level): 9,925.00
This sequence of higher lows and lower highs has produced a textbook Symmetrical Triangle, a pattern known for generating powerful expansion phases once compression reaches its final stages.
Pattern Metrics
Implied Pattern Height: 1,938.00 points
Upside Ref: 11,863.00(as per pattern metrics)
Downside Ref: 7,987.00(as per pattern metrics)
The key takeaway is simple: the longer the compression persists, the more meaningful the eventual breakout tends to become.
________________________________________
📉 Volatility Profile
One of the strongest confirmations of this setup is the behavior of volume.
Throughout the May–June consolidation phase, participation has gradually diminished, producing a clear contraction in traded volume. This decline in activity is precisely what technicians expect to see during the development of a healthy Symmetrical Triangle.
Lower volume during consolidation followed by volume expansion at breakout often marks the transition from accumulation/distribution into trend continuation.
________________________________________________________________________________
🎯 Execution Triggers
Scenario Trigger Confirmation Projection
Upside Ref Daily Close above 9,925.00 Volume ≥ 2x recent average 11,863.00
Downside Ref Daily Close below 9,050.00 Strong volume expansion 7,987.00
________________________________________________________________________________
Patience is critical. Premature entries inside the triangle often result in whipsaws as price continues to oscillate within the contracting structure.
________________________________________
⚠️ Risk Management & Invalidation
For Bullish Participants
Entry only after a confirmed daily close above 9,925.00
Initial protective stop below 9,050.00
Conservative traders may trail stops as new swing lows develop after breakout
For Bearish Participants
Entry only after a confirmed daily close below 9,050.00
Protective stop above 9,925.00
Avoid initiating shorts while price remains trapped within the triangle
The most important rule here is respecting the boundaries of the structure. Until either Pivot C or Pivot D is decisively breached, OFSS remains in compression mode.
________________________________________
📊 Technical Perspective
Symmetrical Triangles are neutral by nature—they do not predict direction, they predict expansion.
At present, OFSS is approaching the latter stages of its consolidation cycle. The narrowing price range, declining volatility, and fading volume profile collectively suggest that a significant directional move may be approaching.
The market is essentially advertising one message:
A large move is likely coming. The only missing piece is direction.
________________________________________
💬 Community Discussion
Are you accumulation-heavy here or waiting for the 9,925 breakout trigger before committing capital?
Let me know your view below.
Disclaimer :
This analysis is shared purely for educational and informational purposes and should not be considered investment advice, research advice, or a recommendation to buy, sell, or hold any security. The chart patterns, price levels, targets, and technical observations discussed are based on historical price action and market structure, which may change without notice. Markets involve risk, and all trading and investment decisions should be made after conducting your own research and assessing your risk tolerance. Past performance is not indicative of future results.
BTCUSDT Short: Faces Supply Resistance – Is Another Drop Coming?Hello traders! Here’s my technical outlook based on the current BTCUSDT (4H) chart structure. BTCUSDT previously traded inside a well-defined descending channel, where sellers controlled the trend after a major pivot high. Following a bearish breakout below the channel, price dropped sharply and found support near the 62,000 Demand Zone, triggering a recovery phase.
Currently, BTCUSDT is trading below the 65,000 Supply Zone while respecting a rising demand trendline. Recent attempts to break above the supply area have failed, showing that sellers remain active around resistance.
As long as BTCUSDT remains below the 65,000 Supply Zone and the descending supply line, the bearish scenario remains valid. A rejection from current levels could push price back toward the 62,000 Demand Zone (TP1). Manage your risk!
 Short
Short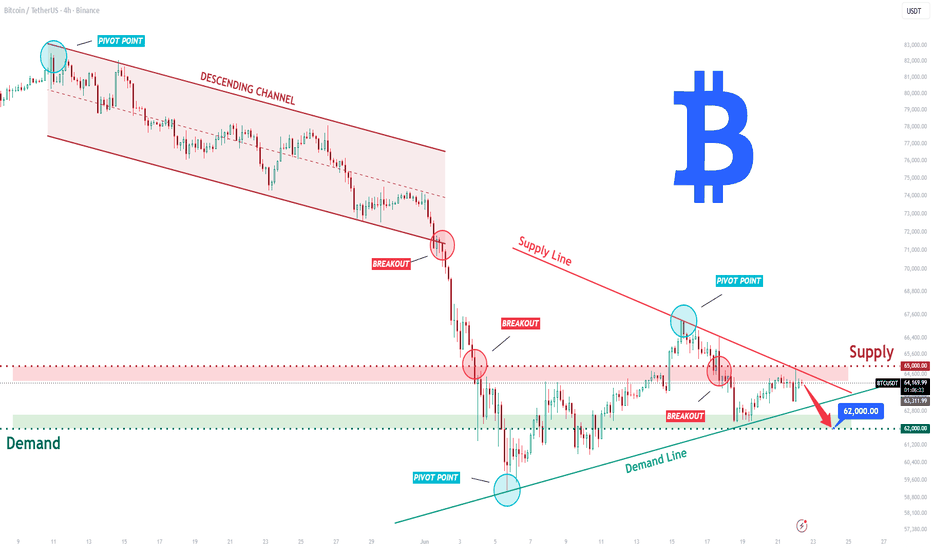
 Short
Short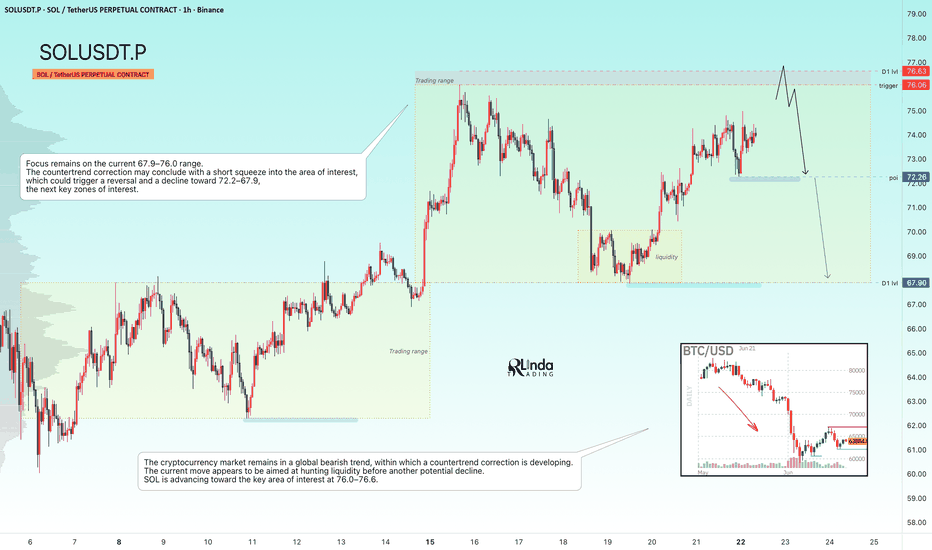
 Short
Short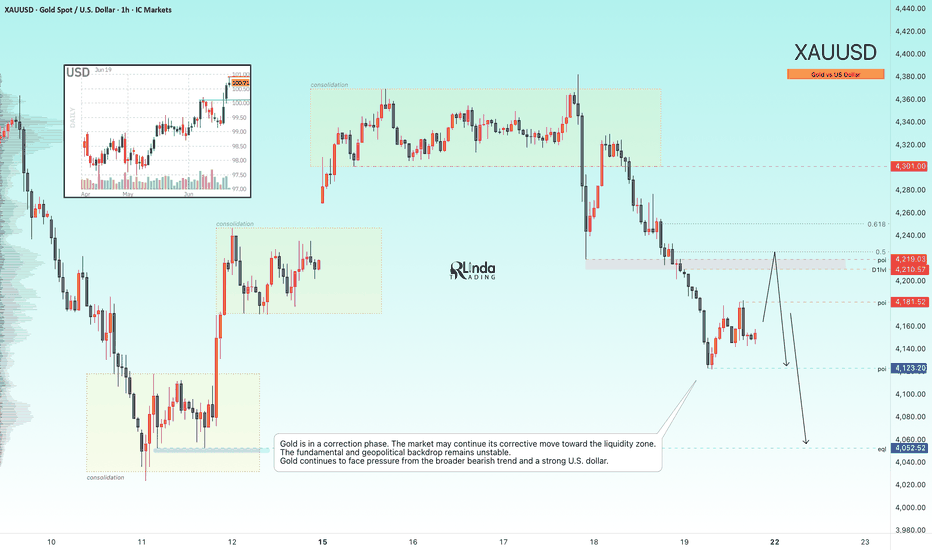
 Long
Long
 Long
Long
 Long
Long
 Long
Long
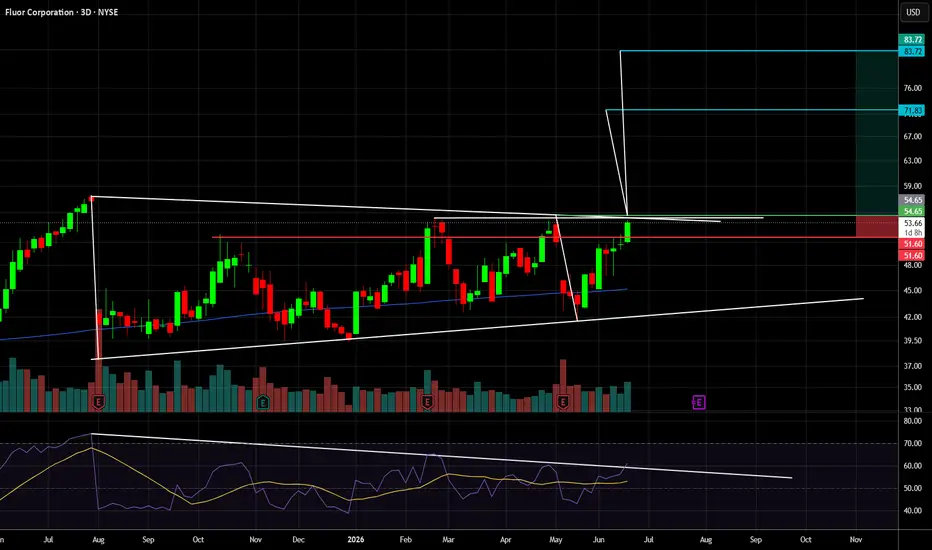
FLR- Crisp long-term Triangle About to Breakout +50% Potential The time frame that I use here is 3 days, so you can understand that it's a setup that been in a make for a while and usually the longer is the consolidation pattern, the stronger is the breakout move.
The Trade Idea-
riangles are my bread and butter, and this one is a beautiful swing setup.
The main reason I like this trade is that it’s a stock I feel comfortable holding. The price action has been relatively controlled, which makes it easier to manage compared to the high-volatility names dominating this market.
Some might say: “It’s up 29% in the last month and you call that low volatility?”
But in a market where some mega-cap names are moving 200%-300% within a month or two, a steady 28-30% move with structured price action is a completely different game.
The important thing to understand: this is not a quick momentum trade. If this setup reaches its full potential, it could take weeks or even months to play out.
Patience is the edge here, waiting for the triangle to resolve and letting the trend do the work.
Key levels to watch-
Breakout trigger- the green horizontal line at $54.65.
RSI- The RSI is forming a very similar triangle pattern, showing momentum compression. A breakout above its descending trendline would be a strong confirmation signal that buyers are gaining control and could support a successful price breakout.
Targets- Using the classic symmetrical triangle measuring method (connecting the first high to the first low, and the second high to the second low):
Stop loss- $51.6
Target 1- $71.83 (+31.4%), Risk/Reward- 5.63
Target 2- $83.72 (+53.19%), Risk/Reward- 9.53
This is not a financial advice
Disclaimer: My ideas are based on technical analysis and my personal trading approach. They are not financial advice or trade recommendations. Markets are unpredictable, and every setup can fail. Always do your own research, define your risk, and trade according to your own plan.
 Long
Long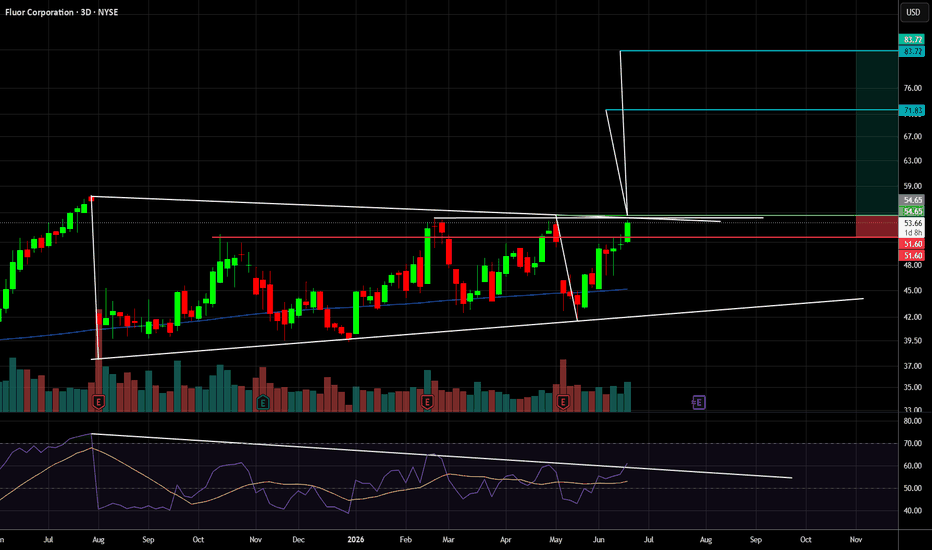
 Long
Long
ANET- Potential for 20%-30% trade with a great R/RArista (ANET) is a core AI infrastructure play: its high-speed Ethernet switches are the plumbing connecting GPU clusters in AI data centers, right sector, right time.
Price has been consolidating inside a symmetrical triangle since late April. The RSI is a useful guide here, since it's also consolidating in a triangle of its own, a breakout above the RSI triangle would be strong confirmation for the pattern.
The Trade Idea:
Trigger- B/O above $177.48
Target 1- $215.5 (+21.5%)
Target 2- $234.89 (+32.3%)
One of the best characteristics of symmetrical triangles is the favorable R/R. The chart still needs to develop before we can set a precise stop-loss, but even using $169 as our S/L, the R/R is excellent, roughly 4.4 to Target 1 and 6.7 to Target 2.
Update idea
Add note
Arthursh
Disclaimer
The information and publications are not meant to be, and do not constitute, financial, investment, trading, or other types of advice or recommendations supplied or endorsed by Tra  Long
Long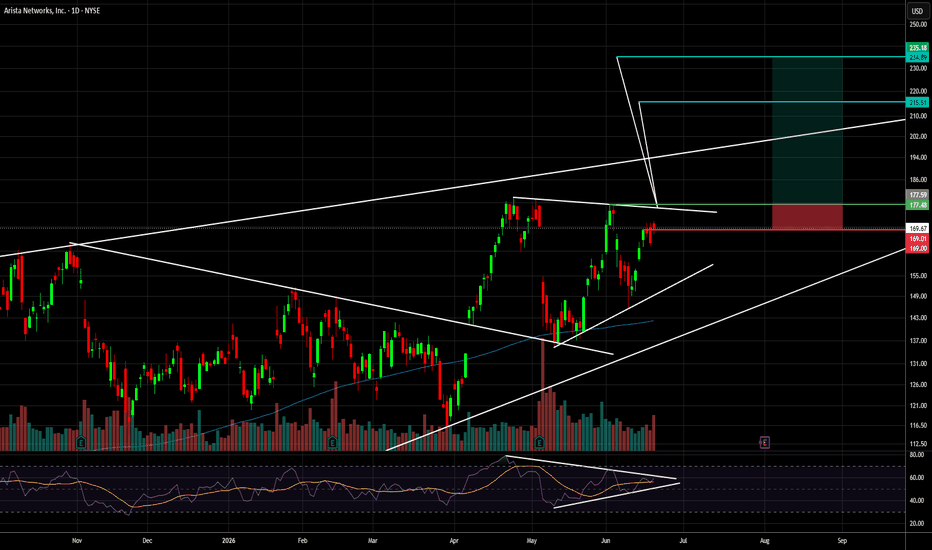
 Long
Long
XAUUSD: Retests Triangle Support – Bulls Target 4,330 ResistanceHello everyone, here is my breakdown of the current XAUUSD setup.
Market Analysis
XAUUSD previously traded below a long-term descending trendline, where sellers controlled the market through a series of lower highs. After forming a major bottom, price rebounded strongly and broke above several key resistance levels, shifting momentum back to the upside.
Currently, XAUUSD is trading above the 4,220 Support Zone while remaining below the 4,330 Resistance Zone. After breaking out of a recent consolidation range, price pulled back from resistance and is now retesting the rising triangle support line, where buyers may step in again.
My Scenario & Strategy
As long as XAUUSD remains above the 4,220 Support Zone and continues to respect the ascending triangle support, the bullish scenario remains valid. A bounce from current levels could push price back toward the 4,330 Resistance Zone (TP1).
However, a breakdown below the support zone would weaken the bullish outlook and increase the risk of a deeper correction.
That’s the setup I’m tracking. Thank you for your attention, and always manage your risk. Long 
BTCUSDT Recovery Continues Toward 69,500 Seller ZoneHello traders! Here’s my technical outlook based on the current BTCUSDT (4H) chart structure. BTCUSDT traded below a long-term descending trendline after breaking down from a consolidation range. Following a sharp decline, price found support inside the 65,300 Buyer Zone and formed a strong reversal, signaling renewed buying interest. Currently, BTCUSDT is trading above the 65,300 Buyer Zone and moving toward the 69,500 Seller Zone. Recent breakouts and successful retests confirm growing bullish momentum, while the rising support line continues to support the recovery. As long as BTCUSDT remains above the 65,300 Buyer Zone, the bullish scenario remains valid. A continuation higher could push price toward the 69,500 Seller Zone (TP1). However, a break below support would weaken the recovery outlook and favor a deeper correction. Please share this idea with your friends and click “Boost” 🚀 Long 
GOLD - A hunt for liquidity ahead of a drop to 4,400 ICMARKETS:XAUUSD has found itself in a difficult position: the Federal Reserve's hawkish stance and a strong U.S. dollar continue to weigh on the metal. Following the latest advance in the dollar, price has entered a liquidity-hunting phase
On June 17, the first FOMC meeting under new Fed Chair Kevin Warsh took place. The Committee unanimously kept interest rates unchanged within the 3.50%–3.75% range. However, the market is still pricing in one full rate hike this year, and the Fed's hawkish outlook continues to support an already bullish U.S. Dollar Index, creating additional pressure on gold.
Gold is currently trapped between three major forces: the Fed's hawkish pivot, the cancellation of negotiations in Geneva, and the technical breakdown of key support levels.
Technically, the market is forming a countertrend correction toward key liquidity zones before a potential continuation of the broader decline
Resistance levels: 4171, 4200, 4219
Support levels: 4123, 4052, 4000
Following another sharp decline, gold has stabilized around the local support level at 4123. The market may develop a corrective move aimed at sweeping liquidity before the next leg lower. The primary area of interest remains 4200–4220. A short squeeze within this zone could trigger another decline toward 4120–4050
Best regards,
R. Linda Short 
Short 
 Long
Long
ICICIGI Three White Soldiers Within a Large Ascending Triangle📊 ICICI Lombard General Insurance: Daily Technical Snapshot – Three White Soldiers Emerging Within a Large Ascending Triangle
📊STWP Equity Snapshot
________________________________________
MARKET STRUCTURE SNAPSHOT | NSE: ICICIGI | DAILY
________________________________________
• Closing Price: 1,839.00 (+48.50 | +2.71%)
• Core Trend: Downtrend (Weakening) / Recovery Structure Emerging
• Market State: Consolidation Near Breakout Zone
• Price Structure: Ascending Triangle Formation with bullish reversal characteristics
________________________________________
OPERATIONAL PRICE GRID & KEY REFERENCE LEVELS
________________________________________
• Model Reference Level: 1,844.00
• Hard Invalidation Level: 1,669.50
• Structural Risk: 174.50 (9.46%)
• Resistance Levels: R1 1,860.23 | R2 1,881.47 | R3 1,918.90
• Support Levels: S1 1,801.53 | S2 1,764.07 | S3 1,742.83
• Range Structure: Low 1,671.80 | High 1,908.90
• Higher Timeframe Observation Zones: 2,018.50 | 2,193.00
________________________________________
MOMENTUM, PARTICIPATION & CPR DATA
________________________________________
• Volume Profile: 539.56K Shares
• Volume Character: Normal Participation
• RSI Metric: 58.80 (Bullish Momentum Recovery)
• ADX Reading: 12.78 (Weak Trend Environment)
• ROC: +6.12%
• MACD Status: Recovery Phase | Momentum Improving
• Stochastic Reading: 97.10 (Strong Momentum Zone)
• Current Bias: BUY ON PULLBACKS
• CPR State: Bullish Zone | CPR Moving Up (Wide)
• Today's CPR: Pivot 1786.20 | Top 1788.35 | Base 1784.05
• Tomorrow's CPR (Projected): Pivot 1822.75 | Top 1830.90 | Base 1814.65
________________________________________
📚 EDUCATIONAL OBSERVATION
________________________________________
ICICI Lombard is displaying a constructive technical structure after spending several months consolidating within a broad contracting range. Price action has developed into what appears to be a large Ascending Triangle pattern, characterized by rising lows and a relatively stable resistance zone near the 1,900 region. Such formations often reflect gradual accumulation as buyers become increasingly willing to absorb supply at higher prices.
The dashboard identifies a Three White Soldiers pattern with an estimated reliability of approximately 64%, suggesting a strong bullish reversal signal following a period of weakness. Recent candles demonstrate improving buyer participation, with price recovering sharply from the lower boundary of the triangle and approaching the upper resistance region once again.
Momentum indicators are beginning to support the improving structure. RSI has recovered to 58.80 and remains comfortably above the neutral zone, indicating strengthening buying pressure. ROC has turned positive at 6.12%, while Stochastic readings near 97 reflect strong short-term momentum. ADX remains relatively low at 12.78, indicating that a powerful directional trend has not yet fully developed despite the recent improvement in price behavior.
The projected CPR structure remains bullish and has shifted higher, with tomorrow's Pivot projected near 1,822.75. Rising CPR structures generally indicate improving market acceptance of higher price levels and often support continuation moves when price remains above the projected range.
From a broader structural perspective, the most important level remains the descending resistance trendline near the 1,900–1,920 zone. A decisive breakout above this region could complete the larger Ascending Triangle structure and potentially shift market focus toward the higher timeframe observation zones near 2,018 and 2,193. Until such a breakout occurs, the stock remains in a consolidation-to-recovery phase rather than a confirmed expansion phase.
From a business perspective, ICICI Lombard continues to benefit from growing insurance penetration in India, increasing awareness of health and general insurance products, and long-term expansion opportunities within the domestic insurance sector. While technical analysis remains the primary focus of this report, the broader sector backdrop remains supportive for long-term growth.
Support and resistance levels should be treated as observation zones rather than predictive targets. Chart patterns, momentum indicators, volume analysis, and CPR frameworks are educational tools that help market participants understand evolving market structure within a disciplined risk-management framework.
________________________________________
⚠️ Disclaimer
________________________________________
• This analysis is provided strictly for educational and informational purposes.
• This is not financial, investment, or trading advice and should not be considered a recommendation to buy or sell any security.
• Stock market investments are subject to market risks, including the possible loss of capital.
• Past performance, historical observations, chart patterns, and technical indicators do not guarantee future results.
• Please conduct your own research and consult a SEBI-registered financial advisor before making investment decisions.
• STWP assumes no responsibility or liability for any financial loss arising directly or indirectly from the use of this information.
 Long
Long
BTCUSDT: Faces Triangle Resistance – Bearish Pullback At 63,6K?Hello everyone, here is my breakdown of the current BTCUSDT setup.
Market Analysis
BTCUSDT previously traded inside a well-defined downward channel, where sellers maintained control after a strong decline from the local highs. Following multiple bearish breakouts, price reached a major pivot low and started a recovery phase, eventually breaking out of the channel and shifting momentum back to the upside.
Currently, BTCUSDT is trading inside a large symmetrical triangle formation between the 67,000 Resistance Zone and the 63,600 Support Zone. Recent bullish momentum pushed price into the upper boundary of the triangle, but the market is now showing signs of rejection from the resistance area.
My Scenario & Strategy
As long as BTCUSDT remains below the 67,000 Resistance Zone and continues to respect the triangle resistance line, the bearish scenario remains valid. A rejection from current levels could trigger a pullback toward the 63,600 Support Zone (TP1), where buyers may attempt to defend the market again.
However, if BTCUSDT breaks above the resistance zone and confirms a triangle breakout, the bearish outlook would weaken and a stronger bullish continuation could follow.
That’s the setup I’m tracking. Thank you for your attention, and always manage your risk. Short 
XAUUSD: Retest of Resistance May Trigger Another Decline To 4240Hello everyone, here is my breakdown of the current XAUUSD setup.
Market Analysis
XAUUSD has been trading under a long-term descending trendline after failing to sustain a previous recovery. A breakout below the triangle support triggered a strong bearish move, and price continued lower through several key support levels, confirming seller dominance.
Currently, XAUUSD is trading below the 4,360 Resistance Zone while holding near the 4,240 Support Zone. After a sharp decline, price has staged a short-term rebound and is now retesting the former resistance area from below, where bearish pressure may return.
My Scenario & Strategy
As long as XAUUSD remains below the 4,360 resistance level and continues to respect the broken structure, the bearish scenario remains valid. A rejection from current levels could push price back toward the 4,240 Support Zone (TP1).
However, a breakout above resistance would weaken the bearish outlook and open the door for a stronger recovery.
That’s the setup I’m tracking. Thank you for your attention, and always manage your risk. Short 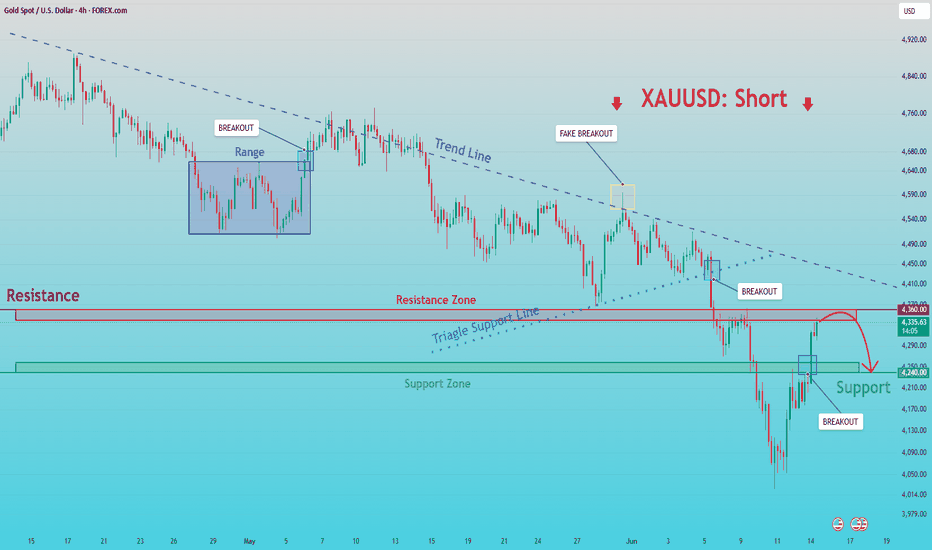
USDCAD - Retest of 1.40. Markets are awaiting the Fed's decisionFX:USDCAD maintains a strong bullish trend and is testing the 1.4000 resistance level while attempting to hold above this key threshold. The Federal Reserve meeting is now in focus
USDCAD has entered a consolidation phase ahead of major news events, with the primary focus on the Fed's interest rate decision and comments from the new Fed Chair
The U.S. dollar is currently correcting within a broader bullish trend. With key economic releases approaching and geopolitical tensions still in the background, a hawkish stance from the Federal Reserve could push the Dollar Index higher, providing additional support for the currency pair.
Resistance levels: 1.4000, 1.4024, 1.4100
Support levels: 1.3995, 1.3980, 1.3967
Within the prevailing bullish trend, price is consolidating above the key 1.3995 level. If bulls manage to defend this area and secure a close above 1.4000, it could become a technical catalyst for further upside
Best regards,
R. Linda